warwick.ac.uk/lib-publications
Original citation:Slater, Carl and Davis, Claire (2016) Using confocal scanning laser microscopy to
characterise as-cast microstructures using cooling rates representative of thin slab direct cast steels. Published in La Metallurgia Italiana, number 2 February 2016, pp. 23-30, by Associazione Italiana di Metallurgia.
Permanent WRAP URL:
http://wrap.warwick.ac.uk/99895
Copyright and reuse:
The Warwick Research Archive Portal (WRAP) makes this work by researchers of the University of Warwick available open access under the following conditions. Copyright © and all moral rights to the version of the paper presented here belong to the individual author(s) and/or other copyright owners. To the extent reasonable and practicable the material made available in WRAP has been checked for eligibility before being made available.
Copies of full items can be used for personal research or study, educational, or not-for-profit purposes without prior permission or charge. Provided that the authors, title and full
bibliographic details are credited, a hyperlink and/or URL is given for the original metadata page and the content is not changed in any way.
Publisher’s statement:
Accepted manuscript deposited with kind permission of the publisher.
A note on versions:
The version presented here may differ from the published version or, version of record, if you wish to cite this item you are advised to consult the publisher’s version. Please see the ‘permanent WRAP URL’ above for details on accessing the published version and note that access may require a subscription.
Using Confocal Scanning Laser Microscopy to Characterise As-Cast
Microstructures Using Cooling Rates Representative of Thin Slab Direct Cast
Steels.
Dr Carl Slater and Prof Claire Davis
WMG, University of Warwick, Coventry, CV4 7AL, UK
Abstract: To meet the increasing demand for better energy efficiency and higher production rates, a range of accelerated cooled continuous casting methods are being used. Replicating the solidification conditions in the laboratory is challenging but essential if issues such as segregation and microstructure development are to be understood. In this paper a method for analysing an as-cast structure both in- and ex-situ at cooling rates of 1 and 50 °C/s, using a high temperature confocal scanning laser microscope, has been detailed. The method has been developed to obtain directional dendritic solidification in an orientation that allows for solute rejection 360° around the dendrite arms, replicating that seen in bulk casting. Experiments using an Fe-Al-0.1Ti alloy at rates of 1 and 50 °C/s from 1540°C are discussed. A significant retarding effect, due to segregation, on the liquid-solid transformation kinetics was observed for the 50 °C/s sample. Thermodynamic predictions, based on the Lever-Rule (ThermoCalc) and back diffusion via the Clyne-Kurz model, have been used to predict the levels of segregation. The higher segregation expected at the faster cooling rate results in the formation of TiC in the liquid after approximately 80% solidification, whilst at the slower cooling rate TiC is only predicted to form in the liquid after
approximately 93% solidification. The predictions have been supported with optical analysis of the resultant TiC precipitate shape, distribution and morphology.
Key words: Steel, continuous casting, solidification, segregation, confocal scanning laser microscope
1.
Introduction
Since the implementation of continuous casting techniques for steels in the 1960’s, its use has increased dramatically with about 95% of the steel produced worldwide today being fabricated by this method [1]. The introduction of thin slab casting (TSC) in the 1980’s offered major advantages in term of efficiency through the reduced capital and energy needed for reheating and reduced rolling requirements [2].
A consideration for TSC production is how to control the homogeneity and refine the potentially coarse as-cast microstructure. For conventionally continuous cast thick slab steel, the reheat stage and the multiple recrystallisation steps that occur during hot deformation can act to reduce some of the inhomogeneity and refine the as-cast
microstructure. TSC relies on high cooling rates to achieve a fine microstructure required for strength, with the reduced number of recrystallisation passes during deformation giving limited further refinement, leaving the final microstructure heavily dependent on the as-cast structure. Therefore the secondary dendritic arm spacing (SDAS), segregation (macro and micro) and grain size developed during casting have a strong influence on the final properties and the relationship between these and the process parameters needs to be understood.
The cooling rates needed to simulate TSC solidification (up to 50 °C/s) are higher than those seen during thick slab casting (1-12 °C/s). Currently the laboratory techniques available to replicate the high cooling rates seen in thin slab casting are; splat testing and substrate immersion [3]. Both of these methods involve thermocouples embedded within the substrate and cooling rates are extrapolated based on heat transfer kinetics. Whilst splat testing offers very high cooling rates (>105 °C/s [4]), it results in a large amount of turbulent flow caused by the impact. This can result in a
This paper reports on direct observation and characterisation of key solidification (micro-segregation) and
microstructural (SDAS) features during solidification in Fe-Al-Ti steel at cooling rates that are applicable to TSC (1 and 50 °C/s).
2.
In-Situ Confocal Scanning Laser Microscopy (CSLM)
CSLM works by concentrating a halogen light source on a single focus point corresponding to the sample location in a crucible. A schematic diagram of the CSLM setup can be seen in Figure 1. By using a scanning laser, rather than a conventional light source for observation of the sample, the resultant image has a high resolution in the plane of focus that is unaffected by the radiation given off by the sample at high temperatures.
CSLM has been reported as a powerful tool in observing a range of solidification phenomena, such as; peritectic solidification [6], [7] and macro-segregation [8]. All these studies used a technique involving a thin concentric circular sample, where the central portion of the sample is melted, giving a stable solid/liquid interface. The sample is
subsequently cooled at rates up to 1 °C/s. The samples are ≤250 μm thick, allowing the formation of a central melt pool with no significant through thickness thermal gradient, which can then give controlled solidification via planar or cellular / primary dendritic growth. With regards to macro-segregation, Griesser et al. showed excellent correlation between experimental and predicted nickel solute distribution across a 3.5 mm solidified span, where predictions were made using DICTRA (a commercial thermodynamic/diffusion modelling software).
The emphasis of this paper is to discuss a method that can achieve the following microstructural outcomes using the CSLM:
1. The analysis of micro segregation on the scale of secondary dendritic arm spacing. To achieve this a consistent dendritic growth direction needs to be attained. This will be aided by the use of COMSOL Multiphysics software to predict the thermal gradient within the sample.
2. To allow 360° solute rejection around the coarsening dendritic arms during solidification. 3. Allow for cooling rates of at least 50 °C/s to replicate the conditions seen in thin slab casting.
[image:3.612.54.264.441.686.2]4.
To allow a range of post solidification heat treatments from quenching to slow cooling. This will allow for the analysis of back diffusion and post solidification precipitation.Figure 1: Schematic diagram to show the experimental setup of the CSLM (adapted from [9]).
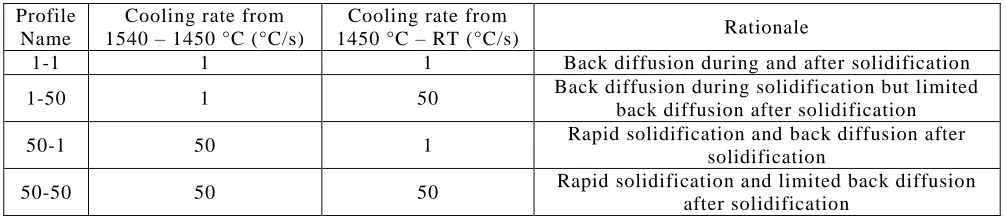
crucible and positioned within the CSLM. A roughing vacuum pump was used to achieve a 100 mPa vacuum, before back filling with 99.999% pure Ar, with the cycle being repeated three times to ensure an inert atmosphere. The sample was heated to 1540 °C (10 °C above the liquidus) at a rate of 10 °C/s and held for 3 minutes to equilibrate. In order to investigate the influence of solidification rate on the segregation profiles cooling was separated into two segments; 1540 -1450 °C and 1450°C - RT (1450 °C was chosen as this is 10 °C/s below the predicted solidus for equilibrium conditions). The cooling profiles are shown in Table 1, and were designed to allow insight into the segregation profiles directly after solidification with varying amounts of back diffusion. During cooling a video capture rate up to 60 fps was used to record solidification.
Table 1: Time/temperature profiles showing the four different profiles used in this study.
Profile Name
Cooling rate from 1540 – 1450 °C (°C/s)
Cooling rate from
1450 °C – RT (°C/s) Rationale
1-1 1 1 Back diffusion during and after solidification
1-50 1 50 Back diffusion during solidification but limited
back diffusion after solidification
50-1 50 1 Rapid solidification and back diffusion after
solidification
50-50 50 50 Rapid solidification and limited back diffusion
after solidification
Once molten the steel sample forms a hemisphere. Figure 2 shows the thermal contours within the sample during cooling; the model was created using Comsol Multiphysics v5.0 and assumes continued, low level, heating in the central region from the halogen light source, limited cooling to the crucible, due to its high thermal insulation and high temperature (typically 50-80°C hotter than the sample at peak temperature), and predominant cooling to the atmosphere from the free surface. Whilst the model had not been calibrated to provide accurate temperatures it allows the primary cooling direction and thermal gradients to be determined. It can be seen in Figure 2 that the primary cooling direction is nearly parallel to the viewing plane for the region inside the field of view. As solidification progresses, the first solid observed on the surface of the droplet will be the secondary dendrite arm tips. Figure 3 shows schematically the dendritic growth that will occur within the viewing plane using this technique, where the black regions show the surface structure that will be observed, and the grey area shows the subsurface structure. This schematic is an idealised visualisation of the dendritic structure and in practice the secondary dendrites may not grow normal to the viewing plane, however, if the secondary dendrite arms are rotated around the primary dendrite axis then two sets of secondary dendrite tips will be visible on the surface (not necessarily appearing simultaneously) and they will not be circular. Any rotation from normal to the droplet surface should not alter the SDAS or the rate of liquid-solid transformation. This technique therefore allows for the measurement of dendritic growth on the scale of the SDAS whilst also allowing solute rejection 360° around the dendrite arm. Through the use of a relatively large sample a preferential growth direction parallel to the droplet surface with a thermal gradient between the sample surface and the crucible exits.
Figure 4 shows time lapse images of three secondary dendritic arm tips that are visible on the droplet surface. The distances between the arm tips were measured at time intervals of 1/60 s from first appearance until 5 % liquid remained (the error defining the remaining liquid/solid fraction becomes much higher after this) allowing the liquid gap to be measured as a function of time. Therefore the kinetics of final solidification taking into account micro-segregation between dendrites can be observed. For this scenario t=0 is defined as the point at which the secondary dendritic arm tips first become visible on the droplet surface. Although this does not represent the true first solid condition, because the samples are of the same geometry and a number of repeat tests are carried out, comparisons between the different cooling conditions should indicate any trends in solidification and segregation behaviour.
agreement with previous bulk analysis for this steel (carried out in a Gleeble 3500 machine where solidification of samples with 10 mm diameter and 10 mm length under cooling rates of 10 and 50 °C/s gave SDAS values of 30 and 22 µm respectively) as well as literature values for a range of steels including ferritic stainless grades [5].
[image:5.612.69.523.120.344.2][image:5.612.56.293.386.497.2]
Figure 2: Modelling prediction of the thermal contours seen within the molten steel droplet during cooling. The model was created using Comsol Multiphysics v5.0. The areas marked in green refer to the field of view that was used to analyse the dendritic growth.
Figure 3: Schematic diagram to show the observed (black) and the subsurface (grey) dendritic structure that is seen within the viewing plane of the droplet surface.
Figure 4: Time lapse images taken showing three secondary dendritic arm tips coarsening in a sample cooled at 50 °C/s. The distance between the tips, marked in the first image, is measured as a function of time to obtain the boundary velocity as a function of fraction solidified.
Width (mm)
H
ei
g
h
t
(mm
[image:5.612.55.505.554.687.2]3.
Liquid to Solid Transformation
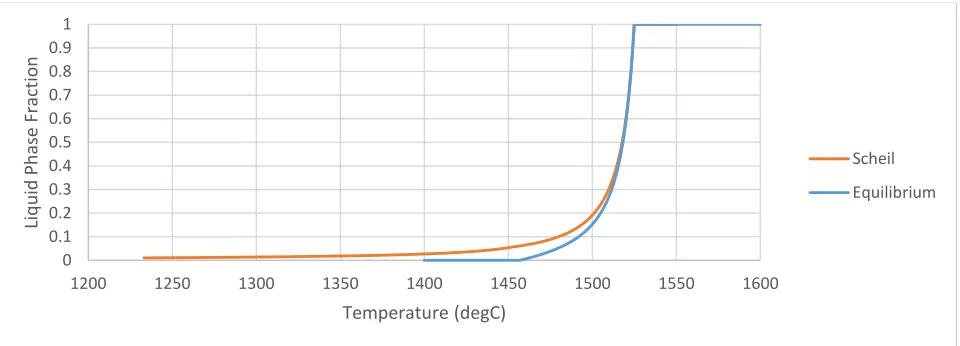
Thermo-Calc thermodynamic software has been used to predict the solid-liquid evolution with temperature for equilibrium conditions (i.e. Lever Rule) and using the Scheil analysis (Figure 5). It can be seen in figure 5 that as segregation occurs during solidification (dominated by Ti and Mn segregation in the steel in this study) a reduction in the rate of solidification (for a constant cooling rate) will occur; the amount the solidification rate decreases is influenced by the amount of segregation, with higher segregation (such as seen with the Scheil analysis) reducing the solidus temperature more than for the equilibrium condition and hence reducing the solidification rate during the final stages of solidification. The extent of segregation is influenced by the amount of back diffusion that occurs to reduce the concentration gradient. In Figure 5 the initial ≈ 60 % of solidification shows very little difference between the two prediction methods (full equilibrium and Scheil), however, the difference between the Scheil and equilibrium
[image:6.612.60.540.253.426.2]predictions of the temperature corresponding to the last 5% liquid fraction is around 70 °C with this difference increasing further for the final solidification fraction. If the final solidification temperature is depressed in such a significant fashion this should be clearly observable during cooling in the CSLM.
Figure 5: Thermodynamic predictions for the liquid-solid transformation using ThermoCalc software based on equilibrium and Scheil cooling simulations.
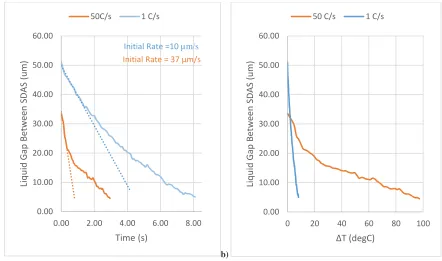
Figure 6a shows the solid-liquid interface motion for the 1 and 50 °C/s solidified samples. The faster cooling rate shows an initially high boundary velocity for the first portion of solidification, after which the rate decreases significantly. The 1 °C/s rate sample shows a much less dramatic and gradual reduction in the -ferrite boundary velocity. If segregation does not influencing the boundary velocity and cooling rate is the dominant factor then the sample solidified at the faster cooling rate should solidify 50x faster than the sample cooled at the slower rate. However, the initial rate of transformation for the 50 °C/s sample is only around 3.7x faster when compared to the 1 °/s sample (with the total time, t=0 to 5% liquid, occurring only 2.7x faster). Therefore, although at higher cooling rates solidification does indeed occur quicker, a retarding effect is acting to reduce the boundary velocity, particularly during the latter stages of solidification. The range of initial rates and total time for all the samples tested under the same condition (3 repeats for each condition) was ±4 μm/s and 0.5 s respectively. This suggests a reasonable level of consistency in the dendritic growth within the sample (and that factors such as the rotational orientation of the dendrite have little influence on the measured results).
It can be seen in Figure 6b that the observed solidification of the samples cooled at 50 °C/s occurs over a temperature range of 95 °C, compared to the sample cooled at the slower rate, which solidifies over 10 °C. As previously
mentioned, this temperature does not represent the full solidification range as the start of solidification cannot be determined, only the time at which dendrite tips are observed, and as such a much shorter range was seen than predicted (calculated to be 70 °C by Thermocalc for equilibrium conditions, Figure 5). However, for the purposes of this study, the solidification fraction at the observed start of solidification is expected to be consistent for all the samples, and therefore the relative changes seen between conditions are real effects.
0 0.1 0.2 0.3 0.4 0.5 0.6 0.7 0.8 0.9 1
1200 1250 1300 1350 1400 1450 1500 1550 1600
Liq
u
id
Ph
ase
Fract
ion
Temperature (degC)
Scheil
It is evident that the retarding force acting to slow down the dendrite growth velocity and maintain a stable liquid phase at lower temperatures can be attributed to the increased segregation seen at higher cooling rates where back diffusion is limited.
[image:7.612.64.506.115.376.2]a) b)
Figure 6: A typical measure of the transformation from liquid to solid in the inter-dendritic region plotted against a) time and b) change in temperature from time t=0. The gradient of the first 10% of dendritic growth has been plotted in order for comparison of the boundary velocities.
4.
Segregation Predictions
Several empirical methods for segregation have been developed:
1. Lever-Rule (Equation 1) assumes complete equilibrium i.e. complete diffusion of the alloying elements in the liquid and solid.
2. Scheil equation (Equation 2), assumes no diffusion in the solid and complete diffusion in the liquid) [10]. As no diffusion in the solid is accounted for the last liquid shows an extremely high concentration of solute. 3. Clyne-Kurz model (Equation 3), adapts the Scheil equation to account for back diffusion during solidification
[11] and has proven a more representative tool for predicting segregation in steel [12].
4. DICTRA is a commercial software package that allows for back diffusion and takes into account the liquid and solid solute concentrations to predict the phase balance at incremental time steps through the
solidification process (as well as considering subsequent solid state diffusion).
𝐶𝐿,𝑖= 1−(1−𝑘𝐶0,𝑖
𝑖)𝑓𝑠 (1)
Where 𝐶𝐿,𝑖 and 𝐶0,𝑖 are the liquid concentration at a given solid fraction and initial liquid concentration of element 𝑖 respectively. 𝑘𝑖 is the partition coefficient of element 𝑖. 𝑓𝑠 represents the fraction solidified.
𝐶𝐿,𝑖= (1−𝑓𝐶0,𝑖
𝑠)1−𝑘𝑖 (2)
𝐶𝐿,𝑖= 𝐶0,𝑖(1 + 𝑓𝑠(𝛽𝑖𝑘𝑖− 1))(1−𝑘𝑖)/(𝛽𝑖𝑘𝑖−1) (3) Where β represents a back diffusion parameter and can be defined by:
Initial Rate = 37 µm/s
Initial Rate =10 µm/s
0.00 10.00 20.00 30.00 40.00 50.00 60.00
0.00 2.00 4.00 6.00 8.00
Liq u id G ap Be twe en SDAS (u m ) Time (s)
50C/s 1 C/s
0.00 10.00 20.00 30.00 40.00 50.00 60.00
0 20 40 60 80 100
Liq u id G ap Be twe en SDAS (u m ) ΔT (degC)
𝛽𝑖 = 2𝛼𝑖(1 − exp (−𝛼1
𝑖)) − exp (
−1
2𝛼𝑖) (4)
Where 𝛼𝑖= 2 ((𝐷𝜆2𝑖𝑡 2)2
+ 0.1), D is the diffusion coefficient of element 𝑖, t is the solidification time and 𝜆2 is the SDAS.
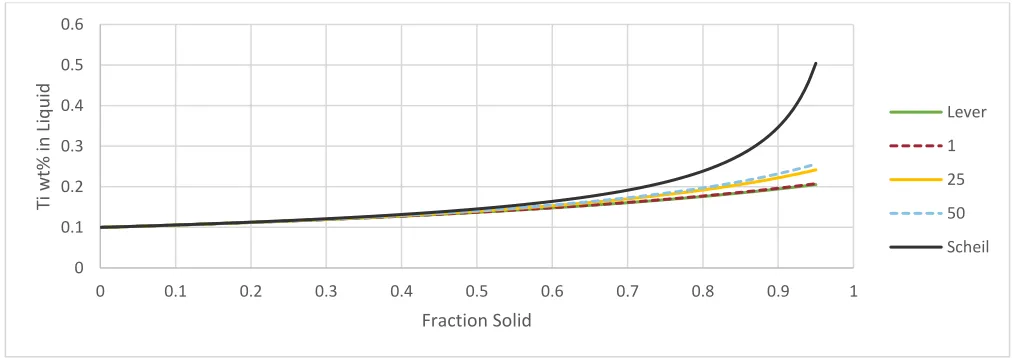
Figure 7 shows the Clyne-Kurz predicted liquid Ti solute levels during segregation at different casting rates. In order to calculate this, time steps of 0.01s were used to 95 % solid fraction. The diffusion distance (for the 25 °C/s cooling rate condition where no experimental data was available) was calculated by fitting to 𝜆2= 𝑎𝑇̇−𝑏 (where a and b are constants and are 43 and 0.31 respectively determined from experimental data on this steel and 𝑇̇ is the cooling rate).
For conventional continuous casting methods for rates of 1-12 °C/s [13] then the Clyne-Kurz model predicts segregation levels of Ti to be similar to that determined using the Lever-Rule i.e. equilibrium conditions (Figure 7), this has been seen experimentally for segregation of nickel in steel at similar rates [8]. However it has been shown that for processes such as laser welding (cooling rates of 100 °C/s and above), the Scheil equation is a much better
representation of the segregation behaviour [12]. Figure 7 shows that for the cooling rate seen in TSC of 50 °C/s, an intermediary level of segregation of Ti is expected between the Scheil and Lever-Rule predictions.
In micro-alloyed steel, precipitates, such as (Ti,Nb)(C,N), are used to give grain size control, e.g. through pinning grain boundaries during reheating. Segregation of the precipitate’s constituent elements will result in the precipitate becoming more thermodynamically stable at higher temperatures in the segregated solute rich regions. Precipitation at elevated temperatures can result in a much coarser precipitate distribution (this is particularly evident if the
[image:8.612.54.565.537.716.2]precipitates form in the liquid phase), and this will have a direct influence on later metallurgical phenomena such as grain growth or recrystallisation [14], [15]. In addition to this, the precipitates will show spatial inhomogeneity, due to segregation, in terms of their volume fraction and size.
Figure 8 shows the influence of the Ti content on the dissolution / precipitation temperature of TiC (assuming that C is a fast enough diffuser to give uniform spatial distribution), which is used as a strengthening precipitate in this steel (the nitrogen content is < 0.001 wt.% hence TiN is not formed). It is predicted that at 0.2 wt% Ti content the
precipitates will form in the liquid phase. Precipitate formation in the liquid drastically reduces the limiting factor of diffusion on coarsening, and precipitates grow at a much greater rate [16]. Therefore it is important to predict at what point during solidification the TiC precipitates will become stable (i.e. liquid Ti content reaches the 0.2 wt%
threshold). Figure 7 suggests that at a cooling rate of 50 °C/s this threshold is reached with 20% liquid remaining, compared to 7% liquid for 1 °C/s cooling. Therefore, at the higher cooling rate TiC will form earlier during
solidification when there is a greater volume of liquid such that more TiC might be expected to form, compared to the slower cooling rate samples. In addition the high fraction of liquid may allow the precipitates to be swept up by the solidification front, rather than being trapped between dendritic arms as the last liquid solidifies, influencing the spatial distribution of the (large) precipitates.
Figure 7: Evolution of the liquid Ti content as a function of solid fraction at different solidification rates.
0 0.1 0.2 0.3 0.4 0.5 0.6
0 0.1 0.2 0.3 0.4 0.5 0.6 0.7 0.8 0.9 1
Ti
w
t% in
L
iq
u
id
Fraction Solid
Lever
1
25
50
Figure 8: Thermodynamic predictions for the formation temperature of TiC in delta-ferrite – liquid with Ti content.
5.
Analysis of the as-cast microstructures
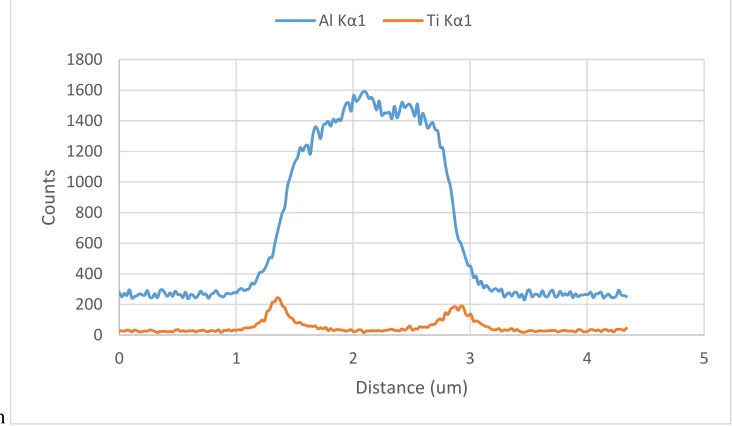
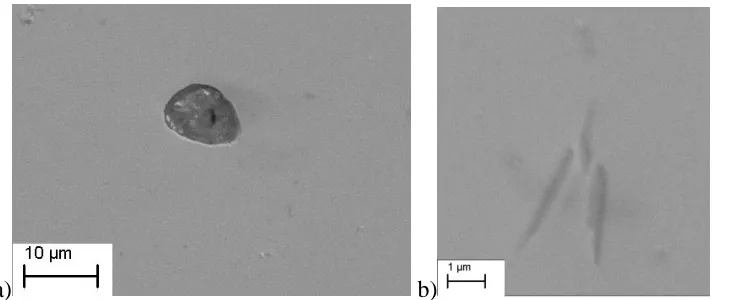
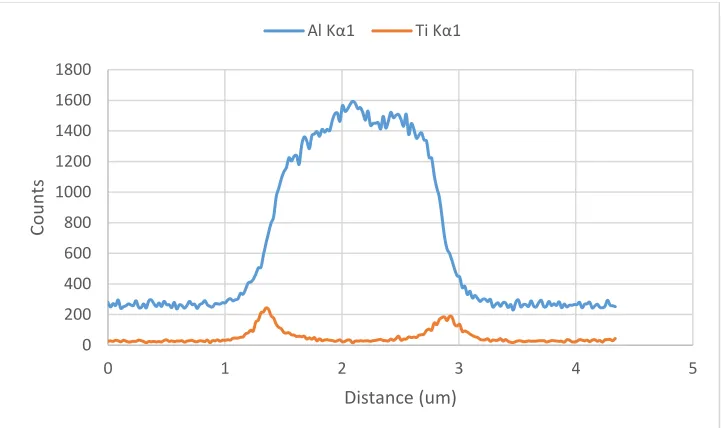
SEM-EDS analysis was carried out on all cast trials to analyse the precipitate composition, size and number density. TiC was observed to form on alumina inclusions, which are present as a result of contamination (oxidation reaction with the high Al content in the Fe-Al-Ti steel) during the initial hold at 1540 °C prior to solidification, despite the use of an inert atmosphere during the experiment. No noticeable difference was seen in the size and shape of the alumina particles observed in all samples. The majority of particles observed in these samples were either pure alumina, or alumina with a TiC coating. In the case of alumina with TiC coating the TiC layer thickness was measured (Figure 9a). At least 20 inclusions were measured for each sample assessed. An example of the compositional variation across an inclusion seen in Profile 50-50 can be seen in Figure 10.
A summary of the inclusion types seen for the different solidification profiles (summarized previously in Table 1) can
be seen in
Figure
10: A typical EDX line scan showing the Ti and Al composition across an inclusion found in a
sample cooled with Profile 1-50.
1250 1300 1350 1400 1450 1500
0 0.1 0.2 0.3 0.4 0.5 0.6 0.7 0.8 0.9
Te
m
p
era
tu
re
(d
egC
)
Ti wt%
TiC Precipitate Start
Solidus
0 200 400 600 800 1000 1200 1400 1600 1800
0 1 2 3 4 5
Cou
n
ts
Distance (um)
[image:9.612.96.462.456.669.2]Table 2
. Both the samples that were cooled at 50 °C/s (Profiles 50-1 and 50-50) during solidification show a significantly higher number density of alumina particles with TiC coating and a thicker TiC layer compared with Profiles 1-1 and 1-50. It is not possible to tell whether there is any significant difference between the 50-1 and 50-50 samples – it might be expected that the slower cooling rate after solidification (50-50 sample) might show greater coarsening of the TiC layer. The greater number of alumina inclusions with TiC coating for the faster solidified samples (50-1 and 50-50) agrees well with the predictions made from Figure 7 and Figure 8, where the 50 °C/s solidification rate was shown to result in precipitates forming at a larger volume of remaining liquid, where the larger liquid connectivity allows for almost all alumina inclusions to be coated with TiC and the larger volume of liquid forming TiC gives a higher total volume of TiC formed. At the slower cooling rate during solidification, thesegregation levels are not at strong; therefore there is a reduced amount of TiC formed (the 0.2 wt% threshold is met when there is less liquid remaining). For these samples it is also apparent that slower secondary cooling rate (1-1 profile compared to 1-50 profile) allows for diffusion of Ti and therefore a higher ratio of alumina particles are coated in TiC.
In addition to the alumina based inclusions, samples cooled with profiles 1-1 and 1-50 also contained pure TiC precipitates (i.e. not formed on alumina). These are likely to have formed where, due to the small volume of liquid remaining, no alumina inclusions were present. Figure 9b shows a typical TiC found in these samples, although TiC are expected to be globular in shape [17], these precipitates show an elongated morphology; this may be due to their formation in the very last stages of solidification, where their geometry will be restricted by the shape of the final liquid pools. Precipitates of this form have been seen in work carried out by Reid et al. [18]and were formed during the very last stages of solidification.
[image:10.612.60.431.361.511.2]a)
b)
Figure 10: A typical EDX line scan showing the Ti and Al composition across an inclusion found in a sample cooled with Profile 1-50.
Table 2: Summary of inclusion size and distribution seen in the CSLM cast samples.
Profile Inclusion Number density
(No/mm2)
Fraction of TiC coated alumina inclusions
TiC layer thickness1,2
(μm)
1-1
Alumina Alumina + TiC TiC 2.0 1.3 0.8 0.4 - 0.7 0.6 1-50 Alumina Alumina + TiC TiC 3.2 1.4 1.2 0.3 - 0.9 0.6 50-1 Alumina Alumina + TiC TiC 0.2 4.1 - 0.95 - 2.0 - 50-50 Alumina Alumina + TiC TiC 0.1 3.5 - 0.97 - 1.5 -
1Average value taken from 20 inclusions.
2The range of layer thickness varied no more than ±0.125 μm
6.
Conclusions
A method of simulating the microstructural development (segregation and secondary dendrite arm spacing) during casting conditions (principally the solidification rate) representative of thin slab casting has been investigated using a high temperature confocal scanning laser microscope. The main advantages of the method presented here are:
Direct observation of the solidification structure in-situ during cooling.
High cooling rates can be achieved that replicate those seen in thin slab casting.
360° solute rejection allowed around the secondary dendritic arm tips during solidification.
Segregation on the scale of the secondary dendritic arm spacing can be achieved.
Two stage cooling (different cooling rate during solidification and post solidification) can be used to understand the influence of back diffusion.
0 200 400 600 800 1000 1200 1400 1600 1800
0 1 2 3 4 5
Cou
n
ts
Distance (um)
[image:11.612.55.561.352.530.2]This paper has presented in-situ observations of dendritic growth in a Fe-Al-Ti steel during casting at solidification rates of 1 and 50 °C/s (representative of that during thin slab casting). The initial secondary dendritic coarsening rate was determined to be approximately 10 and 37 μm/s for the 1 and 50 °C/s cooled samples respectively, with the SDAS for the samples being 40 and 25 µm respectively. A significant decrease in the solidus temperature, and retardation in the solidification rate, was seen for the faster cooling rate sample due to increased segregation (of Mn and Ti). The Clyne-Kurz method, in addition to the Scheil and lever rule, was used to predict the range of segregation levels that may be expected for different solidification rates, including 1 and 50 °C/s. The critical Ti content (0.2 wt%) that gives TiC formation in the liquid phase was predicted to be attained with 7% liquid remaining when cooling at 1°C/s with the increased segregation at 50 °C/s reaching this level with 20% liquid remaining. These predictions were supported by observations of increased numbers of alumina inclusions with TiC layers for the 50 °C/s cooled samples.
7.
Acknowledgements
The authors would like to thank Tata Steel for providing the steel samples used in this research, EPSRC for funding (grant number EP/M014002/1), and WMG for the use of their facilities.
8.
References
[1] S. Louhenkilpi, “Chapter 1.8 - Continuous Casting of Steel,” in Treatise on Process Metallurgy, S. Seetharaman, Ed. Boston: Elsevier, 2014, pp. 373–434.
[2] T. Zhou, “Control of Microstructure during Solidification & Homogenization of Thin-Slab Cast Direct-Rolling (TSCDR) Microalloyed Steels,” McMaster University, Hamilton, Ontario, 2010.
[3] M. Ferry, Direct Strip Casting of Metals and Alloys. Elsevier Science, 2006.
[4] A. Revcolevschi, “Cooling-rate determination in splat-cooling of oxides,” J. Mater. Sci., vol. 11, no. 3, pp. 563–565, 1976.
[5] O. Volkova, H.-P. Heller, and D. Janke, “Microstructure and Cleanliness of Rapidly Solidified Steels,” ISIJ Int., vol. 43, no. 11, pp. 1724–1732, 2003.
[6] D. Phelan, M. Reid, and R. Dippenaar, “Kinetics of the peritectic reaction in an Fe-C alloy,” Mater. Sci. Eng. A, vol. 477, no. 1–2, pp. 226–232, 2008.
[7] S. Griesser, C. Bernhard, and R. Dippenaar, “Effect of nucleation undercooling on the kinetics and mechanism of the peritectic phase transition in steel,” Acta Mater., vol. 81, pp. 111–120, 2014.
[8] S. Griesser, M. Reid, R. Pierer, C. Bernhard, and R. Dippenaar, “In Situ Quantification of Micro-Segregation that Occurs During the Solidification of Steel,” Steel Res. Int., vol. 85, no. 8, pp. 1257–1265, 2014.
[9] G. N. Shannon, Y. Wang, S. Vantilt, B. Coletti, B. Blanpain, and S. Sridhar, “Observations of behaviour of oxide inclusions at molten slag / steel interfaces,” pp. 571–576, 2004.
[10] E. Scheil, “Bemerkungen zur schichtkristallbildung,” Zeitschrift Met., vol. 34, pp. 70–72, 1942.
[11] T. W. Clyne and W. Kurz, “Solute redistribution during solidification with rapid solid state diffusion,” Metall. Trans. A, vol. 12, no. 6, pp. 965–971, 1981.
[12] Y.-M. Won and B. G. Thomas, “Simple model of microsegregation during solidification of steels,” Metall. Mater. Trans. A, vol. 32, no. 7, pp. 1755–1767, Jul. 2001.
[13] S. Ge, M. Isac, R. Ian, and L. Guthrie, “Progress of Strip Casting Technology for Steel ; Historical Developments,” vol. 52, no. 12, pp. 2109–2122, 2012.
[14] O. Kwon and A. J. DeArdo, “Interactions between recrystallization and precipitation in hot-deformed microalloyed steels,” Acta Metall. Mater., vol. 39, no. 4, pp. 529–538, Apr. 1991.
[15] B. Dutta, E. Valdes, and C. M. Sellars, “Mechanism and kinetics of strain induced precipitation of Nb(C,N) in austenite,” Acta Metall. Mater., vol. 40, no. 4, pp. 653–662, 1992.
[16] D. Kalisz and S. Rzadkosz, “Modeling of the Formation of AlN Precipitates During Solidification of Steel,” vol. 13, no. 1, pp. 63–68, 2013.
[17] T. Fukuda, “Effect of titanium carbides on the ductility and toughness of high carbon 30 mass% chromium steels,” Nippon Kinzoku Gakkaishi/Journal Japan Inst. Met., vol. 69, no. 10, pp. 923–927, 2005.
![Figure 1: Schematic diagram to show the experimental setup of the CSLM (adapted from [9])](https://thumb-us.123doks.com/thumbv2/123dok_us/9481234.454344/3.612.54.264.441.686/figure-schematic-diagram-experimental-setup-cslm-adapted.webp)