http://go.warwick.ac.uk/lib-publications
Original citation:
Wang, Siyi, Guo, Weisi and O'Farrell, Tim. (2012) Low energy indoor network :
deployment optimisation. EURASIP Journal on Wireless Communications and
Networking, Vol.2012 (No.1). Article no. 193.
Permanent WRAP url:
http://wrap.warwick.ac.uk/51487
Copyright and reuse:
The Warwick Research Archive Portal (WRAP) makes the work of researchers of the
University of Warwick available open access under the following conditions.
This article is made available under the Creative Commons
Attribution-NonCommercial-NoDerivs 3.0 Unported (CC BY-NC-ND 3.0) license and may be reused according to the
conditions of the license. For more details see:
http://creativecommons.org/licenses/by-nc-nd/3.0/
A note on versions:
The version presented in WRAP is the published version, or, version of record, and may
be cited as it appears here.
R E S E A R C H
Open Access
Low energy indoor network: deployment
optimisation
Siyi Wang
*, Weisi Guo and Tim O
’
Farrell
Abstract
This article considers what the minimum energy indoor access point deployment is in order to achieve a certain downlink quality-of-service. The article investigates two conventional multiple-access technologies, namely: LTE-femtocells and 802.11n Wi-Fi. This is done in a dynamic multi-user and multi-cell interference network. Our baseline results are reinforced by novel theoretical expressions. Furthermore, the work underlines the importance of
considering optimisation when accounting for the capacity saturation of realistic modulation and coding schemes. The results in this article show that optimising the location of access points both within a building and within the individual rooms is critical to minimise the energy consumption.
1 Introduction
Recent research shows that more than 50% of voice calls and more than 70% of data traffic are generated indoors [1]. Two main wireless technologies have been used for serving users indoors. The first one is the traditional out-door cellular system which deals with real time voice, short messages and mobile broadband (MBB) applications. The other is wireless local area networks (WLANs) which focus on providing non-real time data applications [2]. Due to the increasing demands for indoor higher data-rate wireless applications, existing cellular systems will be insufficient to meet the expected quality of service (QoS) requirement for indoor users from both service coverage and capacity perspectives. The femtocell access points (FAPs) have been proposed to address the above chal-lenge, which uses low-power, short-range and low-cost base stations. Femtocells are compatible with the existing outdoor macro-cell cellular base stations which can easily support seamless handoff but provide better indoor signal strength. With the introduction of femtocell technology, serving base stations are becoming similar to the closest competing Wi-Fi technology in reality. Instead of the con-ventional cellular network infrastructure, femtocells use the IP Network as a backhaul architecture which has a lot in common with the existing 802.11 technology. Despite the huge potentials of femtocells, they still face many tech-nical and business challenges. Whilst existing research has
focused on dynamic power control and radio resource management to mitigate interference between indoor and the outdoor network, the issue of the physical deployment of the indoor network (the number and location of indoor access points (APs)) is unresolved.
1.1 Review of existing work
Several existing research [3-5] has been focusing on the improvement of femtocell network throughput. Al-Rubaye et al. [3] outlined the cognitive radio technologies for the future MBB era by proposing a cognitive femtocell solu-tion for indoor communicasolu-tions in order to increase the network capacity in serving indoor users and to solve the spectrum-scarcity problems. Ko and Wei [4] proposed a desirable resource allocation mechanism, taking into account mobile users’selfish characteristics and private traffic information to improve the femtocell network per-formance. The aggregate throughput of two-tier femtocell networks has been improved by a beamforming codebook restriction strategy and an opportunistic channel selection strategy in [5]. However, the above study did not take into account the location and the number of FAPs deployed in the indoor environment.
There also have been various approaches to investigate the optimal base station (BS) placement to achieve the operator’s desired QoS or coverage targets. Much of the previous work [6-8] has focused on minimising the trans-mitting power of BS. Fagen et al. [9] proposed a new automated method of simultaneously maximising cover-age while minimising interference for a desired level of * Correspondence: [email protected]
Department of Electronic and Electrical Engineering, The University of Sheffield, Mappin Street, Sheffield, S1 3JD, UK
coverage overlap. However, such an approach is not always practical as network optimisation is constrained by a number of restrictions on BS placements, interfer-ence and power emissions. Ashraf et al. [10] described an approach of adjusting the transmitting power of fixed positions of FAPs in the enterprise offices to achieve cov-erage optimisation and load balance, but did not consider the evaluation of the effect on the positions of FAPs. In [11], a joint power and channel allocation method was proposed to improve the uplink throughput, but the cal-culation of the throughput, which was the key parameter of the algorithm, was relatively simple and might be inac-curacy by just using Shannon capacity equation. Ki Wo et al. [12] derived the downlink SINR formula for the residential femtocell but the formula did not take the throughput into account while researchers in [13] pro-vided system simulation to evaluate the femtocell net-work performance, however the simulation was relatively simple without an extensive theoretical model verifica-tion. A theoretical framework was proposed in [14] to analyse the interference characteristics of different femto-cell sub-bands for Orthogonal Frequency-Division Multi-ple Access (OFDMA) systems employing the Fractional Frequency Reuse scheme which could be extended to optimise power and frequency allocation, but the path-loss model employed in this framework is far too simple to reflect the real characteristics of the indoor scenario.
Bianchi proposes a classic two-dimensional Markov chain to determine the saturation throughput of a Wire-less Local Area Network (WLAN) using the Distributed Coordination Function (DCF) [15]. Tay and Chua [16] proposed a model based on average value analysis and stu-died the effects of contention window sizes on the throughput performance. Both of the above models assumed an ideal wireless channel with no physical layer (PHY) channel errors. In fact, wireless channels are usually error-prone and the packet errors have an impact on the system performance. Several articles has extended the above system models to study the throughput perfor-mance under different channel error conditions.
1.2 Contribution
Given the large number of propagation variables in indoor buildings and its relation to the outdoor cellular network, the article provides a best practice in optimising AP deployment with very little signal to interference-plus-noise ratio (SINR) degradation for micro-cell users. The novel contribution is the simulation results and the theoretical framework that reinforces the key deployment solutions. Our baseline results are reinforced by novel theoretical expressions. Moreover, for a given building size, the trade-off between increased QoS and power con-sumption, as well as the capacity saturation points are
demonstrated. An approach has been introduced to study the saturated throughput, user QoS and energy con-sumption performances of 802.11n networks under error-prone channels by extending Bianchi’s model.
2 Body of investigation
The article considers two indoor deployment scenarios and shows that there is a shared principle of deployment between them:
●Concept demonstration: Single Room with and without an outdoor interference source (Simulation and theory);
●Generic building with multiple rooms on multiple floors with an outdoor interference source (Simulation).
The combined results of the two scenarios will lead to a general low energy indoor deployment rule. Moreover, the single room femtocell results are reinforced with a novel theoretical framework that can optimise the loca-tion of an AP with respect to the interference and pro-pagation parameters. It is shown that the key results hold for a multiple room building. There is only 1 out-door interference source considered, because given that a building is inside the coverage of a cell, the interfer-ence of that cell will be far greater than neighbouring cells that are further away.
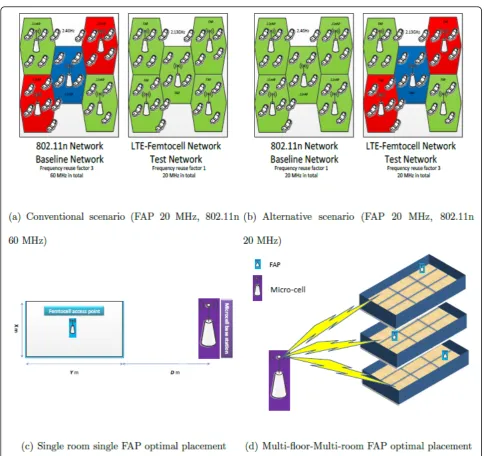
In the baseline conventional scenario (Figure 1a), 802.11n APs are deployed on three non-overlapping channels using a total bandwidth of 60 MHz while FAPs are assumed to operate on the same frequency with a total bandwidth of 20 MHz. In the alternative scenario (Figure 1b), both 802.11n APs and FAPs have a total bandwidth of 20 MHz with different frequency reuse pattern 1 and 3, respectively. The system model and theoretical framework for FAP considers the following setup as shown in Figures 1c,d.
The article aims to provide the comparison between these two technologies in their basic service in reality, hence the advanced feature of 802.11n such as frame aggregation to MAC layer and input multiple-output (MIMO) and 40 MHz channels to the PHY are outside the scope of this study.
● LTE-femtocell Simulation: Co-channel FAPs employing SISO transmission and Round Robin (RR) scheduling. The link level capacity is derived from adaptive modulation and coding schemes. This is simulated for a single room and a building with mul-tiple rooms.
with a theoretical contention model. The link level capacity is derived from adaptive modulation and coding schemes. This is simulated for a single room. ● Single Room Theory: Single LTE-femtocell deployed in a single room in the presence of a fully loaded outdoor micro-cell BS.
2.2 LTE-femtocells simulator model
The user distribution for each room or building is ran-dom even distribution. The position of each user and the traffic conditions are updated within each loop and the simulation results are run enough times to reach convergence. RR scheduler is employed, which evenly
partitions the resource blocks between users. In this simulator resource allocation is performed at intervals of 1 ms in the time domain. This interval is called a transmission time interval (TTI) [17].
The path loss models implemented in the simulator were adopted from WINNER II [18]. The indoor path loss model PLinin dB (between the FAP and the mobile
user) and the outdoor-to-indoor PLout-to-in in dB
(between the micro-cell BS and the mobile user) are defined as follows, respectively:
PLin= 18.7log10(dFAP) + 46.8 + 20log10
f 5
[image:4.595.56.544.83.539.2]
, (1)
PLout–to−in= 36.7log10(dmicro) + 22.7 + 26log10
f
5
+ PLwal1+ 0.5din, (2) where f is frequency of transmission in GHz. dFAP,
dmicro and din are FAP-to-user, micro-cell-to-user and wall-to-user distance in metres. PLwall is the wall loss
penetration factor in dB. The received SINR is calcu-lated as below:
γ = |hi|
2P
i
K
k=1,k=1|hk|2Pk+|hmicro|2Pmicro+σ2
, (3)
wherehi,hkandhmicro∼CN(0, 1)are the multi-path
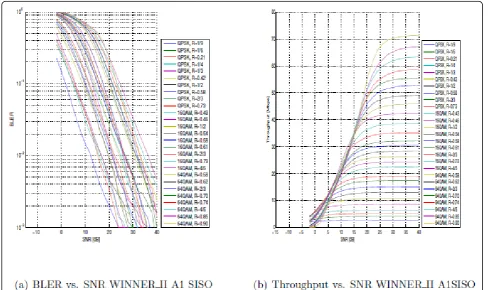
coefficient of the observed FAP, interfering FAPs and micro-cell BS, respectively. They are modelled as inde-pendent and identically distributed (i.i.d.) circularly sym-metric complex Gaussian random variables with zero mean and a variance of one.Piis the received power of one sub-carrier from the observed FAP, Pk and Pmicro are the received power of the same sub-carrier from the interfering FAPs and micro-cell BS and s2 is the noise power. The simulator supports link adaptation by chan-ging the Modulation and Coding Scheme (MCS) based on the channel quality g(i.e. SINR). The MCS look-up tables was generated from the Vienna link level LTE simulator [19] under WINNER II indoor multipath model [18]. The corresponding block error rate (BLER)
and throughput versus signal to noise ratio (SNR) curves of the look-up tables are illustrated in Figure 2. The instantaneous user data rate in each TTI is calculated by the multiplication of the number of bits per resource element obtained from the relative link adaptation table and the number of resource elements that a user has been assigned. The RAN capacity is then calculated on the basis of each user’s data rate. User QoSrequirement is defined as a threshold on the percentage of users that can achieve the target data rate. From the network ser-vice point of view, a technology with a specific network configuration can be said to satisfy the network QoS requirement only if the percentage of users that achieve the targeted data rate is larger than the percentage threshold of User QoS, under any given network topol-ogy. For example, the QoS requirements for the network service is set to 0.5 Mbit/s target data rate and 95%-ile threshold in this report, it means that the network satis-fies QoS requirements only if at least 95% of users achieve a minimum data rate of 0.5 Mbit/s. The RAN QoS is computed by multiplying the user QoS and the number of the users in that RAN.
2.2 802.11n simulator
[image:5.595.55.544.421.711.2]The 802.11n simulator is based on an existing through-put analytical model [15]. The model is concerned with
infrastructure mode WLANs that use the DCF medium access control (MAC) protocol. The model assumes that there are a number of 802.11n APs operating on three different frequency channels in conventional scenario and one frequency channel in deployed indoors and a fixed number of client stations in the WLAN. Each user is associated with exactly one AP which provides the highest SINR to that user and each AP with its asso-ciated stations defines a cell. Therefore, DCF is used for single-hop only communication within the cells and users access data through their serving APs. Each user is assumed to have saturated traffic. The wireless channel bit error rate (BER) is Pb. The minimum contention window size isWand the maximum backoff stage ism. In 802.11 WLANs, control frames are transmitted at the basic rate which is more robust in combating errors. They have a much lower frame error rate as the size of these control frames are much smaller than an aggre-gated data frame. Therefore, the frame error probabil-ities for control frames and preambles are assumed to be zero.
The system time is divided into small time slots where each slot is the time interval between two consecutive countdowns of backoff timers by stations which are not transmitting. From Bianchi’s model, transmission prob-abilityτin a virtual time slot is given by:
τ = 2(1−2p)
(1−2p)(W+ 1) +pW(1−2p)m, (4)
where pis the unsuccessful transmission probability conditioned on that there is a transmission in a time slot. When considering both collisions and errors,pcan be expressed as:
p = 1- (1 -pc) (1−pe), (5)
wherepc= 1−(1−τ)n−1 is the packet conditional colli-sion probability and pe= 1−(1−pb)L is the packet error probability on condition that there is a successful trans-mission in the time slot.nis the total number of con-tending stations. Lis the packet size in bits andpbis the BER of a particular MCS level. Therefore, the net-work saturation throughput can be calculated as:S= Ep
Et,
where Epis the average packet payload bits successfully transmitted in a virtual time slot, andEtis the expected length of a time slot.Epand Etare computed by (6) and (7):
Ep=Lps=Lptrps–nc(1–pe), (6)
Et=Tσpσ+Tcptr(1−ps−nc) +Tepe+Tsps, (7)
where the probability of an idle slotpsis (1−τ)n, the
probability of a non-collided transmission ps_nc is
n(1−τ)n−1
ptr , the probability for a transmission in a time slot
ptris 1−ps= 1−(1−τ)n, the probability of a
success-ful transmission (without collisions and transmission errors) isptrps_nc(1−pe) and τis computed by (4).Tsis
equal to the system’s empty slot time of 9μs. Ts, Tc Ts andTeare the idle, collision, successful and error virtual time slot’s length and are defined as follows: Tc= EIFS,
Ts = DATA + BACK + 3SIFS + DIFS, Te = DATA + EIFS + 2SIFS, where BACK = 5.63μs and DATA are the transmission time for backoff stage and the transmission time for aggregated data frame, SIFS = 16μs, DIFS = SIFS +Ts, EIFS = SIFS + DIFS + BACK, respectively. 48
of the 52 OFDM sub-carriers are for data and the remaining 4 are for pilot sub-carriers.
3 Power and energy metrics
The power consumption model employed by this article considers the FAP and 802.11n APs to have the same model. This assumption is reinforced by existing litera-ture [20]. The model considers the power consumption of an AP to have two distinct parts: a radio-head (RH) and an overhead (OH). Together the RH and OH con-stitute the operational (OP) power consumption of the AP. During transmission, the RH is active, and irrespec-tive of transmission, the fixed OH is always acirrespec-tive.
In order to compare the energy consumption of the same system operating in different conditions, the con-cept of transmission and OP duration are defined. Con-sider an AP with indoor users that demand a traffic load of M bits of data over a finite time duration of TOH
AP.
Two systems are considered: a reference and a test sys-tem, both of which have a capacity that exceed the offered traffic load. Due to the fact that the reference and the test system might have different throughput, the duration which the RH spends in transmitting the same
M bits is different. In order to compare the energy of the two systems, a useful metric is the energy reduction gain (ERG), which is the reduction in energy consump-tion when a test system is compared with a reference system:
ERGOPRAN= 1−E
OH AP,test
EOPAP,ref. = 1−
nPRH
testRRAP,testtraffic +nP
OH test
nPRHref.Rtraffic
RAP,ref. +nP
OH ref.
, (8)
wherePRF
i , PRHi andPOHi are RF power, RH power and
OH power, respectively. The RH power is defined as
PRF
i /μ =PRHi , where μΣ is the RH efficiency [20]. The
throughput of the system is defined as RAP,i=M/TAPRH,i,
which is greater or equal to the offered load:
Rtraffic=M/TAPOH. The term
PRH
i
RAP,iin (8) is an indication of
measure energy consumption in literature, and is known as the energy-consumption-ratio (ECR) [21].nrefers to the total number of APs.
For a given offered load demanded by users, a more spectral efficient deployment is able to transmit the same data for a short transmission time. Over time, this amounts to a reduction of the RH energy consumption. The energy saving caused by spectral efficiency alone is upper-bounded (ERG threshold) by the ratio of OH to OP. This
upper-bound
ERGOPRANupper−bound= P
OH test
Pref.RH+POHref. =
POH
test
POPref.
can be
obtained whenRAP,testin Equation (8) approaches infinity on the condition that the same number of APs deployed for both reference and test systems is considered. In order to significantly reduce energy consumption further, a reduction in the number of APs is required to meet the QoS needed. This can only be accomplished by signifi-cantly improving the overall throughput of the AP deploy-ment. This article proposes novel location optimisation simulation and theoretical results to achieve this.
4 Simulation and theoretical results
4.1 Single room AP number
4.1.1 Conventional scenario
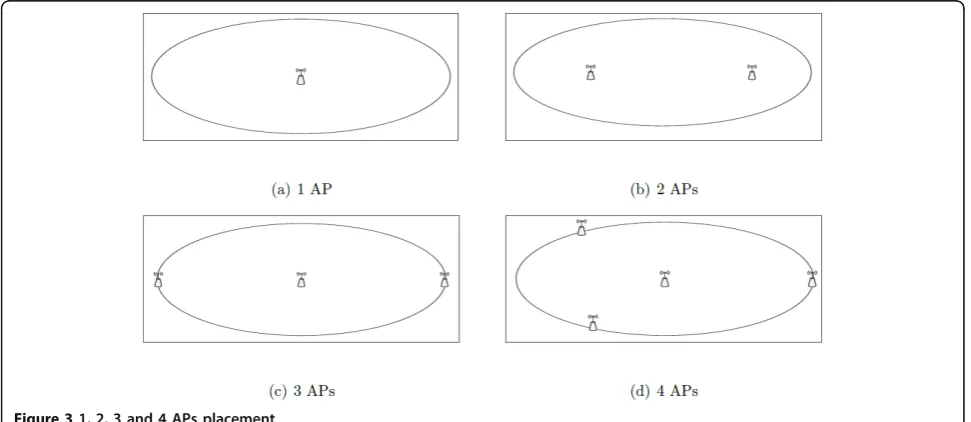
In the single room scenario, the article has investigated the maximum downlink user QoS achieved by at least 95% of the users and the average user data rate. This was done by the simulation only. A total number of 50 users are distributed randomly and uniformly across the whole indoor room whose area is 20 m × 16 m. Only one single floor building without light internal walls (e.g. plaster board) is considered. Due to the omni-directional radiation pattern of the AP, its
deployment was conducted to minimise the mean dis-tance from users to AP. Therefore, there is always one AP deployed in the middle of the room except for the case of two APs, in which case they are placed at the foci of the ellipse layout. For the remaining deploy-ments, all other APs excluding the middle one are placed evenly around the circumference of the ellipse as shown in Figure 3.
Investigation of optimal FAP placement and interfer-ence management will be described in the next sub-sec-tion. It is shown that 1 FAP can achieve the highest
user QoSand average user data rate of just over 1 Mbit/ s with SISO deployment owing to the absence of any interference. It is worth mentioning that there is a 43% improvement in the spectral efficiency when using 1 FAP as compared to 1 802.11n AP as shown in Figure 4a. This gain is due to the different scheduler mechan-ism as well as the link level MCS between LTE-femto-cell and 802.11n network. For the same bandwidth, LTE-femtocell employs a more spectral efficient adap-tive MCS than 802.11n. 1 FAP offers 4.44% ERG against 1 baseline 802.11n AP with SISO deployment. This is shown in Figure 4d. It was found that for a single AP deployment, a single FAP is more spectral and energy efficient than a single 802.11n AP.
[image:7.595.56.542.512.723.2]As the number of APs is increased, the 802.11n deployment is always more spectrally and energy effi-cient due to the increased operating bandwidth of 60 MHz with frequency reuse pattern 3, compared to the LTE bandwidth of 20 MHz with frequency reuse pattern 1. As the number of 802.11n APs increases to beyond 3, the interference that arises between the APs will cause a degradation of overall downlink user QoS and average user data rate performance. For the number of APs
greater than 2, 802.11 APs provides 2.61 to 21.80% ERG over the FAP deployment. The results are shown in Fig-ure 4b,d.
Therefore, for a single AP deployment, an LTE FAP is more spectrally and energy efficient than an 802.11n AP. This is true both with and without a fully loaded micro-cell interference source. In order to achieve a higher user QoS performance, deploying more 802.11n APs is the more spectrally and energy efficient. No more than 3 802.11n APs should be deployed in the same room; any more causes mutual interference and degrades the aggregate QoS received by the users.
4.1.2 Alternative scenario
The alternative scenario is defined in the body of investigation, in which both FAPs and 802.11n APs have a total bandwidth of 20 MHz with different fre-quency reuse pattern 1 and 3, respectively. The result of 1 FAP and 1 802.11n AP for both conventional and alternative scenarios are identical as shown in Figure 4a. Figure 4c,d, average user data rate and ERG
performance for 1 FAP and 3 FAPs in both conven-tional and alternative scenario with a baseline 802.11n network. In the alternative scenario, FAP outperforms 802.11 AP when the number of APs is 3. The average user data rate for three FAPs is 1.12 Mbit/s while this value for 3 802.11APs is 0.22 Mbit/s. This is because 802.11 AP suffers server interference from other APs in the alternative scenario and its PHY adopts convo-lution codes which is less efficient than turbo codes used in LTE-femtocell. Figure 4d indicates three FAPs provides an ERG of 20.08% in alternative scenario while 3 802.11n APs offers an ERG of 21.80% in con-ventional scenario. Hence FAP investigation is particu-lar interest in the following sections.
4.1.3 Remarks
[image:8.595.56.539.348.686.2]The results in Figure 4a covers the results of all four possible combinations of comparison between one FAP and one 802.11n AP in either conventional or alterna-tive scenario while the results in Figure 4c contains the same number of combinations results for the case of 3
FAPs and 3 802.11n AP. These four possible combina-tions are conventional FAP versus alternative AP and conventional AP versus alternative FAP besides the other two which have already been covered in the above sections. It is worth mentioning that 3 FAPs in conven-tional scenario is more energy efficient than 3 APs in alternative scenario. This is due to the mutual impact from the the different scheduler mechanism and coding scheme applied in both systems.
4.2 Single room AP placement
Previously, the optimal number of APs to deploy in a single room has been considered. The conclusion was that for a low QoS target, 1 FAP is the most energy effi-cient deployment. For higher user QoS targets, 2-3 802.11n APs should be deployed. Next, simulation is used to determine where to place the 1 FAP given that there is an outdoor interference source from a micro-cell, and where to place 2-6 co-frequency FAPs that interfere with each other. Furthermore, result of 1 FAP with a theoretical background has been reinforced, which can be found in the Appendix of this article.
4.2.1 1 FAP
The optimal placement of 1 FAP is judged according to the strength of the outdoor micro-cell source. Another baseline FAP deployment has been considered for com-parison. In this baseline scenario, FAP is placed at the corner of the room where the power socket is typically located.
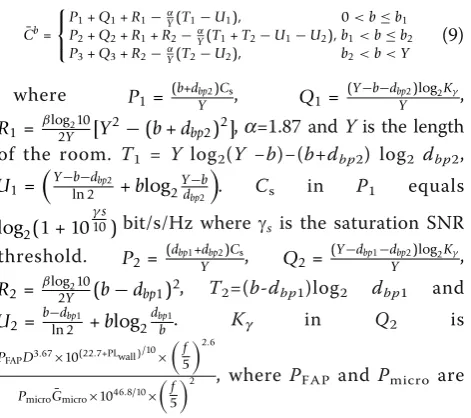
The expression of the mean capacity of the femtocell network with respect to the position of the FAPb can be expressed as:
¯
Cb=
⎧ ⎨ ⎩
P1+Q1+R1−α
Y(T1−U1), 0<b≤b1
P2+Q2+R1+R2−αY(T1+T2−U1−U2),b1<b≤b2 P3+Q3+R2−α
Y(T2−U2), b2<b<Y
(9)
where P1= (b+dbpY2)Cs, Q1= (Y−b−dbpY2)log2Kγ,
R1= βlog2Y210[Y2−(b+dbp2)2],a=1.87 andYis the length
of the room. T1 = Y log2(Y −b)−(b+dbp2) log2 dbp2,
U1=
Y−b−d
bp2
ln 2 +blog2Yd−bp2b
. Cs in P1 equals
log2(1 + 10γ
s
10)bit/s/Hz where gs is the saturation SNR threshold. P2= (dbp1+Ydbp2)Cs, Q2=(Y−dbp1−dYbp2)log2Kγ,
R2= βlog2Y210(b−dbp1)2, T2=(b-dbp1)log2 dbp1 and U2= b−ln 2dbp1 +blog2
dbp1
b. Kg in Q2 is PFAPD3.67×10(22.7+PLwall)
/10 × f 5 2.6
PmicroG¯micro×1046.8/10×
f
5
2 , where PFAP and Pmicro are
the transmitting power of FAP and micro-cell station, respectively.G¯microis the expected value of the antenna
gain from the micro-cell BS. f is the operation fre-quency. dbp1 =B exp [−W(F) and dbp2 =B exp [−W
(−F)] where B= 1020bα
⎛ ⎝ Kγ
10 γs 10 ⎞ ⎠ 1 α
, F=ln 1020αB, Wis
Lam-bert W function. Finally, P3= (Y−b+Ydbp1)Cs,
b1= α
Kγ
10 γs
10
,b1= α
Kγ
10 γs
10
andb2=Y− α
Kγ10βY
10
γs
10 .
It can be shown that the function is convex and that according to the first rule of finding the maximum value of a function, stationary points can be deter-mined by differentiating Equation (9)
Note :∂dbp1
∂b =
Bexp[−W(F)] ln 10 20α[1+W(F)] and
∂dbp2
∂b =
Bexp[−W(−F)] ln 10 20α[1+W(−F)]
and then solving the differentiated function for zeros. The resulting expression is a closed form expression, but is unfortunately too long for the scope of this article. All the stationary points are tested in order to verify the type of the stationary points (max) by checking if the corresponding value in the second-order differential function of Equation (9) is negative. Finally, the mean capacity value(s) corresponding to all the stationary points are compared with all endpoints of the interval of each sub-function in Equation (9) and the global maximum value is selected as the maximum of mean capacity. The solution bopt is the optimal coordinate for FAP placement. Detailed derivations of Equation (9) can be found in the Appendix.
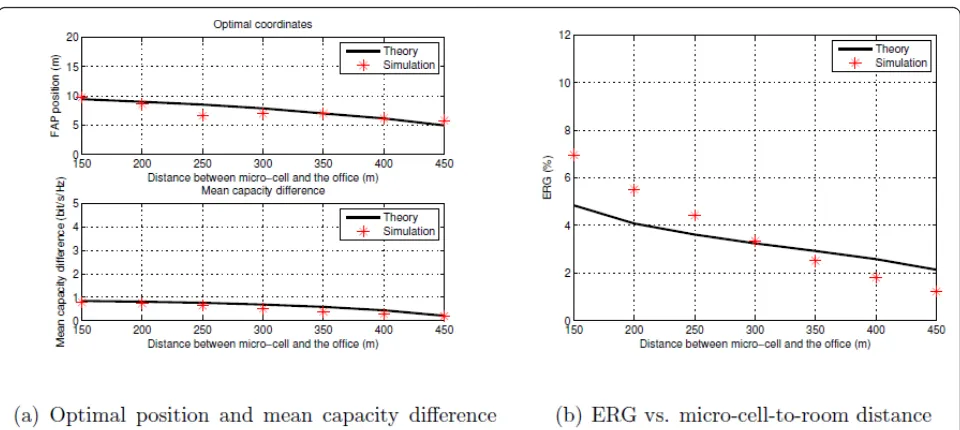
[image:9.595.58.294.474.683.2]The result of the mean capacity difference between the optimal and the conventional is illustrated in the sub-plots of Figure 5a. The theoretical results are shown in lines and are compared with the simulation results shown as symbols. The parameters used in the investi-gation are as follows: office size (10 m ×20 m), system bandwidth (20 MHz), carrier frequency (2,130 MHz), total number of users (10), sub-carriers per Physical Resource Block (12), FAP transmitting power (0.1 W), micro-cell transmitting power (20 W), FAP RH effi-ciency (6.67%), FAP OH power (5.2 W), micro-cell dis-tance away from the room (150-450 m), and Wall loss (10 dB).
without which the FAP’s optimal location is always likely to be in centre of the room.
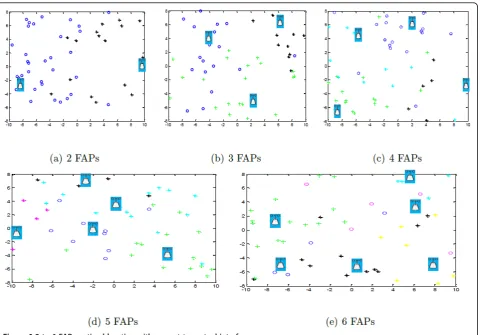
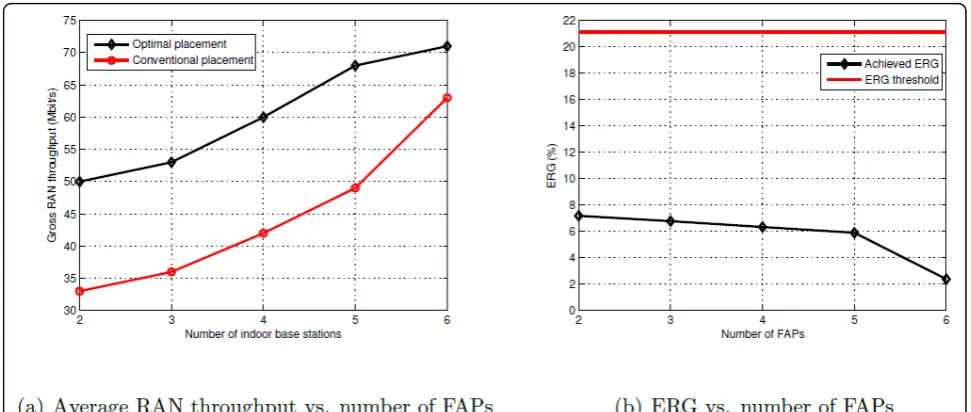
4.2.2 2-6 FAPs
The results in Figure 6 shows that for more than one co-frequency AP is deployed in the same room, the mutual interference between them dominate. The meaning of dots in different colours in the plots is the association of users to different FAPs. Their location is a trade-off between: being in the central area to reduce path-loss distance to the users, and being further away from each other to reduce mutual interference. The RAN through-put for both optimal and conventional scenario increases as more FAPs are deployed. It reaches saturation region when 6 FAPs are placed in optimal approach as shown in Figure 7a. Compared to the baseline elliptical deploy-ment, there is an average 6% ERG obtained from the optimal deployment shown in Figure 7b.
4.3 Multi-room multi-floor FAP placement
The article now considers a building with F floors R
rooms per floor. The framework of this comparison is how much energy is saved when the location of FAP is optimised compared to an even distribution of FAPs across the building. This investigation is done for FAPs in the presence of an outdoor micro-cell interference source. A series of RAN QoS offered loads on the sys-tem is considered and what the minimum number of FAPs is required to meet this targeted load is exam-ined. The parameters used in the investigation are as follows: number of floors (3), number of rooms per floor (9), room size (10 m × 20 m × 4 m), system bandwidth (20 MHz), carrier frequency (2130 MHz),
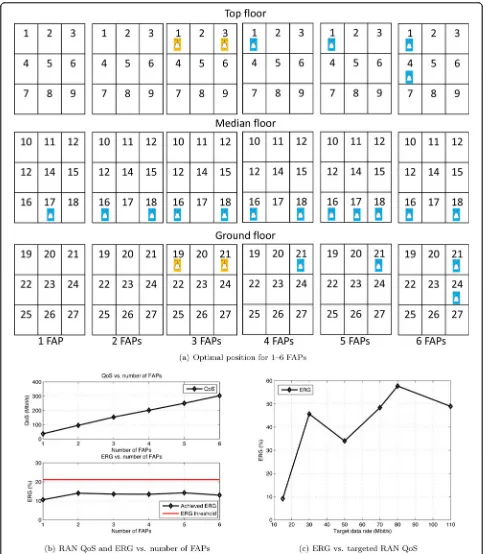
total number of users per building (300), sub-carriers per Physical Resource Block (12), FAP transmitting power (0.1 W), micro-cell transmitting power (20 W), FAP RH efficiency (6.67%), FAP OH power (5.2 W), micro-cell distance away from the room (200 m), and wall loss (10 dB). Figure 8 shows the optimal locations of FAPs for different number of FAPs required and the associated capacity and energy consumption improve-ments. The rooms on the top floor has been numbered as 1-9 followed by the rooms on the middle floor (10-18) and the ones on the ground floor (19-27). the micro-cell BS is located close to the side of room num-bered (7-9, 16-18 and 25-27). FAP positions in yellow represent that the system performance will be almost same by deploying FAP on either of these positions. FAP positions in blue are the recommended optimal ones in each scenario.
The results in Figure 8a shows that at least 1-2 FAP(s) are always required near the wall that faces the outdoor interference source, and this should be on the floor with a similar height to the height of the interfering micro-cell-site. The other FAPs should be deployed on other floors at the far corners in alternating pattern to mini-mise the interference. The positions of the FAPs in blue have to be fixed while one of the FAPs in yellow can be selected as the last FAP position. A design principle can be summarised as follows:
[image:10.595.58.538.86.301.2]outdoor interference source. The floor level should be one that is closest to the height of the micro-cell. (2) Any single additional FAP should be deployed also near the aforementioned wall on the same floor, but not in the same room as the first FAP.
(3) Any multiple additional FAPs should be deployed not on the same floor, and at the opposite side of the building in corner rooms. These FAPs should not be on the same floor as FAPs placed in Steps 1 and 2 and with each other in Step 3.
(4) Any additional FAPs that do not satisfy rule 3. is likely to cause energy inefficiency.
Generally speaking, this rule can cover the optimisation of FAP placement for up to 6 FAPs, which can provide a sufficiently high QoS. The RAN QoS increases as the number of FAPs increases. This optimal deployment offers an average 12% ERG compared to the baseline even distri-butional deployment. This is shown in Figure 8b. Figure 8c illustrates that how much energy can be reduced while deploying the optimal FAPs in this building when compar-ing to the baseline scenario for a certain RAN QoS. As the number of FAPs needed for different targeted RAN QoS is
not always same for optimal and baseline deployment, ERG threshold is waived is this comparison.
It can be noted that the solution of optimising the FAP location does not significantly degrade the outdoor network performance. By moving the FAP from centre to a point that is closer to the outdoor interference source, the interference from the FAP to the outside network is increased by up to 2.5 dB. Given that the outdoor interference is more dominated by outdoor interference from other micro-cells the total interference is not significantly increased. This is to say that the interference generated by the FAP to outdoor users is not significantly increased.
5 Discussions
The key conclusions are as follows:
●Deploying one FAP is always more spectral and energy efficient than one 802.11n Wi-Fi AP;
[image:11.595.60.542.87.422.2]should be deployed in the same room of a building; ● In the presence of a strong outdoor interference source (i.e., from a micro-cell), the location of some of the co-frequency FAPs, should be placed near the wall facing the interference source to counter-act the high level of indoor interference.
The energy reductions for several key comparisons are as follows:
● A single FAP versus A single 802.11n AP saves 4.44% OP ERG;
● Three 802.11n APs versus three FAPs saves 21.80% OP ERG in conventional scenario;
● Three FAPs versus three 802.11n APs saves 20.08% OP ERG in alternative scenario;
● Optimising placement of a single FAP in a single room saves 5% OP ERG;
● Optimising placement of multiple FAPs in a multi-room building saves average 12% OP ERG.
In general, improving the location of the FAPs, whilst keeping the number the same can improve the RAN throughput by 33%. Whilst, improving the location of the FAPs and reducing the number of FAPs can save 40% energy.
6 Conclusions
This body of investigation has proposed a novel strat-egy for indoor AP deployment for both LTE-Femtocells and 802.11n Wi-Fi multiple access technologies. This is done for a single room and multiple room scenarios. Our comparisons show that between 5 and 40% ERG
can be saved by optimising the AP number and loca-tion with respect to the propagaloca-tion parameters and interference scenario. Our baseline simulation results are reinforced with a novel theoretical framework, which can be used to develop and optimise indoor deployment while causing very little SINR degradation for micro-cell users.
7 Methods
The analysis in this paper is conducted by using both Monte-Carlo computation in a MAT-LAB software environment and theoretical expressions.
Appendix
Theoretical framework of 1 FAP optimisation
Introduction
In order to verify the simulation result of the optimal coordinate for a FAP to maximise the mean throughput in a particular indoor room, an extensive theoretical model to solve this optimal problem has been developed under certain assumptions. Those assumptions are as follows:
●The throughput experienced by indoor users are always in the high SINR regime, and that at least some region of the room experiences saturated throughput. This has been verified to be accurate after extensive simulation runs.
[image:12.595.55.541.88.294.2]●The variation of throughput is mainly along the axis of the FAP-Microcell, and not orthogonal to it. ● A modified Shannon expression is used for throughput, which accounts for the mutual infor-mation saturation of modulation and coding schemes.
In a rectangular room with Cartesian co-ordinates ofx
andy,gx,yis defined as the received SINR for a user at a particular position can be expressed in (10).
γx,y=
PFAP
(dx,y,FAP)1.87×10 46.8/10× ⎛ ⎜ ⎜ ⎝ f 5 ⎞ ⎟ ⎟ ⎠ 2
PmicroG¯micro
(dx,y,micro)3.67×10(22.7+PLwall+0.5dx,y,in)/10×
f
5
2.6+σ2
,
≈PFAPD
3.67×10(22.7+PLwa11)/10×
f 5
2.6
PmicroG¯micro×10 46.8/10× ⎛ ⎝f 5 ⎞ ⎠ 2
100.5dx,y,in/10
d1.87
x,y,FAP
=Kγ10 βdx,y,in
dαi,FAP
,
(10)
Where
PFAPD3.67×10(22.7+PLwall)/10×
f
5 2.6
PmicroG¯micro×1046.8/10×
f
5
2 is denoted asKg, a
= 1.87 andb = 0.05.PFAP and Pmicro are the transmit-ting power of FAP and micro-cell station, respectively.
¯
Gmicrois the expected value of the antenna gain from
the micro-cell BS.dx,y,FAPis theith FAP-to-grid distance
anddx,y,microis theith micro-cell-to-grid distance.dx,y,in
is the distance between the wall andith grid. AsD≫dx,
y,in, dx,y,microcan be accurately estimated as D.gx,ycan
then be re-written asKγ10dβαdx,y,in
i,FAP .
For a given FAP position of (x=a, y =b), the mean capacity of users attached to this FAP is therefore:
¯
Ca,b≈
1 A
A
log2(γx,y) dxdy=
1 A A log2 ⎡ ⎢ ⎢
⎣Kγ 10
β|y|
(x−a)2+ (y−b)2
α
⎤ ⎥ ⎥
⎦dxdy. (11)
It can be noted that gx,y(15-45 dB) is much greater than 1 which makes the above high SINR approximation reasonable. According to the MCS simulations, the throughput will saturate when gx,y > gs = 35.94 dB, where gs is the saturation SNR threshold. Hence,C¯a,b
should be modified to reflect this saturated region, which is shown as dbp1 and dbp2 in Figure 9. It is also
worth pointing out that gx,y hardly fluctuates along x axis outside the saturated region. Equation (11) can be re-written as Equation (12) under the condition that the
x coordinates of all grids are independent of gx,y by using Wyner [22] Model:
¯
Cb=CsYs+
1 Yns Yns log2
Kγ 10
βy
|y−b|α
dy, (12)
where Cs= log2
1 + 10 γS
10
bit/s/HZ. Ys and Yns are
the length of saturated and non-saturated regions, respectively. Equation (12) can be split into three sub-functions with respect to FAP positionb.
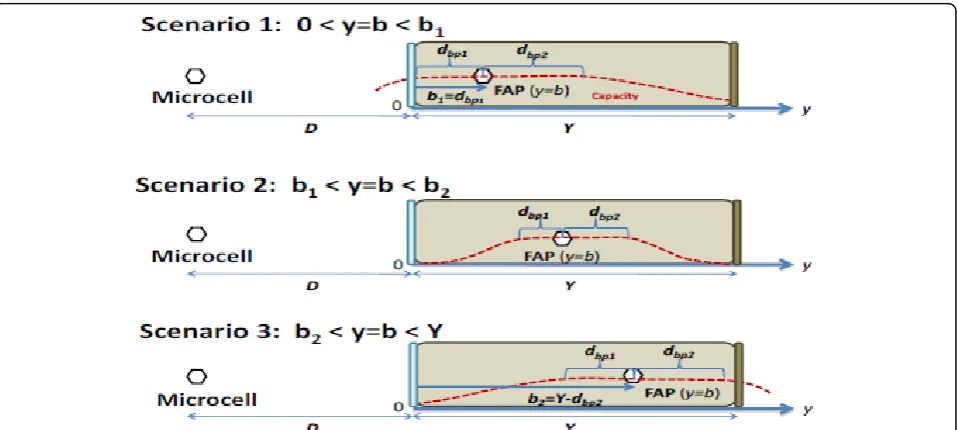
It is important to note that due to capacity saturation, the mean capacity of the indoor users has to be broken up into the following 3 scenarios:
(1) Scenario 1: the FAP is close to the window (0 <b ≤ b1) so that the only non-saturated capacity region is away towards the wall.
(2) Scenario 2: the FAP is in the middle region of the room (b1 <b ≤ b2) so that the non-saturated capacity regions exist both towards the window and the wall.
(3) Scenario 3: the FAP is close to the far wall (b2<b
≤ Y) so that the only non-saturated capacity region is towards the window.
We now consider these scenarios in turn and combine their theoretical formulation.
Formulation Scenario 1
In the first scenario, the farthest coordinate for FAP cannot exceedb1 where the SINR value at the wall close to the micro-cell side (i.e.dx,y,in = 0) should just achieve
the saturation SNR thresholdgs. Hence, b1 can be calcu-lated as:
Kγ10
βdy,in
bα1 = 10
γs
10, ⇒b1= α
Kγ
1010γs
(13)
The capacity can therefore be expressed by:
¯
Cb1=
1 Y
b+dbp2
0
Csdy+
1 Y
Y
b+dbp2
log2
Kγ 10
βy
(y−b)α
dy,
= (b+dbp2)Cs Y
!
=P1
+(Y−b−dbp2)log2Kγ Y
!
=Q1
+βlog210 Y
Y
b+dbp2
ydy− α
Y
=S1
!
Y
b+dbp2
log2(y−b)dy,
=P1+Q1+ β
log210
2Y [Y
2−(b+d
bp2)2]− α
YS1.
!
=R1
(14)
The term dbp2 can be solved by the following
equa-tion:
Kγ10
β(b+dbp2)
dαbp2 = 10
γS
10 , ⇒dbp2=Bexp[−W(−F)],(15)
where B= 10 b
20α ⎛ ⎜ ⎝ Kγ
10 γS 10 ⎞ ⎟ ⎠ 1 α
, F= ln 1020αB, W is Lambert
S1=
Y
b+dbp2
log2(y−b)dy=ylog2(y−b) "" "" "" " Y
b+dbp2
− Y
b+dbp2
y (y−b) ln 2dy,
=Ylog2(Y−b)−(b+dbp2)log2dbp2
!
=T1
− 1
ln 2
Y
b+dbp2
y−b+b
y−b dy=T1−
1
ln 2[y+bln(y−b)]
"" "" "" " Y
b+dbp2
,
=T1−
1
ln 2[Y−b−dbp2+bln(Y−b)−blndbp2] =T1−
Y−b−dbp2
ln 2 +blog2
Y−b
dbp2
!
U1
.
(16)
By substituting Equation (16) forS1 in Equation (14), ¯
Cb1can be finalised as: ¯
Cb1=P1+Q1+R1− α
Y(T1−U1). (17)
Formulation Scenario 2
When the position of FAP is on the coordinateb2, the user’s SINR at the other end of the room is equal togs.
b2 needs to be determined before assigning the proper limits for the mean capacity integral. With reference to Equation (13),b2 can be found to be:
b2=Y− α
Kγ10βY 1010γs
. (18)
After b2 is solved, the mean capacity in this scenario can therefore be expressed by:
¯
Cb 2=
1 Y
b−dbp1
0
log2
Kγ 10
βy
(b−y)α
dy+1 Y
b+dbp2
b−dbp1
Csdy+
1 Y
Y
b+dbp2
log2
Kγ 10
βy
(y−b)α
dy,
=P2+Q2+R1+R2−α
Y(T1+T2−U1−U2),
(19)
wheredbp1can be solved by the following equation:
Kγ10
β(b−dbp1)
dαbp1 = 10
γs
10, ⇒dbp1=Bexp[−W(F)], (20)
P2=
(dbp1+dbp2)Cs
Y , Q2=
(Y−dbp1−dbp2)log2Kγ
Y ,
T2= (b−dbp1)log2dbp1, T2= (b−dbp1)log2dbp1, and
U2= b−ln 2dbp1 +blog2
dbp1
b.
Formulation Scenario 3
In the last scenario, the mean capacity expression is very similar to that in scenario one and is given by:
¯
Cb3= 1 Y
b−dbp1
0
log2
Kγ 10
βy
(b−y)α
dy +1 Y Y
b−dbp1
Csdy=P3+Q3+R2− α
Y(T2−U2),
(21)
where P3= (Y−b+Ydbp1)Cs, and Q3=(b−dbp1Y)log2Kγ.
[image:15.595.60.539.88.303.2]mean capacity of the network with respect to the posi-tion of the FAPbas shown in Equation (9).
Acknowledgements
The work reported in this paper has formed part of the Green Radio Core 5 Research Programme of the Virtual Centre of Excellence in Mobile and Personal Communications, Mobile VCE. Fully detailed technical reports on this research are available to Industrial Members of the Mobile VCE. http:// www.mobilevce.com
Competing interests
The authors declare that they have no competing interests.
Received: 1 October 2011 Accepted: 11 June 2012 Published: 11 June 2012
References
1. V Chandrasekhar, J Andrews, A Gatherer, Femtocell networks: a survey.
Communications Magazine, IEEE.46(9), 59–67 (2008)
2. SF Hasan, NH Siddique, S Chakraborty, Femtocell versus WiFi-A survey and comparison of architecture and performance, inWireless Communication, Vehicular Technology, Information Theory and Aerospace & Electronic Systems Technology, 2009. Wireless VITAE 2009. 1st International Conference on, Aalborg, Denmark, IEEE, pp. 916–920 (2009)
3. S Al-Rubaye, A Al-Dulaimi, J Cosmas, Cognitive Femtocell.Vehicular Technology Magazine, IEEE.6, 44–51 (2011)
4. CH Ko, HY Wei, On-Demand Resource Sharing Mechanism Design in Two-Tier OFDMA Femtocell Networks.Vehicular Technology, IEEE Transactions on
, 99: 1 (2011)
5. S Park, W Seo, S Choi, D Hong, A Beamforming Codebook Restriction for Cross-Tier Interference Coordination in Two-tier Femtocell Networks. Vehicular Technology, IEEE Transactions on , 99: 1–1 (2011)
6. V Chandrasekhar, JG Andrews, T Muharemovic, Z Shen, A Gatherer, Power control in two-tier femtocell networks.Wireless Communications, IEEE Transactions on.8(8), 4316–4328 (2009)
7. HS Jo, C Mun, J Moon, JG Yook, Interference mitigation using uplink power control for two-tier femtocell networks.Wireless Communications, IEEE Transactions on.8(10), 4906–4910 (2009)
8. V Chandrasekhar, J Andrews, Uplink capacity and interference avoidance for two-tier femtocell networks.Wireless Communications, IEEE Transactions on.
8(7), 3498–3509 (2009)
9. D Fagen, PA Vicharelli, J Weitzen, Automated wireless coverage
optimization with controlled overlap.Vehicular Technology, IEEE Transactions on.57(4), 2395–2403 (2008)
10. I Ashraf, H Claussen, LTW Ho, Distributed radio coverage optimization in enterprise femtocell networks, inCommunications (ICC), 2010 IEEE International Conference on, Cape Town, South Africa, IEEE, pp.1–6 (2010) 11. JPM Torregoza, R Enkhbat, WJ Hwang, Joint power control, base station assignment, and channel assignment in cognitive femtocell networks.
EURASIP Journal on Wireless Communications and Networking.2010, 6 (2010) 12. S Ki Won, H Harald, ML Stephen, A semianalytical PDF of downlink SINR for
femtocell networks.EURASIP Journal on Wireless Communications and Networking.2010(2010)
13. M Yavuz, F Meshkati, S Nanda, A Pokhariyal, N Johnson, B Raghothaman, A Richardson, Interference management and performance analysis of UMTS/ HSPA+ femtocells.Communications Magazine, IEEE.47(9), 102–109 (2009) 14. J Lee, S Bae, Y Kwon, M Chung, Interference Analysis for Femtocell
Deployment in OFDMA Systems Based on Fractional Frequency Reuse.
Communications Letters, IEEE, 99: 1–3
15. G Bianchi, Performance Analysis of the IEEE 802.11 Distributed Coordination function. IEEE Journal on selected areas in communications.18(3), 535–547 (2000). doi:10.1109/49.840210
16. YC Tay, KC Chua, A capacity analysis for the IEEE 802.11 MAC protocol.
Wireless networks.7(2), 159–171 (2001). doi:10.1023/A:1016637622896 17. 3GPP, Physical layer aspects for Evolved Universal Terrestrial Radio Access
(UTRA). Tech. Rep. TR 25.814 V7.1.0, 3rd Generation Partnership Project (2006)
18. P Kyösti, J Meinilä, L Hentilä, X Zhao, T Jämsä, C Schneider, M Narandzic, M Milojevic, A Hong, J Ylitalo, Others, WINNER II channel models (d1. 1.2 v1. 1).no. IST-4-027756 WINNER II, D1
19. C Mehlführer, M Wrulich, JC Ikuno, D Bosanska, M Rupp, Simulating the Long Term Evolution physical layer, inProc of the 17th European Signal Processing Conference (EUSIPCO 2009), Glasgow, Scotland, pp. 1471–1478 (2009)
20. EARTH, Energy efficiency analysis of the reference systems, areas of improvements and target breakdown. Tech. Rep. Deliverable D2.3, Energy Aware Radio and neTwork tecHnologies (2010)
21. B Badic, T O’Farrrell, P Loskot, J He, Energy efficient radio access architectures for green radio: large versus small cell size deployment, in
Vehicular Technology Conference Fall (VTC 2009-Fall), 2009 IEEE 70th, IEEE, pp. 1–5 (2010)
22. AD Wyner, Shannon-theoretic approach to a Gaussian cellular multiple-access channel.Information Theory, IEEE Transactions on.40(6), 1713–1727 (1994). doi:10.1109/18.340450
doi:10.1186/1687-1499-2012-193
Cite this article as:Wanget al.:Low energy indoor network: deployment optimisation.EURASIP Journal on Wireless Communications and Networking20122012:193.
Submit your manuscript to a
journal and benefi t from:
7Convenient online submission
7Rigorous peer review
7Immediate publication on acceptance
7Open access: articles freely available online
7High visibility within the fi eld
7Retaining the copyright to your article