© 2019, IRJET | Impact Factor value: 7.211 | ISO 9001:2008 Certified Journal
| Page 1299
FOREST MANAGEMENT USING GIS
Anushya B
1, Indira R Somannavar
2, Navya S N
3, Nirmala D V
4, Rajendra M
51,2,3,4
Student, Dept. of computer science, Atria Institute of Technology, Karnataka, India
5Assistant Professor, Dept. of computer science, Atria Institute of Technology, Karnataka, India
---***---
Abstract -
Forest is a complex ecosystem that supports a myriad of life forms. Destruction of such indigeneous forests and woodlands leads to deforestation. We should study deforestation for many reasons such as land used for urbanization, mining, industrialization and trees being used to satisfy human’s greed. Geographic Information System (GIS) and Remote Sensing (RS) are being implemented for various applications of forest management. Satellite remote sensing allows a fundamental data for observation and for calculating deforestation effect. A model is developed which can be used for either database or real time accuracy assessment. Python language is used for coding in Matlab.The objective of this project is:
• The primary goal of this model is to check the amount of deforestation that has occurred over the past decades based
on the satellite images captured.
• This model is also designed to create a different map for locating the buildings, water bodies and forest area given a
satellite image as input.
• It also locates a particular place based on its latitude and longitude given.
Key Words: GIS, Deforestation, MatLab, Python, Image Processing, Dataset, Land Recognition.
1.
INTRODUCTION
Forest is a complex eco-system that supports a myriad of life forms. The major part of the Earth is composed by forests and are distributed all over the globe. Forest’s account for 80% of the Earth’s plant biomass and 75% of the gross primary production of the Earth’s biosphere. Destruction of such indigenous forests and woodlands leads to deforestation. There are many reasons why we should study deforestation as the land is used in urbanization, mining, industrialization and trees are used to satisfy human’s greed . Geographic Information Systems (GIS) and Remoste Sensing(RS) are being implemented for various applications of forest management. As most of the rainforest are depleating in enormous rate due to increasing rate of agriculture, urbanization and various human activities encroachment in forest areas, GIS data are very useful for forest management .
Satellite images provide various statistical analysis of forest cover and the information about deforestation using GIS maps. Satellite remote sensing allows a fundamental data for observation and for calculating deforestation effect The Geographical Information Systems (GIS) is an information technology that has been used in public policy making for environmental and forest planning and decision making in forest management using ICT technologies [1, 3]. The use of Geographical Information Systems (GIS) has increased significantly in engineering, natural and ecological sciences applications, offering accurate, efficient, reproducible methods for collecting, view in g and analyzing spatial data. The GIS helps in dealing with data and information complexity. The evolution of GIS, the Global Positioning System (GPS), and Remote Sensing (RS) technologies and Data Sciences, Information Systems, and MIS has enabled the collection and analysis of field data and provide deep insight and helps in forest management.
© 2019, IRJET | Impact Factor value: 7.211 | ISO 9001:2008 Certified Journal
| Page 1300
[image:2.596.157.444.103.262.2]2.
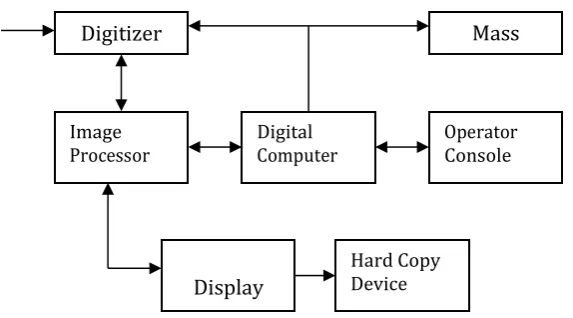
PROPOSED MODEL
FIG 1. BLOCK DIAGRAM FOR IMAGE PROCESSING SYSTEM
The proposed approach consists of seven parts: Digitizer, Image Processor, Display, Hard copy device, Digital computer, Operator Console, Mass.
2.1DIGITIZER
A digitizer converts an image into a numerical representation suitable for input into a digital computer. Some common digitizers are
1. Microdensitometer
2. Flying spot scanner
3. Image dissector
4. Videocon camera
5. Photosensitive solid- state arrays.
2.2IMAGE PROCESSOR
An image processor does the functions of image acquisition, storage, preprocessing, segmentation, representation, recognition and interpretation and finally displays or records the resulting image. The following block diagram gives the fundamental sequence involved in an image processing system.
As detailed in the diagram, the first step in the process is image acquisition by an imaging sensor in conjunction with a digitizer to digitize the image. The next step is the preprocessing step where the image is improved being fed as an input to the other processes. Preprocessing typically deals with enhancing, removing noise, isolating regions, etc. Segmentation partitions an image into its constituent parts or objects. The output of segmentation is usually raw pixel data, which consists of either the boundary of the region or the pixels in the region themselves. Representation is the process of transforming the raw pixel data into a form useful for subsequent processing by the computer. Description deals with extracting features that are basic in differentiating one class of objects from another. Recognition assigns a label to an object based on the information provided by its descriptors. Interpretation involves assigning meaning to an ensemble of recognized objects. The knowledge about a problem domain is incorporated into the knowledge base. The knowledge base guides the operation of each processing module and also controls the interaction between the modules. Not all modules need be necessarily present for a specific function. The composition of the image processing system depends on its application. The frame rate of the image processor is normally around 25 frames per second.
2.3 DIGITAL COMPUTER
Mathematical processing of the digitized image such as convolution, averaging, addition, subtraction, etc. are done by the computer.
Digitizer
Mass
Image Digital
Console
Display
© 2019, IRJET | Impact Factor value: 7.211 | ISO 9001:2008 Certified Journal
| Page 1301
2.4MASS STORAGEThe secondary storage devices normally used are floppy disks, CD ROMs etc.
2.5 HARD COPY DEVICE
The hard copy device is used to produce a permanent copy of the image and for the storage of the software involved
2.6 OPERATOR CONSOLE
The operator console consists of equipment and arrangements for verification of intermediate results and for alterations in the software as and when require.
3.Effects of Deforestation
© 2019, IRJET | Impact Factor value: 7.211 | ISO 9001:2008 Certified Journal
| Page 1302
Effects of Deforestation and Compared the past year deforestation satellite imagesAdvantages
FCM gives best outcome for covered informational collection.
It is relatively superior to anything k-implies calculation. Data point is doled out participation to each bunch focus
because of which information point may have a place with more than one group focus while on account of k-implies calculation information point should only have a place with one bunch focus.
Disadvantages
FCM requires a priori specification of the number of clusters. Euclidean separate measures can unequally weight
basic components. Presently I improve result with bring down estimation of β however to the detriment of more number of emphases.
4.Result and Discussion
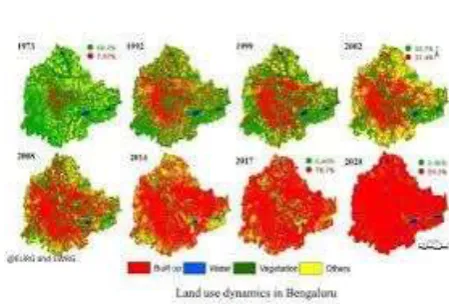
[image:4.596.172.397.76.229.2]In the below figure, the spatiotemporal prediction of the future landslides outside the area of training can be Identified and Projected. Stepwise factor determination with logistic regression, achieved the most reduced assessments of contingent mistake frequency for both the spatial prediction of present landslides and the spatiotemporal prediction without bounds of landslides outside the area of training. This is appropriate for all training data sets conceived. For the biggest training data sets, it produces best comes with the usual optimum being a mistake rate of 0.24 for present and 0.32 for future landslides. For applying overall accuracy and kappa coefficient, the best classifier was chosen to create land use map of year 2000. The area of each land use type was computed for the land use maps of 2000 and 2013. The areas of each land use type were equated for land use maps of 2000 and 2013. The alters in land use from 2000 to 2013 are summarized in below Table.
Table 6.1 Change of land use types from 2000 to 2013
Land use maps were extracted applying Support vector machine (SVM). The overall accuracy was found 93.74% for land use maps prepared applying SVM respectively. Also kappa coefficient was 0.92 for land use map of SVM. The results denoted that SVM is more accurate, so SVM was chosen to prepare land use map of year 2000.
7. Conclusion
© 2019, IRJET | Impact Factor value: 7.211 | ISO 9001:2008 Certified Journal
| Page 1303
techniques in spatiotemporal analysis of land use changes and detecting deforestation, forest degradation, and monitoring forest dynamics in Amazon rainforests. Here I implemented a satellite image for deforestation detection using artificial neural network (ANN) and support vector machine (SVM). The major contribution is studied the satellite image applying remote sensing, deforestation and analysis in future will implement the quality of satellite image applying hybrid algorithm. In future the researcher will have good chance to perform different classification techniques, and through which scope can be enhanced. Consequently, this would conduct to better and more accurate results.REFERENCES
[1] J. Suresh Babu, Prof. T.sudha, “Hybrid Algorithm For Deforestation Detection Using Satellite Data”, International Journal of Management, IT & Engineering Vol. 6 Issue 10, ISSN: 2249-0558 Impact Factor: 6.269, pp. 27-33, October 2016.
[2] J. Suresh Babu, Prof. T. sudha, “Hybrid Algorithm for Deforestation Detection Using Satellite Data by Using Support
Vector Machine (SVM) Algorithm”, International Journal of Emerging Research in Management &Technology ISSN: 2278-9359 (Volume-6, Issue-6) pp.92- 97, June-2017.
[3] Beckman, Jayson, et al. "International Trade and Deforestation: Potential Policy Effects via a Global Economic Model" (2017).
[4] Westin, Johan. "Remote sensing of deforestation along the trans-Amazonian highway". student thesis series INES (2014).
[5] Winckler, Johannes, Christian H. Reick, and Julia Pongratz. "Robust identification of local biogeophysical effects of land- cover change in a global climate model". Journal of Climate 30.3 (2017): 1159-1176.
[6] Krishna, Vijesh V., et al. "Land markets, Property rights, and Deforestation: Insights from Indonesia". World Development (2017).
[7] Schultz, Natalie M., Peter J. Lawrence, and Xuhui Lee. "Global satellite data highlights the diurnal asymmetry of the surface temperature response to deforestation", Journal of Geophysical Research: Biogeosciences 122.4 (2017): 903-917.
[8] Jiao, Tong, et al. "Global climate forcing from albedo change caused by large-scale deforestation and reforestation: quantification and attribution of geographic variation", Climatic Change 142.3-4 (2017): 463-476.
[9] Carillo, B., et al. The Externalities of a Deforestation Control Policy in Infant Health: Evidence from Brazil. No.17/09. HEDG, c/o Department of Economics, University of York, 2017.
[10] Zhu, Zhe. "Change detection using landsat time series:A review of frequencies, preprocessing, algorithms, and applications". ISPRS Journal of Photogrammetry and Remote Sensing 130 (2017): 370-384.
[11] Petrica, Lucian, and Gheorghe Stefan. "Energy-Efficient WSN Architecture for Illegal Deforestation Detection". Int J Sensors Sensor Netw 3.3 (2015): 24-30.
[12] Fushita, Angela Terumi, et al. "Detection in Land Cover Change Trajectories Using Remote Sensing A Case Study of Southeast Brazil Region". International Journal of Applied 6.1 (2016).
[13] Iqbal, Muhammad Shahid. " Spatiotemporal Monitoring for Deforestation and Forest Degradation Activities in Selected Areas of Khyber Pakhtunkhwa (KPK)", (2016).
[14] Shimabukuro, YosioEdemir, et al. "Detection of forest degradation caused by fires in Amazonia from time-series of
MODIS fraction images". Curitiba: Anais XVII SimpósioBrasileiro de SensoriamentroRemoto (SBSR), INPE (2015).