ISSN Online: 2160-0422 ISSN Print: 2160-0414
DOI: 10.4236/acs.2018.82014 Apr. 26, 2018 212 Atmospheric and Climate Sciences
The Thermal Radiation of the Atmosphere and
Its Role in the So-Called Greenhouse Effect
Thomas Allmendinger
Independent Scholar, Zunstrasse 1, CH-8152 Glattbrugg, Switzerland
Abstract
Knowledge about thermal radiation of the atmosphere is rich in hypotheses and theories but poor in empiric evidence. Thereby, the Stefan-Boltzmann re-lation is of central importance in atmosphere physics, and holds the status of a natural law. However, its empirical foundation is little, tracing back to expe-riments made by Dulong and Petit two hundred years ago. Originated by Ste-fan at the end of the 19th century, and theoretically founded afterwards by Boltzmann, it delivers the absolute temperature of a blackbody—or rather of a
solid opaque body (SOB)—as a result of the incident solar radiation intensity, the emitted thermal radiation of this body, and the counter-radiation of the atmosphere. Thereby, a similar character of the blackbody radiation—describable by the expression σ·T4—and the atmospheric counter-radiation was assumed. But this appears quite abstruse and must be questioned, not least since no pressure-dependency is provided. Thanks to the author’s recently published work—proposing novel measuring methods—, the possibility was opened-up not only to find an alternative approach for the counter-radiation of the at-mosphere, but also to verify it by measurements. This approach was ensued from the observation that the IR-radiative emission of gases is proportional to the pressure and to the square root of the absolute temperature, which could be bolstered by applying the kinetic gas theory. The here presented verifica-tion of the modified counter-radiaverifica-tion term A·p·T0.5 in the Stefan-Boltzmann relation was feasible using a direct caloric method for determining the solar absorption coefficients of coloured aluminium-plates and the respective li-miting temperatures under direct solar irradiation. For studying the pressure dependency, the experiments were carried out at locations with different alti-tudes. For the so-called atmospheric emission constant A an approximate value of 22 Wm−2 bar−1 K−0.5 was found. In the non-steady-state, the total thermal emission power of the soil is given by the difference between its blackbody radiation and the counter-radiation of the atmosphere. This rela-tion explains to a considerable part the fact that on mountains the
atmos-How to cite this paper: Allmendinger, T. (2018) The Thermal Radiation of the At-mosphere and Its Role in the So-Called Greenhouse Effect. Atmospheric and Cli-mate Sciences, 8, 212-234.
https://doi.org/10.4236/acs.2018.82014
Received: March 5, 2018 Accepted: April 23, 2018 Published: April 26, 2018
Copyright © 2018 by author and Scientific Research Publishing Inc. This work is licensed under the Creative Commons Attribution International License (CC BY 4.0).
DOI: 10.4236/acs.2018.82014 213 Atmospheric and Climate Sciences
pheric temperature is lower than on lowlands, in spite of the enhanced sun-light intensity. Thereto, the so-called greenhouse gases such as carbon-dioxide do not have any influence.
Keywords
IR (Infrared) Radiation of Gases, Thermal Radiation of the Atmosphere, Albedo, Solar Adsorption Coefficient, Radiation Equilibrium, Limiting Temperature
1. Introduction
Thermal and IR-radiative measurements at gases encounter several principal difficulties: Firstly, gases need to be embedded in a vessel from a solid material which may considerably influence and overlay the thermal behaviour due to its higher heat capacity. Secondly, thermal-radiative energy transfer—i.e. electro-magnetic interaction—may be influenced by simple heat conduction as well as by gas convection. And thirdly, the coexistence of radiative energy and of heat energy complicates the situation since one component may be partly converted into the other, and vice versa. Thereby it has to be realized that heat energy is due to atomic or molecular translational motion, rotation and nuclear vibration, while radiative energy is due to electronic oscillations at atoms or molecules. The first aspect concerns thermodynamics, implying non-quantized processes, while the second aspect affects quantum mechanics and thus energetically quantized processes. Planck’s distribution law bridged the two domains applying the cohe-rence between temperature and entropy [1] [2] [3]. However, it is confined to boundary conditions, for instance to equilibrium states between emission and absorption intensities. But in particular, it concerns so-called blackbodies, and not implicitly gases. Overall, this domain appears to be the most intricate one in physics—apart from nuclear physics—, calling for considerable expertise, while, on the other hand, it is in everyone’s interest in so far as it affects the climate and thus the day-to-day life.
It must be noted that contemporary atmospheric physics is rich in theories and hypotheses but poor in experimental evidence which in fact should deliver the final proof of the truth—and not the credence in authorities, as Robert Boyle
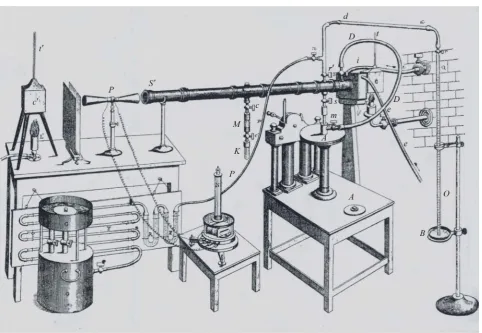
DOI: 10.4236/acs.2018.82014 214 Atmospheric and Climate Sciences Figure 1. The preferred apparatus of Tyndall.
[image:3.595.85.512.424.701.2]DOI: 10.4236/acs.2018.82014 215 Atmospheric and Climate Sciences
Lummer and Pringsheim published their empiric results concerning blackbody radiation in 1899 [8] which allowed verifying Planck’s quantum theory, estab-lished in 1900.
As to these basic experiments, the predominance of photometric and spec-troscopic methods is remarkable while caloric methods were still neglected. In fact, the spectroscopic methods are even the only methods which were used in recent research, particularly in connection with satellite measurements. Thereby, the intensity loss of IR-radiation is detected after passing through a medium—in our case a gas, in particular atmospheric air—, while the possible temperature change of the medium is disregarded. But this method exhibits two principal weaknesses which will later be discussed on the basis of the author’s recently published work: It is not sure whether—or to which extent—the absorbed radia-tion is converted into heat. Moreover, very weak radiative absorbance by the gas may be disregarded due to the insufficient sensibility of the apparatus, in spite of the fact that for spectroscopic measurements prisms and lenses are needed which partly absorb IR.
Besides the application in bolometers, the sole method implicating caloric measurements is the one which concerns the Stefan-Boltzmann relation. As al-ready mentioned, Stefan’s approach [6] was based on earlier experiments of Du-long and Petit [7], using the equipment shown in Figure 2, while Boltzmann de-livered the theoretical explanation five years later [9]. Subsequently, the respec-tive constant could be exactly computed using Planck’s theory. The said relation is of central importance in atmosphere physics holding the status of a physical law, even if some doubts are justified. Nevertheless it represents the pivot of the present treatise.
The Stefan-Boltzmann relation comprises three decisive conceptions:
Firstly, it makes use of the radiation law which is valid for blackbodies under vacuum, given by (1):
4
I = ⋅σ T (1)
where I = radiation intensity [Wm−2], T = absolute temperature [K]
The Stefan-Boltzmann constant σ can empirically be determined, but—as above mentioned—also theoretically be computed, yielding (2), cf. [10] p. 583:
5 4 2 3 8 2 4
2π k 15c h 5.75 10 W m K
σ
= = × − ⋅ − ⋅ − (2)where k = Boltzmann constant, c = light velocity, h = Planck constant
Secondly, it is supposed that in the presence of the atmosphere—or of another blackbody—, which is held at a constant temperature Tatm, atmospheric counter radiation takes place, which leads to a reduction of the total radiation of the blackbody, yielding the reduced value I* according to (3). Thereby, the same radiation law is assumed for this counter-radiation as for a blackbody:
(
4 4)
blackbody atm
I∗ =
σ
T −T(3)
DOI: 10.4236/acs.2018.82014 216 Atmospheric and Climate Sciences
steady state where a constant limiting temperature of the black body is reached:
(
4 4)
blackbody,lim atm
T T
σ
Φ = − (4a)
or rearranged
4 4
blackbody,lim atm
T T
σ⋅ = Φ + ⋅σ (4b)
Hence, the Stefan-Boltzmann relation was applied to the whole atmos-phere—or rather to its lowest layer—, which obviously does not exhibit any sur-rounding walls, as it was the case for the measurements of Dulong and Petit. In-stead, it is held together by the gravity of the Earth. However, this implies a con-siderably inhomogeneity—even when cloud and dust effects are neglected—, not only because of the vertical pressure and temperature gradients, but also because of horizontal gradients caused by the ball shape of the Earth, which leads to lati-tude-dependant solar irradiation intensities. In addition, differences in altitude, due to mountains, as well as diurnal and seasonal fluctuations contribute to permanent but not consistent motions which hardly admit steady-state condi-tions.
When, instead of a blackbody, a coloured solid opaque body (abbrev. SOB) is used, these equations can be modified to the Equations ((5a) and (5b)) since the thermal emission power of a coloured solid opaque body turned out to be equal to the thermal emission power of a blackbody [11]:
(
4 4)
SOB,lim atm
s T T
β
σ
Φ ⋅ = − (5a)
or rearranged
4 4
SOB,lim s atm
T T
σ⋅ = Φ ⋅β σ+ ⋅ (5b)
yielding formula (6) for calculating the limiting temperature of an irradiated co-loured SOB:
4 4
SOB,lim atm
s
T β T
σ Φ ⋅
= +
(6)
Therein, βs indicates the solar reflection coefficient, expressing the portion of absorbed irradiation. But normally, instead of this solar absorption coefficient, the complementary solar reflection coefficient αs(or the “albedo”) is used which entails its indirect determination according to the relation βs = 1 − αs. Since this may lead to uncertainties due to scattering of the reflected radiation, a method for the direct determinationof the solar reflection coefficient βs was developed by the author, measuring the warming-up of coloured solid opaque plates [11]. Thus, it spares you the trouble of determining the albedo and will briefly be de-scribed in the next chapter, in particular since it is suitable to empirically assess the Stefan-Boltzmann relation.
DOI: 10.4236/acs.2018.82014 217 Atmospheric and Climate Sciences
and processes. Moreover, in reality the limiting temperature of superficial mate-rials is hardly ever reached, not least because of the diurnally alternating altitude of the sun and, in particular, because of the cooling-down of the Earth surface during night. In the latter case, the intensity of the incident solar intensity be-comes zero. Instead, a radiative emission of the solid opaque body—representing the soil—is to be anticipated, thus Equation (5b) turns into Equation (7):
4 4
emission,soil σ Tsoil σ Tatm
Φ = ⋅ − ⋅
(7)
However, the cooling-down experiments described in [11] did not verify this equation. As an explanation, the different characters of the two participants have to be taken into account: in the case of solid materials, primarily the properties of the surface are relevant, while in the case of gases the relevant processes occur
inside, i.e. within their whole extension range. This means, that the former processes occur two-dimensionally, while the latter ones are three-dimensional. It seems to be obvious that the atmosphere acts altogether incidentally like a solid thermal radiator, suggesting that it behaves like a solid opaque body. However, it can be assumed that, if the atmosphere were less extensive, its back-radiation power would probably be weaker, due to the reduced atmospher-ic pressure. As a consequence, an alternative approach such as
(
)
4
SOB,lim atm, atm
s T f p T
β σ
Φ ⋅ = ⋅ − (8)
should be taken into consideration, exhibiting the presently unknown term
(
atm, atm)
f p T , being a function of atmospheric pressure and temperature,
ap-pears reasonable but difficult to derive and verify. It is one of the main goals of this treatise to find a formal expression for this term. The recently reported and below described discovery of near-infrared absorption by gases delivered the key for finding such an expression. Since this novel method and its results cannot be assumed to be generally known, it will be recapitulated in chap. 3. But first of all, the method for the direct determination of the solar absorption coefficient will be described, allowing the empirical verification of the proposed atmospheric term by variation of the atmospheric pressure due to different sea levels.
2. A Novel Method Suited for the Validation
of the Stefan-Boltzmann Relation
DOI: 10.4236/acs.2018.82014 218 Atmospheric and Climate Sciences
material, and on the other hand due to its high thermal conductivity facilitating the heat dispersion in the plate and thus minimising the temperature difference between surface and bulk. For comparison, additionally other materials were used (wood, brick, and stone).
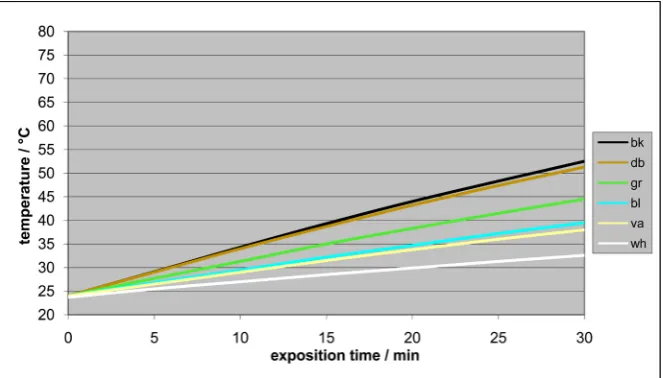
[image:7.595.222.516.267.445.2]For the warming-up experiments several coloured plates were orientated ex-actly vertically to the incoming sunlight. In order to enable a correct orientation, the plate modules were positioned on an adjustable carrier (Figure 4). The tem-peratures were measured at regular intervals of 5 minutes using Hg-thermometers being centrally inserted in holes. The heating-rates could easily be determined by graphically assessing the initial slopes of the time/temperature curves. The sky had to be cloudless during the experiment. For detecting the intensity of the solar insolation, a suitable electronic apparatus was used. The time/temperature-plots
Figure 3. Coloured plate embedded into Styrofoam and covered by a transparent foil.
[image:7.595.288.459.477.706.2]DOI: 10.4236/acs.2018.82014 219 Atmospheric and Climate Sciences
for differently coloured plates are shown in Figure 5. Considering the heat ca-pacities of the plates, the specific solar reflection coefficients βs could be calcu-lated.
As expected, such plates being exposed to direct sunlight will not be
warmed up ad infinitum but only up to a limiting temperature. Thus the
time/temperature-curves will flatten sooner or later, losing their initially linear character. This phenomenon is already briefly perceptible when, instead of alu-minium, plates from wood are inserted which exhibit a lower heat capacity im-plying a quicker warming-up. Obviously, this can be explained with the emission of thermal radiation effecting cooling-down, since it is temperature dependent, and growing till its intensity is equal to the intensity of the absorbed incident so-lar radiation.
With the plates used it was not possible to reach the limiting temperature ranges since the measuring period was too short. However, it was possible to study the cooling-down effect separately in a darkened room, using the same embedding as the one which had been used for the warming-up measurements, but starting from an elevated temperature being achieved by preheating the plates in an oven (Figure 6). As expected, the cooling-down rates depended on the material, in particular on its heat capacity. But unexpectedly, they did not
depend on the surface colour. This was surprising since it seemed to contradict the well-known theorem of Kirchhoff which states that the absorbency of a sur-face is equal to its emissivity. However, Kirchhoff’s statement was made at a time when, for instance, the quantization of electromagnetic radiation was not yet known [12] [13]. Therefore, the body must not necessarily be black, it is suffi-cient that it is opaque. Hence, Planck’s distribution law is not exclusively valid for blackbodies, but also for anysolid opaque body.
[image:8.595.209.541.502.691.2]As the analysis yielded, the cooling-rates were proportional to the temperature difference between plate and ambient air, leading to exponential curve-courses
Figure 5. Warming-up of aluminium at 1040 Wm−2 (wh = white, va = vanilla, bl = blue,
DOI: 10.4236/acs.2018.82014 220 Atmospheric and Climate Sciences Figure 6. Cooling-down of different materials, with covering foil (al = aluminum, st = stone, br = brick, wo = wood; in brackets: ambient temperature).
which were exactly describable with a mathematic formula. It exhibits the so-called heat transfer coefficient B which can be determined from experimental data. It depends on the experimental conditions, in particular on the surround-ing atmosphere, but not on the specific properties of the plates. Using the re-spective apparatus, a general heat transfer coefficient of approx. 9 Wm−2 K−1 was obtained. In the case of the absence of a foil, the heat transfer coefficient in-creased up to 15 Wm−2 K−1. However, as it seems obvious, the heat conductivity of the material is decisive, too, but scarcely implementable.
Combining the differential equations for the warming-up rate and the cooling-down rate, a differential equation for the overall-process was obtained. Its solution yielded Equation (9):
atm 1 e m
B a t m c s
T T
B
β − ⋅⋅
Φ ⋅
= + −
(9)
whereby a = area of the plate, m = mass of the plate, and cm = its mass specific heat capacity.
When T = ∞, T has reached a limes which is computable by Equation (9):
lim atm
s
T T
B
β Φ ⋅
= +
(10)
Hence, according to formula (10), the limiting temperature is independentof the heat capacity, but solely dependent on the irradiation density Ф, the solar absorption coefficient βs, and the heat transfer coefficient B, while the ratio of the limiting temperatures (in ˚C) is equal to the ratio of the βs-values.
DOI: 10.4236/acs.2018.82014 221 Atmospheric and Climate Sciences
modelling method cannot deliver exact results since the heating-up and the cooling-down process were not carried out under the same conditions, the re-sults of this modelling appear nevertheless plausible and in principle accurate.
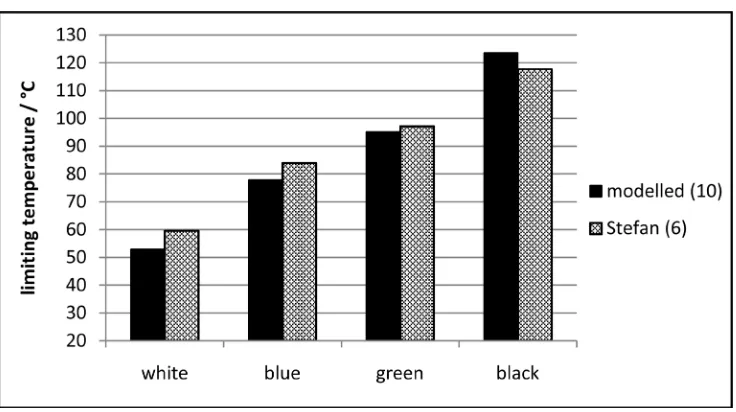
In principle, this method is suitable for verifying the Stefan-Boltzmann rela-tion by comparing the limiting temperatures for different colours using formulas (6) and (10). For that purpose, in Figure 8 the results of the two computation methods are compared for the four colours white, blue, green and black, based on the edge data of the original own measurements quoted in [11]. They are consistent to such an extent that the validity of the Stefan-Boltzmann relation seems to be proved.
[image:10.595.209.541.261.465.2]However, it should be regarded that the measurements of Dulong and Petit, evaluated by Stefan, were made in closed vessels—and not in contact with the
Figure 7. Temperature courses at differently coloured aluminium-plates (20 mm thick).
[image:10.595.172.540.491.697.2]DOI: 10.4236/acs.2018.82014 222 Atmospheric and Climate Sciences
open atmosphere. Similarly, the author’s own cooling-down experiments, whose results allowed the computational simulation of the limiting temperatures, were made in a closed room. Thus in both cases the counter-radiation might be in-duced by the surrounding walls, i.e. by solid opaque bodies, and not—or not only—by open air. As a consequence, a stringent empirical proof is solely possi-ble if the coloured plates are irradiated by sunlight as long as their temperatures have reached the limiting values, and this is preferably achieved by using thinner plates with smaller heat capacities. Hence, the first and preliminary purpose of the present treatise consists in delivering experimental data for assessing the modelled values given in [11] by using 8 mm thick aluminium plates instead of the ones that are 20 mm thick.
In view of the above alleged objections which, in spite of the apparent evi-dence, suggest a principal questioning of the Stefan-Boltzmann relation, a second purpose arises consisting in establishing and verifying a hypothesis which im-mediately suggests itself through a result of a further method which was pub-lished recently by the author [14]. It concerns the measurement of IR-absorption and IR-emission by gases and will be shortly described below. Its results promise an application to the atmospheric counter-radiation, which will lead to a mod-ification of the Stefan-Boltzmann relation concerning its air radiation term.
3. The Basic Work about the IR-Adsorption and IR-Emission
by Gases and Its Hypothetical Application to the
Atmospheric Radiation
The starting point of the here referenced author’s research [15] was the common greenhouse theory. According to this, the atmosphere is solely warmed-up due to absorption of thermal Earth radiation by so-called greenhouse gases, in par-ticular by carbon-dioxide, while pure air is assumed to be incapable of absorbing any IR(infrared)-radiation, be it the near-IR of the incident solar-radiation (wa-velength λ < 3 µm), or the medium-IR of the thermal Earth radiation (λ > 3 µm). At least the former assumption must be questioned in view of the fact that the in-tensity of the incident solar light is considerably reduced by the atmosphere: As it is well-known, there is a significant difference between the extra-terrestrial solar constant (measured on the top of the atmosphere) and the terrestrial solar con-stant (measured on the Earth surface). For the extra-terrestrial one, commonly the average value 1360 - 1366 Wm−2 is assumed (see for instance [16] [17]), while for the terrestrial one approximately 1000 Wm−2 are measured, but de-pendant on the altitude (see later). The primary, basic investigations were made with solar light and—particularly—with artificial IR-light exhibiting mainly near-IR [14], while additional measurements concerning thermal radiation, i.e.
medium-IR, were carried out with a hotplate [18].
DOI: 10.4236/acs.2018.82014 223 Atmospheric and Climate Sciences
may move when a temperature gradient arises. Hence, a large ratio between the gas volume and the surface of the vessel must be intended, as well as a low heat capacity of the vessel material. Therefore, it is not surprising that no effect can be detected when heavy materials and apparatus are used, as it was the case with
the photometric measurements made by Tyndall [5] using apparatus shown in
Figure 1, or by his followers Arrhenius [19] and Knut Ångström [20], in spite of the fact that no caloric measurements were made but solely photometric ones.
Therefore, the author’s experiments were made using very light building ma-terials, namely square tubes from Styrofoam (3 cm thick, 1 m long, outer diame-ter 25 cm), covered above and below with a thin transparent foil (0.01 mm thick Saran-wrap). At an advanced stage, the Styrofoam was sealed with adhesive foils and mirrored with aluminium foils. For the measurements with solar light, one or two tubes were pivoted on a frame so that they could be exactly oriented in the direction of the light (Figure 9). For the measurements with artificial light, an IR-spot with a reflector was mounted above the vertically aligned tube (Figure 10), while for the thermal radiation measurements a hotplate was posi-tioned on the bottom of the tube (Figure 11).
[image:12.595.287.461.472.706.2]When artificial infrared light or thermal radiation was applied, normally a temperature gradient along the measuring tube appeared, in contrast to the use of solar light which did not exhibit such an intensity decrease (Figure 12). This effect was detected by providing three temperature-measuring points in the dis-tance of 40 cm. In spite of this disadvantage, most measurements were made with artificial light since it enabled higher intensities and better reproducibility. The deviations could be minimized by mounting internal mirroring with alumi-nium foils along the tube walls. This effect had always been disregarded at for-mer IR-measurements with gases, apart from the fact that not the temperature
DOI: 10.4236/acs.2018.82014 224 Atmospheric and Climate Sciences Figure 10. Equipment with IR-lamp according to [14].
Figure 11. Equipment with hotplate according to [18].
[image:13.595.208.540.488.694.2]DOI: 10.4236/acs.2018.82014 225 Atmospheric and Climate Sciences Figure 13. Time-temperature curves of different noble gases (150 W IR-spot, middle thermometer position).
enhancement of the gas was measured but solely the intensity loss of the applied light ray.
The time-temperature curves of irradiated gases proceed alike to those of irra-diated SOBs, always reaching limiting temperatures. Analogously, it may be as-sumed that a limiting temperature is attained when a steady equilibrium exists between the intensity of the absorbed radiation, on the one side, and of the emitted radiation, on the other side. Thus the knowledge of the limiting temper-ature values enables making statements about the radiation emissivity of the re-spective gases. Surprisingly, any gas was up-warmed, even noble gases did so (Figure 13), while—contrary to the prediction of the conventional greenhouse theory—no significant difference could be found between pure carbon-dioxide, air and argon. In the case of thermal radiation emitted by a hotplate, comparing air with carbon-dioxide, a similar behaviour was found (Figure 14). However, that test assembly did not permit exact evaluations due to the thermal delay of the hotplate after being switched on.
The interpretation of the results obtained with the IR-spot apparatus enabled the empirical determination of the heat absorbance coefficient of a gas, which turned out to be very low. So it is not surprising, that this effect has been over-looked so far. While a theoretical calculation of such an absorption coefficient was not feasible, at least a principal explanation may be given:
There is no good reason to assume that absorbed IR-radiation will be entirely
transformed into heat. Instead, it is conceivable that a part of it is re-emitted,
i.e. to say in all directions, before having induced a temperature enhancement. The absorption of infrared light by an atom or a molecule can be explained
DOI: 10.4236/acs.2018.82014 226 Atmospheric and Climate Sciences Figure 14. Limiting temperatures for different gases at different positions, average values of two measurements, according to [18] (heat power 37.1 W, initial temperature 23.5˚, pressure ca. 1032 hPa, humidity 45% - 55%).
occurrence of standing electron waves in the excited states. Obviously such phenomena are possible not only at molecules with polar bonds, as is the case at the absorption of medium-IR by CO2 and H2O—and as it is assumed as the only possible explanation for IR-absorption in the conventional theory—, but also with molecules exhibiting nonpolar bonds, and even at noble gases. So this is an
intra-molecular phenomenon. On the other hand, heat is due to the kinetic energy content of the gas which correlates to the translational movement of whole molecules or atoms. So that is an inter-molecular phenomenon. That movement is not quantized and thus it cannot be described quantum-mechanically, but solely by means of the kinetic gas theory. The latter one is well-established, being satisfyingly applied for explaining simple heat-conduction in gases, but so far it has been completely disregarded in atmospheric physics.
Using the kinetic gas theory, it was feasible to explain the ratio of the different limiting temperatures as an implication of the radiative emission. The noble gases argon, neon and helium turned out to be optimal for comparison (Figure 13) since their limiting temperatures differed enough to be interpreted, and since in any case one-atomic gases are involved. Assuming a direct correlation between the limiting temperature and the radiative emission power, astringent dependency on the product of the mean kinetic energy and the collision fre-quency could be deduced, namely
0.5 0.5 emission ~a M T p
−
Φ ⋅ ⋅ ⋅ (11)
(a = cross sectional area, M = atomic mass, T = absolute temperature, p = pres-sure)
When the heating-up rates are equal, the comparison of two gases yields for the relevant absolute limiting temperatures T1 and T2 the relation
( )
4( )
4 1 2 1 2 2 1DOI: 10.4236/acs.2018.82014 227 Atmospheric and Climate Sciences
where M1 and M2 indicate the atomic masses, and r1 and r2 the atomic radii of the compared gases. This relation could be empirically verified with the data of
helium, neon and argon.
Moreover, a rough estimate of the effective wavelength-range was possible by comparing the absorbance rates at sunlight and at artificial light, delivering the value of approx. 1.9 μm. Finally, the calculation of the radiative heat coefficient
yielded that the amount of radiative energy being transformed into kinetic heat energy is very small. Therefore, the empiric evidence was delivered that any gas is warmed up to a limiting temperature by near-infrared light as well as by sun-light.
As a consequence, it stands to reason that a principal dependency on the ra-diative emission intensity of a gas on the product of its mean kinetic energy and the collision frequency exists. This suggests a general application to any ther-mo-radiative emission process of gases—and thus likewise to atmospheric air—, delivering a hypothesis for the wanted term f p
(
atm,Tatm)
in relation (8). Sincethe cross sectional areas as well as the molecular masses of the main air compo-nents nitrogen and oxygen are similar, Equation (11) can be simplified deliver-ing the expression
0.5 emission A T p
Φ = ⋅ ⋅ (13)
whereby A represents a constant which has to be empirically determined. It may be called “atmospheric emission constant”. Hence the modified Stefan-Boltzmann relation would be written
4 0.5
SOB,lim atm atm
s T A T p
β σ
Φ ⋅ = ⋅ − ⋅ ⋅ (14a)
or rearranged
4 0.5
SOB,lim s atm atm
T A T p
σ⋅ = Φ ⋅β + ⋅ ⋅ (14b)
yielding the expression
4 SOB,lim 0.5 atm atm s T A p T
σ⋅ − Φ ⋅β
=
⋅ (15)
In order to verify this hypothetical relation and to determine the constant A, measurements were made at different altitudes for varying the atmospheric pressure applying the above mentioned method, but using thinner aluminium plates which allowed to directly determine the limiting temperatures.
4. Equipment and Locations for the Present Investigation
In order to verify the Stefan-Boltzmann relation as well as the own modelling method described in chap. 2 according to [11], the original equipment (Figure 3DOI: 10.4236/acs.2018.82014 228 Atmospheric and Climate Sciences
of a higher thermal interference in the embedding Styrofoam modules, as well as of heat losses due to ambient air convection, particularly at high plate-temperatures. The plates were painted with the same colours which had been applied within the original experiments; however, solely four colour types were used, namely white, light blue, light green, and black. The intensity of the solar radiation (given in Wm−2) was measured by an electronic KIMO® “Solarmeter” SL 100. For comparison, the results of the original measurements with 20 mm thick alumi-nium plates were quoted.
In order to verify the hypothetical formal approach (14, 15) by studying the influence of the atmospheric pressure, measurements were made at two different locations: in Glattbrugg (near Zürich, Switzerland), 430 m above sea level, and on the top of the Furka-Pass (Switzerland), 2430 m above sea level. The atmos-pheric pressure was not measured but checked by official data of the respective weather stations. However, it should be known that, from meteorological rea-sons, such data do not concern real pressure values but only normalized ones, being formally converted to the values at sea-level (zero). But since the meteo-rological pressure variations are negligibly low compared to the pressure varia-tions due to significant altitude variavaria-tions of locavaria-tions, the here relevant pressure values have solely been calculated using the usual barometric height formula (15),
0
0 8 km
0e 0e
g h h
p
p p p
ρ⋅ ⋅
− −
= ≅ (16)
ρ0 = density of the air, g = gravity constant, p0 = pressure at sea level (1 bar), h = altitude delivering the values of 0.948bar for Glattbrugg, and 0.738 bar for the top of the Furka-Pass. Between the 20th June and the 5th July 2017, altogether four useable measurements were made, two in Glattbrugg and two on the top of the Furka-Pass, letting suppose only minimal differences in the characteristics of the solar radiation. The comparative measurements with 20 mm thick alumi-nium plate had been made on 4 Sept. 2013 in Glattbrugg, hence approx. two months later (Figure 5).
As already mentioned, atmospheric pressure and temperature as well as in-tensity of the solar irradiation are not independent of each other, so it is not possible to vary solely the atmospheric pressure by relocating. However, the here proposed approach implies the different influences of the three parameters, in contrast to the Stefan-Boltzmann relation.
Since the measurements had to last till the limiting temperatures had been at-tained, it was unavoidable that the ambient air temperature increased during the exposure time of one and a half hours, due to permanent sunshine. So the am-bient air temperature was not well defined. However, this was of much less consequence with respect to the numerical verification of the alternative ap-proach (14) than with respect to the one of the Stefan-Boltzmann relation (5)
since the exponential dimension of Tam is in the former case much lower,
DOI: 10.4236/acs.2018.82014 229 Atmospheric and Climate Sciences
5. Results, Interpretation and Conclusions
As already mentioned, the measurements were made between the end of June and the beginning of July 2017, alternatingly in the low-lying Glattbrugg and on the high-lying Furka-Pass, and usually starting midday. During that whole summer the weather was windy and variable: Even when the sky was clear it was often accompanied by small scattered clouds—perhaps as a result of climate change—, which made it difficult to find dates where the conditions were suited for measurements. Although the experiments were not perfect in every case, they delivered nevertheless satisfying results.
Obviously, the starting conditions for the two kinds of measurements were quite different: While in the low-lying Glattbrugg the starting temperature was considerably higher than on the high-lying Furka-Pass (on average 27˚C, com-pared to 17˚C), the solar radiation intensity was higher on the high-lying Fur-ka-Pass, due to the thinner atmosphere layer (on average 1210 Wm−2, compared to 1075 Wm−2). As is generally known, the portion of UV-light is larger in the mountains. Surprisingly, the limiting temperatures for the blackened plates were similar in both cases (cf. Figure 15 and Figure 16), which may be due to an UV-effect. Detailed information about the test conditions is given in Table 1.
[image:18.595.210.541.492.693.2]In Figure 17 the actual results of the solar adsorption coefficients are com-pared with the results which have originally been obtained using 20 mm thick aluminium-plates (according to [11]; measuring date 4 Sept 2013, start 12:40 p.m., 1045 Wm−2). In spite of some deviations, the value-patterns are quite simi-lar. The tendency of getting higher values for the thicker plates may be explained by their higher heat capacity, allowing the expectation of smaller interferences in the module material. The larger deviations for darker colours, in particular for the black coloured plates, may be explained by the reduced insolation within the modules at higher temperatures. Moreover, the different times of year when the
DOI: 10.4236/acs.2018.82014 230 Atmospheric and Climate Sciences Figure 16. Comparison of the temperature courses during the second two measurements (continuous lines: Glattbrugg 2; dotted lines: Furka 2).
Table 1. Calculated A-values.
Location
Exp.-no. (2017) Date Start [h] Start-temp. = tatm
End-intensity
[Wm−2] tlim/A white tlim/A blue tlim/A green tlim/A black
G8 a 20 June 13:29 29.0˚C 1095 56.5˚C/22.8 69.0˚C/22.5 83.0˚C/20.8 97.8˚C/17.2
G8 b 4 July 12:46 24.3˚C 1065 54.9˚C/25.7 68.5˚C/20.7 84.0˚/23.6 100˚C/22.4
F8 a 26 June 13:01 18.9˚C 1260 47.0˚C/26.4 62.4˚C/24.3 80.0˚C/22.1 99.5˚C/12.9
F8 b 5 July 12:42 14.8˚C 1210 48.0˚C/25.9 63.0˚C/21.2 80.5˚C/20.0 97.5˚C/17.3
Explications: First column: G = Glattbrugg, F = Furka-Pass; a or b means “experiment-number”. The A-values are listed in the last four columns, unit Wm−2 bar−1 K−0.5.
[image:19.595.209.541.483.678.2]DOI: 10.4236/acs.2018.82014 231 Atmospheric and Climate Sciences
measurements were made may have a certain influence due to the different in-cident angle of the solar light effecting its spectral dispersion.
In Figure 18 the measured limiting temperatures are displayed. Obviously, this pattern is very similar to the pattern of the respective solar adsorption coef-ficients displayed in Figure 19. It empirically verifies the assertion of Equation (10) that the limiting temperatures are proportional to the solar adsorption coef-ficients. Moreover, the reproducibility of the respective values is illustrated.
[image:20.595.208.541.246.434.2]In Figure 19 the measured limiting temperature values are compared with the computed values based on the Stefan-Boltzmann relation. This means that the real counter-radiation of the atmosphere is slightly weaker than the assumed one in the Stefan-Boltzmann relation. Therefore, according to these results, the
Figure 18. Comparison of the limiting temperatures modelled (G20) and determined by four different measurements (Abbreviations: location/plate thickness in mm—experiment number a or b; locations: G = Glattbrugg, F = Furka-Pass).
[image:20.595.209.543.491.692.2]DOI: 10.4236/acs.2018.82014 232 Atmospheric and Climate Sciences
Stefan-Boltzmann relation is fulfilled to a certain extent, but not precisely. Finally, and above all, these results can be used for the verification in the al-ternative approach given by the formulas (13)-(15). In Table 1, the calculation results for the atmospheric emission constant A are listed, using formula (15). In view of the intricate measurement conditions, they coincide satisfyingly, in par-ticular with respect to the results obtained with the colours light-blue and light-green, yielding an approximate average value of A = 22 Wm−2 bar−1⋅K−0.5. As a consequence, the relation (14a, b) is verified as a general natural law, even if the value of the atmospheric emission constant A may slightly vary, also de-pending on the atmospheric conditions.
This means that for the counter-radiation solely the lowest layer of the at-mosphere—or the boundary layer of the Earth surface—is relevant, characte-rized by its temperature and—especially—by its pressure. Obviously, at lower atmospheric pressures the increase of solar irradiation, which is due to a reduced absorption within the atmosphere, is over-compensated by the decrease of counter-radiation due to the pressure loss. In the absence of solar irradiation, analogously to Equation (7) the thermal emission power of the soil can be ex-pressed by formula (17):
4 0.5
emission,soil σ Tsoil A patm Tatm
Φ = ⋅ − ⋅ ⋅
(17)
When Tatm = Tsoil, i.e. at a steady equilibrium state, T becomes 283.3 K = 10˚C for patm = 1 bar. However, normally no radiative equilibrium exists at the Earth surface but rather a gradient. As a consequence, on mountains the cooling down of the Earth surface is accelerated, compared to the one on lowlands. This main-ly explains the temperature decrease on mountains, even if additionalmain-ly thermo-dynamic effects due to rising air and to horizontal wind-convection are relevant, besides the radiative heat transfer between the atmosphere and the Space.
This approach contradicts in many ways the conventional greenhouse theory: Firstly, the boundary processes at the Earth surface and at the lowest layer of the atmosphere are predominant, while the conventional greenhouse theory regards the whole atmosphere; and secondly—even more crucial—the radiation budged is solely determined by the air conditions of the atmosphere such as pressure and temperature while so-called “greenhouse gases” such as carbon-dioxide do not have the slightest influence on the climate. Besides, the atmosphere cannot really be compared to a greenhouse, not least due to the absence of a glass-roof which absorbs IR-radiation, and which inhibits considerable air convection. Further objections are delivered in [18].
pres-DOI: 10.4236/acs.2018.82014 233 Atmospheric and Climate Sciences
sure gradients which are responsible for storms, while the conventional green-house theory has definitively proved to be fallacious and should be abandoned.
Acknowledgements
The present work has been carried out independently but not without the critical support of Dr Andreas Rüetschi and the translation assistance of Verena Ginob-bi.
References
[1] Planck, M. (1900) Ueber Irreversible Strahlungsvorgänge. Annals of Physics, 306, 69-116.https://doi.org/10.1002/andp.19003060105
[2] Planck, M. (1900) Entropie und Temperatur strahlender Wärme. Annals of Physics, 306, 719-737.https://doi.org/10.1002/andp.19003060410
[3] Planck, M. (1900) Zur Theorie des Gesetzes der Energieverteilung im Normalspectrum.
Verhandlungen der Deutschen physikalischen Gesellschaft, 2, 237-245.
[4] Beer, A. (1852) Bestimmung der Absorption des rothen Lichts in farbigen Flüssig-keiten. Annalen der Physik, 62, 78-88.
[5] Tyndall, J. (1861) On the Absorption and Radiation of Heat by Gases and Vapours, and on the Physical Connexion of Radiation, Absorption, and Conduction. Philo-sophical Magazine and Journal of Science, 22,169-194 and 273-285.
https://doi.org/10.1098/rstl.1861.0001
[6] Stefan, J. (1879) Über die Beziehung zwischen der Wärmestrahlung und der Tem-peratur. Sitzungsberichte der Kaiserlichen Akademie der Wissenschaften in Wien, Vol. 79, Aus der k.k. Hof-und Staatsdruckerei, 391-428.
[7] Dulong, M.M. and Petit (1817) Des Recherches sur la Mesure des Températures et sur les Lois de la communication de la chaleur. Annales de Chimie et de Physique, 2, 225-264 (“Des Lois du Refroidissement”) and 337-367 (“Du Refroidissement dans l’air et dans les gaz”).
[8] Lummer, O. und Pringsheim, E. (1899) Die Verteilung der Energie im Spektrum des schwarzen Körpers. Verhandlungen der Deutschen Physikalischen Gesellschaft, 1, 23-41.
[9] Boltzmann, L. (1884) Ableitung des Stefan’schen Gesetzes betreffend die Abhängig-keit der Wärmestrahlung von der Temperatur aus der electromagnetischen Lich-ttheorie. Annalen der Physik und Chemie, 22, 291-294.
https://doi.org/10.1002/andp.18842580616
[10] Meschede, D. (2002) Gerthsen Physik. Springer, Berlin, 21. https://doi.org/10.1007/978-3-662-07460-2
[11] Allmendinger, T. (2016a) The Solar-Reflective Characterization of Solid Opaque Materials. International Journal of Science and Technology Educational Research,7, 1-17. https://doi.org/10.5897/IJSTER2015.0341
http://www.academicjournals.org/journal/IJSTER/article-full-text-pdf/E7435F75915 8
[12] Kirchhoff, G. (1860) Ueber das Verhältnis zwischen dem Emissionsvermögen und dem Absorptionsvermögen der Körper für Wärme und Licht. Annals of Physics, 109, 275-301.https://doi.org/10.1002/andp.18601850205
DOI: 10.4236/acs.2018.82014 234 Atmospheric and Climate Sciences [14] Allmendinger, T. (2016) The Thermal Behaviour of Gases under the Influence of
Infrared-Radiation. International Journal of Physical Sciences, 11, 183-205.
http://academicjournals.org/journal/IJPS2016/article-full-text-pdf/E00ABBF60017
[15] Allmendinger, T. (2017) A Novel Investigation about the Thermal Behaviour of Gases under the Influence of IR-Radiation: A Further Argument against the Greenhouse Thesis. Journal of Earth Science & Climatic Change, 8, 393.
https://www.omicsonline.org/open-access/a-novel-investigation-about-the-thermal
-behaviour-of-gases-under-theinfluence-of-irradiation-a-further-argument-against-the-greenh-2157-7617-1000393.php?aid=87335
[16] Visconti, G. (2001) Fundamentals of Physics and Chemistry of the Atmosphere. Springer, Berlin.https://doi.org/10.1007/978-3-662-04540-4
[17] Boeker, E.G. and van Grondelle, R.I. (2011) Environmental Physics. 3rd Edition, John Wiley & Sons Ltd., Hoboken.https://doi.org/10.1002/9781119974178
[18] Allmendinger, T. (2017) The Refutation of the Climate Greenhouse Theory and a Proposal for a Hopeful Alternative. Environment Pollution and Climate Change, 1, 123.
https://www.omicsonline.org/open-access/the-refutation-of-the-climate-greenhous
e-theory-and-a-proposal-for-ahopeful-alternative.php?aid=88698
[19] Arrhenius, S. (1896) On the Influence of Carbonic Acid in the Air upon the Tem-perature of the Ground. Philosophy Magazine, 41, 238-276.
[20] Ångström, K. (1901) Ueber die Abhängigkeit der Absorption der Gase, besonders der Kohlensäure, von der Dichte. Annalen der Physik, 311, 163-173.
https://doi.org/10.1002/andp.19013110913
[21] Allmendinger, T. (2017) Measures at Buildings for Mitigating the Microclimate.
Environment Pollution and Climate Change, 1, 128.
https://www.omicsonline.org/open-access/measures-at-buildings-for-mitigating-the
-microclimate-2573-458X-1000128.php?aid=90625


![Figure 9. Solar-tube according to [14].](https://thumb-us.123doks.com/thumbv2/123dok_us/9296096.427119/12.595.287.461.472.706/figure-solar-tube-according-to.webp)
![Figure 11. Equipment with hotplate according to [18].](https://thumb-us.123doks.com/thumbv2/123dok_us/9296096.427119/13.595.303.445.283.468/figure-equipment-hotplate-according.webp)

![Figure 14. Limiting temperatures for different gases at different positions, average values of two measurements, according to [18] (heat power 37.1 W, initial temperature 23.5˚, pressure ca](https://thumb-us.123doks.com/thumbv2/123dok_us/9296096.427119/15.595.205.541.59.264/limiting-temperatures-different-different-positions-measurements-according-temperature.webp)

