Munich Personal RePEc Archive
Creativity, cities and innovation
Lee, Neil and Rodríguez-Pose, Andrés
London School of Economics, London School of Economics
July 2013
Creativity, cities and innovation
Neil Lee
Department of Geography and Environment, London School of Economics
Andrés Rodríguez-Pose*
Department of Geography and Environment, London School of Economics
Abstract
The creative industries have long been seen as an innovative sector. More recent
research posits that creative occupations are also a fundamental, but overlooked,
driver of innovation. Theory also suggests cities are important for both creative
industries and occupations, with urban environments helping firms innovate. Yet little
empirical work has considered the links between creative industries, occupations,
cities and innovation at the firm level. This paper addresses this gap using a sample of
over 9,000 UK SMEs. Our results stress that creative industries firms are more likely
to introduce original product innovations, but not those learnt from elsewhere.
Creative occupations, however, appear a more robust general driver of innovation.
We find no support for the hypothesis that urban creative industries firms are
particularly innovative. However, creative occupations are used in cities to introduce
product innovations learnt elsewhere. The results suggest future work needs to
seriously consider the importance of occupations in empirical studies of innovation.
Keywords: Innovation; Creative Industries; Creative Occupations; Cities; Learning
JEL: O31; O38; R11; R58
* Corresponding author.
Acknowledgements: This research has benefited from the generous financial support
of the European Research Council under the European Union’s Seventh Framework
1. Introduction
Creativity is considered highly important for innovation and economic success
(Andari et al. 2007; Huggins and Clifton 2011; Cooke and De Propris 2011). Firms in
the creative industries, such as design, publishing, software or the arts, are normally
seen as particularly innovative (DCMS 2001; Miles and Green 2008; Bakshi and
McVittie 2009; Müller et al. 2009). Cities are important for these relationships:
creative industries tend to be urban industries, which take advantage of shared
knowledge and of a density of specialised customers, suppliers and workers to create
new products (Therrien 2005; Pratt 2006; Asheim et al. 2007; Reimer et al. 2008;
Stam et al. 2008). Firms benefit from both the diversity of urban environments, which
may provide a range of stimuli, and the specialisation urban locations allow.
Furthermore, recent research posits that such externalities will be related to city size:
larger cities provide greater externalities, making firms in large cities more innovative
(Duranton and Puga 2004; Stolarick and Florida 2006).
Yet, beyond case studies, there is little empirical evidence that the creative industries
are more innovative than other sectors, that urban creative industries are particularly
so, and that these effects are amplified in larger cities. A small number of studies have
considered the geography of innovation in the creative industries in the UK and
produced descriptive results which often run contrary to theoretical expectations (De
Propris et al. 2009; Chapain et al. 2010). For example, Chapain et al (2010) show that
the creative industries in London are less innovative than creative industries
elsewhere. Despite the fact that creative industries have significantly crept up in
governments’ development policy agendas (Jayne, 2005; Evans 2009), the evidence base on the creative industries, innovation, and development is surprisingly weak
(Sunley et al. 2008; Lee and Drever 2012).
Moreover, creativity is not limited to particular industries, and research has suggested
that creative occupations may also be key drivers of innovation (Vinodrai 2006;
Bakshi et al. 2008; Cunningham and Higgs 2009; Cunningham 2010; Lee and Drever
2012). Creative workers ‘embedded’ in other sectors, such as designers in
manufacturing, may be part of the innovation strategy of firms (Cunningham and
activity in cities, to take advantage of the specialised labour markets, inputs and
exchanges of knowledge they offer (Duranton and Puga 2001). Yet a second gap in
the literature relates to the link between creative occupations and innovation.
This paper investigates these issues for the first time using a dataset of over 9,000 UK
SMEs in 2007/8. Our results show that while creative industries firms are more likely
to introduce original product innovations, there is no ‘urban effect’. Moreover,
creative industries firms are no more (or less) likely to introduce process innovations.
However, the link between creative occupations and innovation in firms is
considerably stronger. Creative occupations are used by both urban and rural firms to
develop entirely new products (‘original innovations’). Moreover, urban firms use
creative occupations to help modify and reintroduce products from elsewhere (‘learnt
innovations’). Alongside this, we show that creative occupations are a key driver of
learnt process innovations.
These are important issues for both academic research and government policy. The
UK government provides support including advice, finance and tax relief for creative
industries firms.1 Such policies lead to questions such as whether these should be
spatially targeted at urban areas, or whether focus is instead needed in encouraging
firms to employ creative individuals.
The paper makes a number of contributions to the emerging literature on the links
between the creative industries, occupations, innovation and cities. There have been
longstanding concerns about the limitations of research on the creative industries and
innovation (Jayne 2005; Sunley et al. 2008). The size of our dataset and the coverage
for both creative and non-creative firms represents an improvement on previous work
in this area which has tended to focus exclusively on creative industries firms (Müller
et al. 2009). In addition, while past work has linked creative occupations to
innovation in an econometric framework (Bakshi et al. 2008), our research improves
on this measure by introducing regional as well as sectoral variation, finding a
1
positive and significant result. Finally, this paper adds to the literature by considering
using econometric methods the interactions between the creative industries, creative
occupations and cities. In doing so, it builds on work investigating the geography of
the creative industries in the UK (Chapain et al. 2010), but links this to other work on
the innovation performance of urban firms.
The paper is structured as follows. In section two we consider the literature on
innovation, creative industries, occupations and cities and develop hypotheses for the
links between them. In section three we outline the main sources of data for this paper
and present the descriptive statistics on innovation in the creative industries. In
section four we introduce a model of firm level innovation and use it to address our
hypotheses. In section five we conclude with implications for theoretical work in this
area and policy.
2. Creative industries, occupation and innovation
The supposed innovativeness and dynamism of creative industries in advanced
economies has attracted considerable attention in recent years (Power 2002, 2010;
Turok 2003; Andari et al. 2007; Evans 2009). Creative industries are a diverse set of
industries, defined by the Department for Culture, Media and Sport in the UK as:
Advertising; Architecture; Art and Antiques; Designer Fashion; Video, Film and
Photography; Music and the Arts; Publishing; Software, computer games and
electronic publishing; Radio and TV; Craft, and; Design. One reason for their
importance is innovation (Bakshi et al. 2008). While there is considerable diversity in
innovative performance between sub-sectors, the creative industries are considered as
relatively innovative (Müller, Rammer and Trüby 2009; Chapain et al. 2010). As they
are by definition reliant on the production of new goods, the creative industries are
likely to produce more product innovations. Moreover, the creative industries operate
in a rapidly changing environment where project teams are modified and reconfigured
to respond to the market (Pratt 2006). This may result in more process innovations.
Empirical work has tended to support the perception of product and process
innovation rich industries, with the exception of studies of London where the creative
2012). Yet there are a number of reasons why the creative industries may be less
innovative than at first appear. Firms may innovate in subtle ways which cannot be
captured in innovation surveys (Chapain et al. 2010). Or creative industries firms may
simply not be as innovative as other parts of the economy. The overall expectation,
however, is that firms in the creative industries are more innovative than others. Our
first hypothesis is:
H1 SMEs in the creative industries are more likely to introduce product and process innovations than firms in other sectors
While the creative industries have been well studied, relatively less research has
considered the link between creative occupations and innovation (Vinodrai 2006;
Bakshi et al. 2008; Cunningham and Higgs 2009; Comunian et al. 2010; Cunningham
2011; Marrocu and Paci 2012). Yet these occupations have been growing rapidly in
many cities: in London, for example, while employment in the creative industries
grew by 40 percent between 1995 and 2007, the number of workers in creative
occupations grew by over 70% (Freeman 2010). Most research on this area has
considered Richard Florida’s ideas of the creative class, a set of workers in ‘creative occupations’ in the knowledge economy (Florida 2002; 2005; Florida et al. 2008). This has come under considerable criticism (Huggins and Clifton 2011), not least
from Anne Markusen (2006) suggesting that it is a convenient label for a group of
workers with high human capital.
A few studies have tested the link between creative occupations and innovation. For
example, Marrocu and Paci (2012) find that across regions of the European Union
highly educated individuals in creative occupations have an important effect in overall
production efficiency. Bakshi et al. (2008), using Community Innovation Survey data
and an industry level indicator of creative employment, test for a relationship between
creative employment and innovation. They find no relationship with product
innovations overall, but a weak positive relationship for new (novel, rather than new
to the firm) product innovations. Lee and Drever (2012) investigate similar linkages
in London’s firms. They find no link between creative occupations and process
innovation, but significant positive relationships with both new product innovation
Bakshi et al. (2008) consider only sectoral variation in creative occupations, Lee and
Drever (2012) only consider the exceptional city of London. No study has yet
considered variation at a sectoral and regional level. From this we take hypothesis
two:
H2 SMEs employing staff in creative occupations are more likely to introduce product and process innovations
A wealth of papers have suggested that cities may aid innovation amongst creative
firms (e.g. Asheim et al. 2007; Huggins and Clifton 2011), making creativity a
fundamentally urban phenomenon. Spillovers of knowledge are regarded as
important in aiding innovation. Cities provide a diverse environment which may
stimulate innovation (Nathan and Lee 2011). The density of labour markets they
provide will allow complex reconfigurations of teams, and this will create new ways
of working and processes (Grabher 2001; 2002). This will result in a creative city
effect, with urban creative industries firm innovating more. This forms the basis of
hypothesis three:
H3 Urban creative industries firms or those employing creative occupations will be more likely to introduce product and process innovations than other firms
Alternatively, however, urban firms may be no more innovative than others. Firms
may sort into particular areas based on their relative competitive advantage, and
would otherwise not survive. Those producing genuinely original innovations may not
want to co-locate near other firms and so will protect their innovations with rural
locations. The innovative performance of firms in rural areas may be underestimated,
with isolated firms accessing knowledge from elsewhere and innovating in alternative
ways (Fitjar and Rodríguez-Pose 2011a). Research on London, for example, has
suggested that international linkages are more important for innovation than local
knowledge spillovers (Gordon and McCann 2005). While some high profile
‘innovative cities’ may appear innovative, whether this is because of local linkages or more prosaic access to international markets is unclear (Shearmur 2012). The
Similarly, the relationship between creative occupations and cities may not be simple.
Vinodrai (2006) argues that because of the tacit and embodied nature of knowledge in
many creative fields, career moves of highly skilled workers provide an important
mechanism through which firms acquire the knowledge to innovate. She suggests that
designers play a role in the innovation processes of other firms, and move from firm
to firm to share new innovations. Other creative occupations, as they are reliant on
exchanges of subtle, tacit and context specific knowledge may also see similar effects.
Such moves are likely to happen in a city, and evidence suggests that staff moves are
an important driver of agglomeration economies, as they enable the sharing of best
practice between firms (Eriksson and Lindgren 2009). From this perspective, creative
industries and occupations are likely to be more effective in larger cities. This is the
final hypothesis:
H4 Urban size matters for the innovative capacity of creative industries and occupations
Hence creative firms/occupations in a city like London are likely to lead to greater
innovation than those located elsewhere in the United Kingdom. If so, this may
provide one explanation for the uneven geography of creative occupations in the UK,
and their uneven wages (Comunian et al. 2011).
3. Data and methodology
The Data
The data for this study come from the Annual Small Business Survey (ASBS),
2007/8, conducted by the UK Department for Business, Innovation and Skills (see
Williams and Cowling 2009). It is a telephone survey of Small and Medium Sized
Enterprises (SMEs), defined as employing fewer than 250 employees. Firms are
sampled randomly from Dun & Bradstreet data, but are stratified by size. Booster
samples are included for particular groups (these are dealt with through weighting).
We exclude firms where variables are missing, giving a sample of 9,158 SMEs.
We derive our definition of the creative industries from the UK Department for
Culture, Media and Sport (DCMS). This divides the creative industries into eleven
sectors: Advertising; Architecture; Arts and Antique Markets; Crafts; Design;
Designer Fashion; Film, Video and Photography; Software, Computer Games and
Electronic Publishing; Music and the Visual and Performing Arts; Publishing, and;
Television and Radio. Here, we use a tighter definition which only includes sectors in
which at least 25 per cent of firms can be seen as in the creative industries. This
makes us drop Arts and Antique Markets; Crafts; Design; and Designer Fashion from
the sample. Full details of the classification are included in table 1. Applying this
definition to the ASBS gives a sample of 727 creative industries firms (7.3 per cent).2
Table 1 around here
The DCMS definition is not without controversy (Hesmondalgh and Pratt 2005; Pratt
2008). It includes a highly diverse range of sectors, including both technical work
(software) and the traditional arts (Hesmondalgh and Pratt 2005; Freeman 2010). Two
sectors, Design and Crafts cannot be matched to the standard SIC codes. Fortunately,
they also do not meet our 25% threshold of overall firms in the creative industries and
are not included in our data. However, the definition is widely used within the
academic community and generally accepted by policy- and decision-makers.
Creative occupations
Creativity is not limited to particular sectors, and many of those performing creative
work do so outside the creative industries. DCMS (2009) estimate that in 2009 there
were almost two million (1,978,200) people working in ‘creative employment’ in the
UK. Of this, 1,15 million were employed in the creative industries themselves (i.e.
working in firms in the creative industries), and 830,000 working in creative
occupations but outside of the creative industries, such as graphic designers in
manufacturing.
Our measure of the creative occupations is the proportion of employment in creative
occupations in each industry in each region. The definition of creative occupations
2
comes from the DCMS, and consists of the same sub-sectors as the creative industries
measure (DCMS 2007). Each sub-sector consists of occupations rather than specific
industries. For example, the category of Designer Fashion occupations includes two
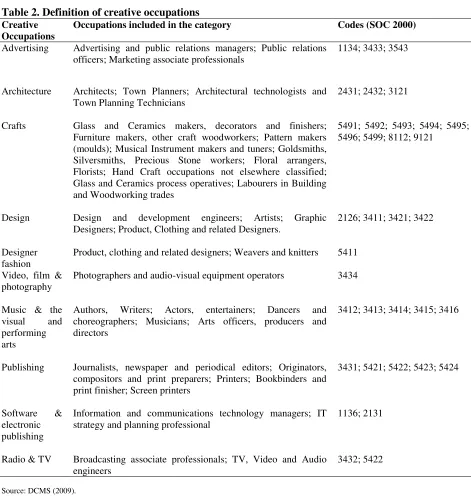
occupations: “Product, clothing and related designers” and “Weavers and Knitters”.
Full details are given in table 2.
Table 2 around here
As the ASBS does not include a variable for creative occupations, ours is constructed
using a separate survey, the Annual Population Survey (APS). The APS is a sample
survey with valid occupational data for 159,003 workers. Following previous work in
this area (Bakshi et al. 2008; Lee and Drever 2012), we use this to construct a variable
for the proportion of employment in creative occupations in each industry (using 2
digit SIC codes), in each region. This gives 706 industry/region combinations, and
should allow us to test both geographical and sectoral differences in innovation
performance.3 Our variable can be understood as the share of creative occupations in
each industry in each region.
There is some overlap between the creative industries and creative occupations
variables, as those working in the creative industries are more likely to employ those
working in creative occupations. The pairwise correlation between the two variables
is 0.29 (p<0.001).
Innovation in the creative industries
Innovation in the creative industries is complex, and has been the subject of relatively
little research (Miles and Green 2008; Brandellero and Kloosterman 2010). Novelty is
important for creative industries firms, which are by definition based on subtle
production and reproduction and symbolic changes to existing products (Sunley et al.
2008). The emphasis on creative industries products is normally subjective and
focused on experience value rather than use value (Throsby 2001). Because of this,
Stoneman (2009) argues that creative industries produce ‘soft innovations’ which may
be aesthetic or involve new content production. The methods of innovation will also
differ for creative industries firms, with less emphasis on R&D and more on face to
face interaction and learning by doing (Chapain et al. 2010; Martin and Moodysson,
2011).
The standard definition of innovation is the commercial exploitation of new ideas
(Fagerberg 2005). This is normally broken into two types: product innovation, or the
introduction of new products and services and process innovation, or new techniques
and processes of production. For example, a new product might be a game introduced
by a software company; a process might be a new project management process used
in the production of this game. This distinction is important for the creative industries.
As they are defined by the production of new content, it is important to consider new
product innovation as creative industries firms will innovate more on this measure.
Similarly, process innovation may be important for creative industries firms, as they
are seen as operating in a rapidly changing environment, with new teams and
processes being assembled on a project-by-project basis (Jaw et al. 2012). However,
one limitation is that considering only product and process innovation means missing
innovation in other areas, such as branding or user experience (Brandellero and
Kloosterman 2010).
A second key distinction is between original innovations that are entirely new, and
learned innovationswhich are ‘new to the firm’ but copied from an original innovator
(Müller et al. 2009). There are, of course, some ambiguities in this distinction:
innovations often involve complex reconfigurations of existing products or processes
and so entirely original innovations may be rare. We cannot account for the
significance of innovations, and the SBS has only a 12-month timescale. Because of
this, our data may miss significant but rare innovations but include regular but trivial
ones. But controlling for whether innovations are original or learnt helps assess
whether results are driven by the production of differentiated content or new
applications of content taken from elsewhere (Jaw et al. 2012).
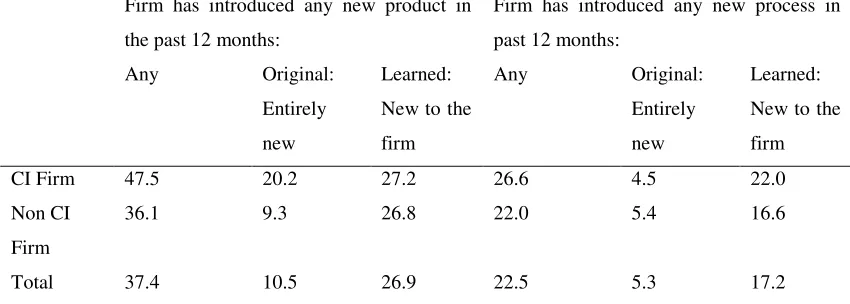
The SBS contains information on six measures of innovation, reflecting the
distinctions between product and process and original and learned innovations.
Details are set out in Table 3. The first three measures are for product innovation.
previous 12 months, (2) whether firms have introduced an entirely new product or (3)
whether they have introduced a product which was new to the firm. 47.5 per cent of
creative industries’ firms have introduced a new product, compared to only 36 per
cent of other firms. This advantage is far stronger for entirely new products (20.2 per
cent of creative industries firms compared to 9.3 per cent of others) and those which
are new to the firm (27.2 per cent compared to 26.8 per cent). Firms in the creative
industries are more innovative on all measures. Other work has found similar results,
with Chapain et al. (2010) further suggesting that the creative industries are
particularly likely to introduce new service products, rather than tangible physical
products.
Table 3 around here
We also consider three measures of process innovation. These are (4) whether a firm
has introduced any new process in the past 12 months, (5) whether this was an
entirely new processor (6) a process which is new to the firm. There is less evidence
that creative industries firms are more likely to introduce new processes, however:
26.6 per cent of creative industries firms have introduced new processes, only slightly
more than other firms. They, by contrast, appear more prone to introduce processes
which are only new to the firm (22.0 compared to 16.6 per cent).
The complexity of innovation in the creative industries means there are inevitable
limitations to the measures used here. Innovation in the creative industries may
include subtle improvements to existing products, which are so subtle that they are
not counted in the SBS. Moreover, other forms of innovation may be important for
creative industries firms. For example, Brandellero and Kloosterman (2010) argue
that in the cultural industries experience and user-interface innovation may be
important. These problems provide important caveats on the interpretation of any
innovation survey.
Innovation is complex, and no measure is perfect. Innovation in the creative industries
rarely relies on formal R&D or is expressed in patenting (Miles and Green 2008).
across sectors. Moreover, the results of these data are intuitively consistent with other
theoretical views about innovation, with innovation correlated with better firm
management and growth.4 In the absence of any feasible alternatives, and given the
need to compare innovation across sectors, survey based measures are the best
possible way of identifying innovative firms.
4. Model & Results
4.1 The Model
To test the links between the creative industries, occupations and innovation we use a
firm level innovation production function (Fitjar and Rodríguez-Pose 2011a). The
model is estimated as a probit where the dependent variable is the introduction of new
innovation by a firm:
INNOVi = + 1 CIi + 2 COCCi + 3 URBANi + 4 CI*URBANi +
5 COCC*URBANi + 6 FIRMi + 7 ACTIVITYi + 8 REGi + φ + (1)
where,
INNOV is whether firm i introduces one of six types of product or process
innovation in the previous 12 months;
CI is a variable for whether the firm is in the creative industries;
COCC is the proportion of employees in the sector / region in creative
occupations;
URBAN is a variable for whether a firm is located in an urban area; with
4
CI*URBAN and COCC*URBAN interaction terms between the creative
industries and creative occupations variables and the urban variable,
FIRM is a vector of variables to account for the basic characteristics of the
firm, these being whether the firm is a sole trader, three firm size dummies,
three age dummies, whether the firm is a Public Limited Company (PLC) and
whether it has Multiple Sites;
ACTIVITY is a set of variables that control for the innovation related
activities of the firm. These are whether the firm takes advice from elsewhere,
exports and aims to grow;
REG includes 11 dummy variables for the Government Office Regions
alongside dummies for Wales and Scotland;
finally ‘φ’ are sectoral controls (15, of which the CI variable is one) and ‘’ is
the error term.
Further details on the variables and their sources are given in table 4. The model is
estimated using robust standard errors.
Control variables
The first set of control variables accounts for the basic characteristics of firms. As the
likelihood of innovating is very different for sole traders relative to other firms, a
variable is included for this (Higón and Driffield 2012). We expect sole traders to be
less likely to innovate, as they have fewer resources to devote to innovative activity.
In contrast, larger companies will have greater resources for innovation (while
innovative firms are likely to grow). We include size dummies for whether firms are
micro (1 – 9 employees) or small (9 – 49). The reference category is medium sized
enterprises (50 – 249 employees).
new products when they enter existence, and because they will have fewer existing
products on the market. We control for this with three age dummies: age 1–4, 5–10
and 11 years or older. The reference category is firms in their first year.
We also control for the legal structure of the firm, through a variable for whether a
firm is a PLC or not. PLCs will face pressure from outside owners or shareholders to
innovate (Nathan and Lee 2011), and may be more innovative. Finally, firms with
multiple sites will have access to a wider range of external knowledge sourcing and
will often be better managed.
The second set of controls, ACTIVITY, are for the firm’s activities. As firms which
source knowledge externally should be more innovative we include a variable for
whether a firm takes advice from elsewhere (Fitjar and Rodríguez-Pose 2011a). A
similar logic applies with exporting firms, although there are causality issues with
whether firms import first or innovate first (Higón and Driffield 2012). Finally, firms
should be more likely innovate where they aim to grow and so we control for this
(Lee 2011).
Finally, we include sets of dummy variables for sector and region. The sector
dummies are 11 dummies for the UK Government Office Regions and country
dummies for Scotland, Wales and Northern Ireland. As patterns of innovation clearly
vary by sector, we also include 15 sectoral dummies, one of which is the creative
industries variable.
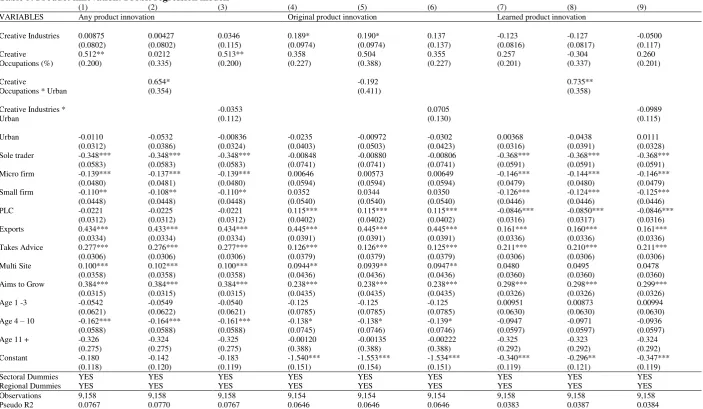
4.2 Product innovation
Table 5 gives the results of the models for product innovation, original product
innovation and learned product innovation in turn. The diagnostic plots are
reasonable, although there is minor evidence of collinearity in the model, which
mainly concerns the age category 2 (VIF = 10.16). However, the key results remain
unchanged when the age variable is excluded from the analysis, underlining the
First, we consider the innovation potential of firms in the creative industries. The
results of the analysis show that, contrary to what was stated in our hypothesis 1, the
creative industries are no more likely to produce any type of product innovation than
firms in other sectors. Column 1 gives the basic regression without interaction effects.
The effect is positive but not significant. This result probably reflects a relatively high
diversity of innovation performance between firms in different sub-sectors of the
creative industries. It may also be because of the measure of innovation. Chapain et
al. (2010) distinguish between new tangible product innovations and new service
innovations, and find that creative industries, relative to other firms, are more likely to
introduce new service innovations (although they do not control for other
characteristics).
However, creative industries firms are more prone to introduce original product
innovations (column 4), but not learned product innovations (column 7). The
coefficient for original product innovations is positive but only significant at the 10%
level. The creative industries have an advantage in completely original product
innovations, rather than those introduced from elsewhere. This suggests that
hypothesis 1 – that the creative industries were more likely to introduce product and
process innovations – is at least partially true.
There is stronger evidence to support our hypothesis 2: that creative occupations drive
innovation. Creative occupations are positively related to product innovations overall,
with the effect driven by their role in original product innovations. Workers in
creative occupations are used in firms regardless of geography to create new products.
Hence, creative occupations seem to be more important for innovation than creative
industries.
In columns 3, 6 and 9 we consider whether there is a city effect – are creative
industries firms in urban environments more innovative? This is tested using an
interaction term between the creative industries and the urban variable. However,
there appears to be no evidence for this effect. Urban creative industries are no more
(or less) innovative than firms in other sectors, allowing us to dismiss our third
hypothesis – urban creative industries firms are not more likely to introduce
However, there is a highly significant and positive effect from creative occupations
and product innovation in cities (columns 2, 5 and 8). This effect is not driven by the
interaction between creative occupations and original product innovation, but from
learned product innovation. In short, creative occupations are used in cities to
introduce product innovations from elsewhere. This effect supports previous work
suggesting that exchanges of knowledge between creative workers in dense urban
labour markets may be an important driver of innovation.
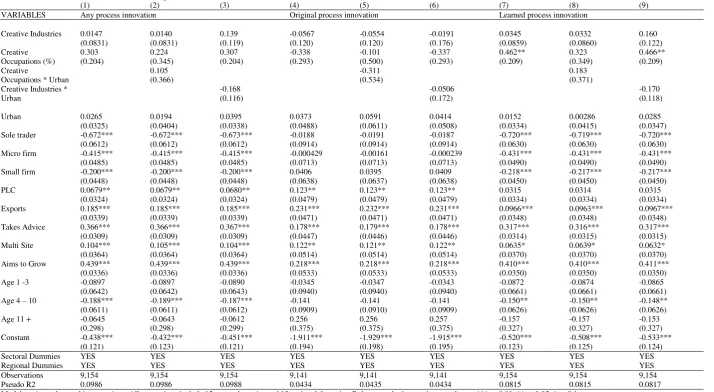
4.3 Process innovation
Table 6 gives the results for process innovation. As before, there is some evidence of
collinearity in the age categories, but this does not affect the key results. Creative
industries SMEs appear no more (or less) likely to introduce process innovations than
firms in other sectors. This result applies for all three types of innovation, and
regardless of whether controls are used. The view of the creative industries as making
complex organizational changes in response to market changes does not appear
warranted by our results. Hypothesis 1, that the creative industries are more
innovative, does not apply in the case of process innovation.
In contrast, there is – as with product innovation – a significant positive relationship
between creative occupations and any type of process innovation. However, the result
is driven by process innovations which are learnt, rather than original. Creative
occupations are used by firms to introduce new processes from outside the firm.
Hypothesis 2 is again supported as creative occupations are important for innovation,
but only partially.
Turning to the results with the urban interaction, there is no relationship between the
creative industries and process innovation in cities. Again, hypothesis three is not
supported. Our general result – that there is no link between the creative industries
and process innovation – stands.
Our fourth hypothesis is that the creative industries will be more innovative in large
cities. The data do not have geographical identifiers at a lower level than region.
However, we can isolate firms in London – traditionally seen as a highly creative city.
Although, from a more theoretical point of view, research has tended to support the
idea that urban externalities in large cities may act as a catalyst for innovation,
especially in the case of start-ups and SMEs (Duranton and Puga 2001), which feature
prominently in the creative industries sector, past research has noted that the creative
industries in London may be less innovative than the creative industries elsewhere
(Chapain et al. 2010; Lee and Drever 2012).
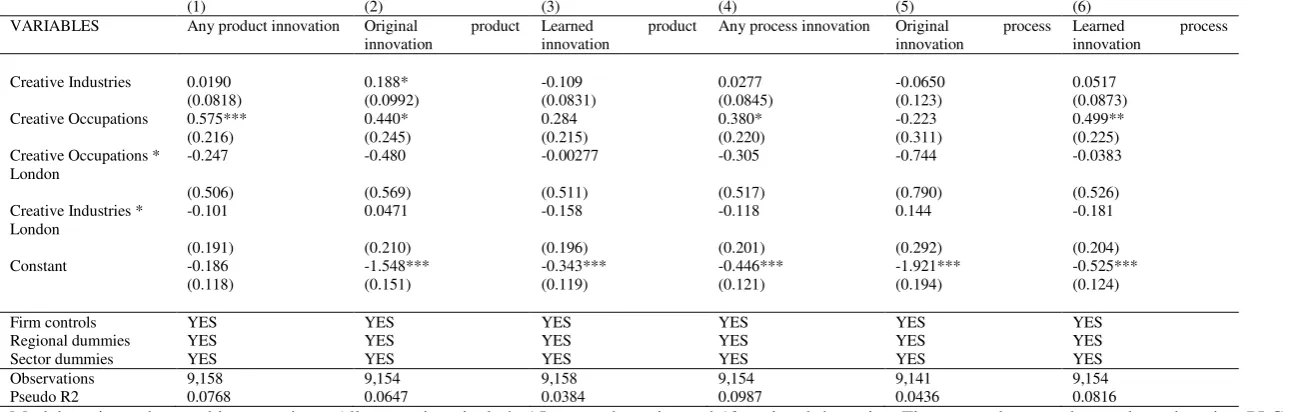
Table 7 gives results for the interaction terms (models also include the full set of
controls). While the effect is not significant, creative industries SMEs in London are,
if anything, less likely to introduce new product innovations. There seems to be no
specific effect from creative occupations in London. Instead, the use of creative
occupations to introduce innovations to firms from elsewhere appears valid to all
cities, regardless of size. In short, in London, creative occupations are used for
entirely new innovations rather than for copying firms from other sectors. This result
corroborates previous research which suggests that innovation in London is somehow
different to that in other cities (Wood 2009). It also posits that the link between urban
scale and innovation in the creative industries is not as clear as sometimes portrayed.
Creative occupations are still a robust driver of innovation in the capital, but this is
not a London specific effect.
Overall, these results run counter to our initial hypothesis 4 that urban size is
important for innovation. We find no support that creative industries firms or those
employing creative workers are more innovative in the largest city in the UK than
elsewhere. One explanation is that measures of innovation in surveys may not account
for the subtle and often tacit nature of innovation in London (De Propris et al. 2009).
However, other research suggests that the importance of geography and local linkages
for the creative industries may have been exaggerated (Turok 2003; Gordon and
5. Conclusions
There is a widespread view that firms in the creative industries sector are more
innovative than those in other sectors. The very creativity which defines this
heterogeneous collection of firms is considered to be at the root of innovation.
Moreover, there is a wide literature suggesting that the creative class is a driver of
economic growth in cities or regions (Marlet and van Woerkens 2007; Florida et al.
2008; Boschma and Fritsch 2009). However, in spite of these claims, there is limited
empirical evidence which proves that creative industries are more innovative and that
urban environments encourage innovation in this type of firms. In this paper we test
whether creativity is indeed linked to innovation at firm level in the UK. We use two
measures of creativity, distinguishing between the more traditional measure of
creative industries and the often overlooked creative occupations.
The results of the analysis suggest that creative industries may not be as innovative as
expected. Our results indicate that firms in the creative industries are more likely to
introduce entirely new products than firms in other sectors, but that there is no overall
link with innovation more generally. Creative occupations, by contrast, appear a more
important driver of innovation generally, and are used to develop entirely new and
learned innovations in both urban and rural locations. In some respects this result is
unsurprising and is in line with recent research underlining the importance for
innovation and positivity of educated individuals working in creative occupations
(e.g. Marrocu and Paci, 2012). While innovation research has moved beyond a narrow
focus on a linear model based on a scientific perception of innovation (Freel and
Harrison 2006), studies still tend to collect data on R&D but not on creative inputs.
Yet employing a worker in a creative occupation is an innovation input in a similar
manner to employing a scientist. This is particularly the case given that new product
innovation in some science-based fields may be based on large-scale discoveries, such
as new drugs. For the majority of firms a more common innovation may be the design
of a new service product. The economic importance of creative occupations in this
sense may help explain the resilience of some creative occupations in the recent
We also find no evidence that creative industries are more innovative in cities,
meaning that, at least in the case of the UK, the role of externalities in driving
innovation amongst creative firms in cities may be overstated. The UK is a small and
relatively densely populated country, and the types of knowledge links required for
innovation in the creative industries may apply even in rural areas (see, for example,
the success of creative places such as Falmouth in Cornwall). This finding may also
reflect the increasing importance of digital business models in the creative industries.
Moreover, the composition of local economies may be more important than their scale
– the benefits of cities generally may be less important than the benefits of particular city characteristics which are only possessed by certain cities. However, creative
occupations do appear important in introducing ‘learned’ product innovations in
cities. The exchange of knowledge between economic actors is commonly cited as a
reason urban firms are more innovative. One way this takes place is through staff
transfers (Erikson and Lindgren 2009). Creative workers moving from firm to firm
may be able to share knowledge about products, and help introduce them to new
firms.
Finally, we find no evidence that the creative industries are more innovative in large
cities. Firms employing creative occupations are no more (or less) innovative in
London, while creative industries firms tend to be less innovative, once controlling
for their characteristics. This supports other research which suggests that the creative
industries in London are actually less innovative than those elsewhere (Chapain et al.
2010). Firms which are not located in large cities may develop alternative strategies to
innovate (Fitjar and Rodríguez-Pose 2011b), while local links may be overstated as a
driver of innovation in creative firms (Turok 2003). It may alternatively be because of
our measures of innovation, with urban creative firms specialising in intangible and
subtle modifications to existing products which are not captured in the innovation
measure used here (Lee and Drever 2012). The results support other research which
has argued for a more nuanced link between city size and the creative industries
(Waitt and Gibson 2009).
Overall, the results overall raise questions about current perceptions of the creative
industries only have an advantage in one. The papers also has a number of policy
implications. The first is that schemes, such as those funded by the European
Regional Development Fund, which are designed to help innovation in the creative
industries may need to be better targeted. Indeed, aiding firms to take workers in
creative occupations may be a more efficient way of stimulating innovation. A second
implication is that policies for firms in creative industries may not be best targeted at
urban firms only or specific geographical areas. Our results suggest that firm
characteristics are more important than location in determining the likelihood of
innovation.
The results open up important avenues for future research. First, our variable for
creative occupations for industry / region is an improvement on previous research.
Our results also imply that future surveys should incorporate a creative occupations
variable. Second, our outcomes on the role of the urban dimension for creativity and
innovation may be affected by the use of measures of ‘urban’ and urban scale which
remain relatively blunt. Processes may operate differently in cities with high shares of
creative occupations relative to those with fewer. Research using more advanced data
may want to tease this out.
Finally, and perhaps most importantly, our results are limited to the measures of
innovation in the ASBS. These are the best available indicators, and they are broad
enough to capture innovation in a range of sectors. There is no single measure of
innovation, and our results – like those using patents or other questions – are
inevitably limited. However, innovation in the creative industries is particularly
complicated and our results need to be considered with this interpretation in mind.
Subtle processes of marginal design improvement, which are important in the creative
industries, may not seem as distinct from minor changes in other products in the SBS.
Moreover, we cannot investigate the significance of innovations (Coad and Rao
2008). Future research should consider using a fuller set of innovation indicators to
address the limitations outlined above.
Andari, R. Bakshi, H, Hutton, W. O’Keefe, A. and Schneider, P. (2007) Staying ahead? The economic contribution of the creative industries. London: Department for Culture, Media and Sport.
Arts Council (2012) “Arts Council England launches Creative Industry Finance programme” Press Release from the Arts Council. [Accessed 1st January 2013]
http://press.artscouncil.org.uk/Press-Releases/Arts-Council-England-launches-Creative-Industry-Finance-programme-67c.aspx
Asheim, B. T., Coenen, L. and Vang, J. (2007) Face-to-face, buzz and knowledge bases: Socio-spatial implications for learning, innovation and innovation policy. Environment and Planning C: Government and Policy, 25 (5), pp. 655 – 670.
Bakshi, H., McVittie, E. and Simmie, J. (2008) Creating innovation: Do the creative industries support innovation in the wider economy? London: National Endowment for Science, Technology and the Arts.
Bakshi, H. and E. McVittie (2009) Creative supply chain linkages and innovation: Do the creative industries stimulate business innovation in the wider economy? Innovation: Management, Policy and Practice, 11 (2): 169-189.
Boschma, R. A. and Fritsch, M. (2009) Creative class and regional growth: Empirical evidence from seven European countries. Economic Geography, 85 (4): 391 – 423.
Brandellero, A. and Kloosterman, R. C. (2010) Keeping the market at bay: exploring the loci of innovation in the cultural industries. Creative Industries Journal, 3 (1): 61-77.
Chapain, C., Cooke, P., De Propris, L., MacNeill, L. and Mateos-Garcia, J. (2010) Creative clusters and innovation: Putting creativity on the map. London: National Endowment for Science, Technology and the Arts.
Coad, A. and Rao, R. (2008) Innovation and firm growth in high-tech sectors: a quantile regression approach. Research Policy, 37: 633 - 648
Cooke, P. and De Propris L. 2011. A policy agenda for EU smart growth: The role of the creative and cultural industries. Policy Studies, 32 (4): 365 – 375.
Comunian, R., Faggian, A. and Li, C. Q. (2010) Unrewarded careers in the creative class: The strange case of bohemian graduates. Papers in Regional Science, 89 (2): 389-410.
Comunian, R., Faggian, A. and Jewell, S. (2011) Winning and losing in the creative industries: an analysis of creative graduates' career opportunities across creative disciplines. Cultural Trends, 20 (3-4): 291-308
Cunningham, S. (2011) Developments in measuring the "creative" workforce. Cultural Trends, 20 (1): 25-40.
Department for Culture, Media and Sport [DCMS] (2001) Creative industries economic estimates. London: DCMS.
Department for Culture, Media and Sport [DCMS] (2007) Creative industries economic estimates 2006 - Statistical Bulletin. London: DCMS.
Department for Culture, Media and Sport [DCMS] (2009) Creative industries economic estimates 2007 - Statistical Bulletin. London: DCMS.
Department for Culture, Media and Sport [DCMS] (2013) Classifying and Measuring the Creative Industries - Consultation on Proposed Changes. Accessed 21st June 2013. Available from:
https://www.gov.uk/government/uploads/system/uploads/attachment_data/file/203296/Classif ying_and_Measuring_the_Creative_Industries_Consultation_Paper_April_2013-final.pdf
De Propris, L., Chapain, C., Cooke, P., MacNeill, S. and Mateos-Garcia, J. (2009) The geography of creativity. NESTA Working Paper, May 2009.
Duranton G. and Puga D. (2001) Nursery cities: Urban diversity, process innovation and the life cycle of products. American Economic Review, 91 (5): 1454 – 1477.
Duranton, G. and Puga, D. (2004). Micro-foundations of Urban Agglomeration Economies. In J.V. Henderson and J.F. Thisse (eds) Handbook of Regional and Urban Economics, Vol. IV, , North-Holland, Amsterdam: 2063-2117
Evans, G. (2009) Creative cities, creative spaces and urban policy. Urban Studies, 46 (5-6): 1003-1040.
Eriksson, R. and Lindgren, U. (2009) Localized mobility clusters: impacts of labour market externalities on firm performance. Journal of Economic Geography, 9 (1): 33 - 53
Fagerberg, J. (2005) Innovation: A guide to the literature. In Fagerberg, J., Mowery, D. and Nelson, R. (eds.) Oxford Handbook of Innovation. Oxford University Press, Oxford: 1-27.
Fitjar, R.D. and Rodríguez-Pose, A. (2011) Innovating in the periphery: Firms, values and innovation in southwestern Norway. European Planning Studies, 19 (4): 555 - 574.
Fitjar, R.D. and Rodríguez-Pose, A. (2011) When local interaction does not suffice: sources of firm innovation in urban Norway. Environment and Planning A, 43(6): 1248-1267.
Florida, R. (2002) The rise of the creative class, Basic Books, New York.
Florida, R. Mellander, C. and Stolarick, K. (2008) Inside the black box of regional development - human capital, the creative class and tolerance. Journal of Economic Geography, 8(5): 615 - 649.
Freel, M. and Harrison, R. (2006) Innovation and cooperation in the small firm sector. Regional Studies, 40 (4): 289-305.
Freeman, A. (2010) London's creative workforce: 2009 update. GLA Economics Working Paper. GLA, London.
Gordon, I. R. and McCann, P. (2005) Innovation, agglomeration and regional development. Journal of Economic Geography, 5 (5): 523 – 543.
Grabher, G. (2001) Ecologies of creativity: The village, the group and the heterarchic organisation of the British advertising industry. Environment and Planning A, 33: 351-274.
Grabher, G. (2002) The project ecology of Advertising: Tasks, talents and teams. Regional Studies, 36 (5): 245-262.
Hesmondalgh, D. and A. C. Pratt (2005) Cultural industries and cultural policy. International Journal of Cultural Policy, 11(1): 1-13.
Higón, D. A. and Driffield, N. 2012. Exporting and innovation performance: Analysis of the Annual Small Business Survey in the UK, International Small Business Journal, 29 (1): 4 – 24.
Huggins, R. and Clifton, N. (2011) Competitiveness, creativity and place-based development. Environment and Planning A, 43: 1341-1362.
HM Treasury (2012) “UK to get world class creative tax credits”, HM Treasury Press
Release. Available from: http://www.hm-treasury.gov.uk/press_48_12.htm [Accessed 1st Jan 2013]
Jayne, M. (2005) Creative industries: The regional dimension? Environment and Planning C: Government and Policy, 23 (4): 537 – 556.
Lancaster University (2012) London Creative and Digital Fusion.
http://www.theworkfoundation.com/Impact/London-Creative-and-Digital-Fusion [Accessed 1st January 2013]
Lee, N. (2011) Free to grow? Assessing the barriers faced by actual and potential high growth firms. NESTA Working Paper, London.
Lee, N. and Drever, E. (2012) Creative industries, occupations and innovation in London. Big Innovation Centre Working Paper, University of Lancaster.
Marlet G. and van Woerkens C. (2007) The Dutch creative class and how it fosters urban employment growth. Urban Studies, 44 (13): 2605 – 2626.
Martin, R. and Moodysson, J. (2011) Innovation in symbolic industries: The geography and organisation of knowledge sourcing. European Planning Studies, 19 (7): 1183 – 1203.
Marrocu, E. and Paci, R. (2012) Education or Creativity: What Matters Most for Economic Performance? Economic Geography. 88: 369–401.
Miles, I. and Green, L. (2008) Hidden innovation in the creative industries. National Endowment for Science, Technology and the Arts, London.
Müller, K., Rammer, C. and Trüby, J. (2009) The role of creative industries in industrial innovation. Innovation: Management, Policy & Practice, 11 (2): 148-168.
Nathan, M. and N. Lee (2011) Does cultural diversity help innovation in cities? Evidence from London's firms. Spatial Economics Research Paper Working Paper 69, LSE.
Power, D. (2002) The ‘Cultural Industries’ in Sweden: an assessment of their place in the
Swedish economy. Economic Geography, 78 (2): 103-128.
Power, D. (2010) The difference principle? Shaping competitive advantage in the cultural product industries. Geografiska Annaler: Series B, Human Geography, 92 (2): 145-158.
Pratt, A. C. (2006) Advertising and creativity, a governance approach: A case study of creative agencies in London. Environment and Planning A, 38 (10): 1883-1889.
Pratt, A. C. (2008) Creative cities: The cultural industries and the creative class. Geografiska Annaler: Series B, Human geography, 90 (2): 107-117.
Reimer, S., Pinch, S. and Sunley, P. (2008) Design spaces: Agglomeration and creativity in British design agencies. Geografiska Annaler: Series B, Human Geography, 90 (2): 151-172.
Shearmur, R. (2012) Not being there: Why local innovation is not (always) related to local factors. In Westeren, K. I. (ed.) Foundations of the knowledge economy: Innovation, learning and cities. Cheltenham, Edward Elgar: pp. 117 – 139.
Stam, E., de Jong, P. J. and Marlet, G. (2008) Creative industries in the Netherlands: Structure, development, innovativeness and effects on urban growth. Geografiska Annaler: Series B, Human Geography, 90 (2): 119-132.
Stoneman, P. (2009) Soft innovation: Towards a more complete picture of innovative change. London: National Endowment of Science, Technology and the Arts.
Sunley, P., Pinch, S., Reimer, S. and Macmillen, J. (2008) Innovation in a creative production system: The case of design. Journal of Economic Geography, 8 (5): 675-690.
Therrien, P. (2005) City and innovation: Different size, different strategy. European Planning Studies, 13 (6): 853 - 877.
Turok, I. (2003) Cities, Clusters and Creative Industries: The Case of Film and Television in Scotland. European Planning Studies, 11 (5): 549–565.
Vinodrai, T. (2006) Reproducing Toronto's design ecology: Career paths, intermediaries and local labour markets. Economic Geography, 82(3): 237-263.
Vinodrai, T. (2013) Design in a downturn? Creative work, labour market dynamics and institutions in comparative perspective. Cambridge Journal of Regions, Economy and Society. 6 (1): 159-176.
Waitt, G. and Gibson, C. (2009) Creative small cities: Rethinking the creative economy in place. Urban Studies, 46 (5-6): 1223 – 1246.
Williams M. and Cowling M. (2009) The Annual Small Business Survey 2007/9, London: Department for Business, Innovation and Skills.
Wood P. (2009) Service competitiveness and urban innovation policies in the UK:
Tables
Table 1. Creative industries
Creative Industries Industries included in this category Codes (SIC 2003)
Advertising Advertising 74.40
Architecture Architecture & Engineering 74.20
Video, Film & Photography
Reproduction of video recording; Photographic activities; Motion picture and video production; Motion picture and video distribution; Motion picture projection.
22.32, 74.81, 92.11, 92.12, 92.13
Music and the visual and performing arts
Publishing of sound recordings; Reproduction of sound recording; Artistic and literary creation and interpretation; Operation of arts facilities; Other entertainment activities not elsewhere classified; Other recreation activities not elsewhere classified.
22.14, 22.31, 92.31, 92.32, 92.34, 92.72
Publishing Publishing of books; Publishing of newspapers; Publishers of journals and periodicals; Other publishing; News agency activities.
22.11, 22.12, 22.13, 22.15, 92.40
Software, computer games and electronic publishing
Reproduction of computer media; Publishing of software; Other software consultancy and supply.
22.33, 72.21, 72.22
Radio and TV Radio and television activities. 92.20
Table 2. Definition of creative occupations
Creative Occupations
Occupations included in the category Codes (SOC 2000)
Advertising Advertising and public relations managers; Public relations officers; Marketing associate professionals
1134; 3433; 3543
Architecture Architects; Town Planners; Architectural technologists and Town Planning Technicians
2431; 2432; 3121
Crafts Glass and Ceramics makers, decorators and finishers; Furniture makers, other craft woodworkers; Pattern makers (moulds); Musical Instrument makers and tuners; Goldsmiths, Silversmiths, Precious Stone workers; Floral arrangers, Florists; Hand Craft occupations not elsewhere classified; Glass and Ceramics process operatives; Labourers in Building and Woodworking trades
5491; 5492; 5493; 5494; 5495; 5496; 5499; 8112; 9121
Design Design and development engineers; Artists; Graphic Designers; Product, Clothing and related Designers.
2126; 3411; 3421; 3422
Designer fashion
Product, clothing and related designers; Weavers and knitters 5411
Video, film & photography
Photographers and audio-visual equipment operators 3434
Music & the visual and performing arts
Authors, Writers; Actors, entertainers; Dancers and choreographers; Musicians; Arts officers, producers and directors
3412; 3413; 3414; 3415; 3416
Publishing Journalists, newspaper and periodical editors; Originators, compositors and print preparers; Printers; Bookbinders and print finisher; Screen printers
3431; 5421; 5422; 5423; 5424
Software & electronic publishing
Information and communications technology managers; IT strategy and planning professional
1136; 2131
Radio & TV Broadcasting associate professionals; TV, Video and Audio engineers
3432; 5422
Table 3. Innovation in the creative industries
Firm has introduced any new product in the past 12 months:
Firm has introduced any new process in past 12 months:
Any Original: Entirely new
Learned: New to the firm
Any Original: Entirely new
Learned: New to the firm CI Firm 47.5 20.2 27.2 26.6 4.5 22.0 Non CI
Firm
36.1 9.3 26.8 22.0 5.4 16.6
Total 37.4 10.5 26.9 22.5 5.3 17.2
Table 4. Variables and definitions
Variable Description
Creativity Creative industries Whether firm is one of the creative industries
Creative occupations (%) Percentage of employment in sector / region in creative occupations
Urban Urban Whether firm is located in an urban area or not
Creative industries * urban Interaction term – Urban creative industries = 1
Creative occupations * urban
Interaction term – Urban firm X Creative Occupation share
Firm Sole Whether firm is a sole trader
Micro firm Firm has been 1 and 9 employees
Small firm Firm has between 10 and 49 employees
Medium firm Firm has between 50 and 249 employees
PLC Whether the firm is a Public Limited Company (1 if so)
Business Plan Whether the firm has a business plan (1 if so)
Activity Exports Whether the firm exports (1 if so)
Advice Whether the firm seeks advice from external sources (1 if so)
Multiple sites Whether the firm has more than one location (1 if so)
Aims to grow Whether firm aims to grow (1 if so)
Age Age 1 -3 Age 4 – 10 Age 11 +
Set of three dummy variables for firm age which are one if a firm is aged between 1 and 3, 4-10 and 11 +, reference category is for firms less than a year old
Region Regional Dummies A set of regional dummies for the nine government office regions, Wales, Scotland and Northern Ireland.
Sector Sector Dummies Twelve sector dummies, for the following: A - Agriculture, hunting and forestry; D - Manufacturing; F - Construction; G - Wholesale and retail trade; H - Hotels and restaurants; I - Transport, storage and communication; J - Financial intermediation; K - Real estate, renting and business activities; L - Public administration and defence; M – Education; N - Health and social work; O - Other community, social and personal services. Note that the creative industries dummy is separate.
Table 5. Product innovation: Probit regression models
(1) (2) (3) (4) (5) (6) (7) (8) (9)
VARIABLES Any product innovation Original product innovation Learned product innovation
Creative Industries 0.00875 0.00427 0.0346 0.189* 0.190* 0.137 -0.123 -0.127 -0.0500 (0.0802) (0.0802) (0.115) (0.0974) (0.0974) (0.137) (0.0816) (0.0817) (0.117) Creative
Occupations (%)
0.512** 0.0212 0.513** 0.358 0.504 0.355 0.257 -0.304 0.260 (0.200) (0.335) (0.200) (0.227) (0.388) (0.227) (0.201) (0.337) (0.201)
Creative
Occupations * Urban
0.654* -0.192 0.735**
(0.354) (0.411) (0.358)
Creative Industries * Urban
-0.0353 0.0705 -0.0989
(0.112) (0.130) (0.115)
Urban -0.0110 -0.0532 -0.00836 -0.0235 -0.00972 -0.0302 0.00368 -0.0438 0.0111 (0.0312) (0.0386) (0.0324) (0.0403) (0.0503) (0.0423) (0.0316) (0.0391) (0.0328) Sole trader -0.348*** -0.348*** -0.348*** -0.00848 -0.00880 -0.00806 -0.368*** -0.368*** -0.368***
(0.0583) (0.0583) (0.0583) (0.0741) (0.0741) (0.0741) (0.0591) (0.0591) (0.0591) Micro firm -0.139*** -0.137*** -0.139*** 0.00646 0.00573 0.00649 -0.146*** -0.144*** -0.146***
(0.0480) (0.0481) (0.0480) (0.0594) (0.0594) (0.0594) (0.0479) (0.0480) (0.0479) Small firm -0.110** -0.108** -0.110** 0.0352 0.0344 0.0350 -0.126*** -0.124*** -0.125***
(0.0448) (0.0448) (0.0448) (0.0540) (0.0540) (0.0540) (0.0446) (0.0446) (0.0446) PLC -0.0221 -0.0225 -0.0221 0.115*** 0.115*** 0.115*** -0.0846*** -0.0850*** -0.0846***
(0.0312) (0.0312) (0.0312) (0.0402) (0.0402) (0.0402) (0.0316) (0.0317) (0.0316) Exports 0.434*** 0.433*** 0.434*** 0.445*** 0.445*** 0.445*** 0.161*** 0.160*** 0.161***
(0.0334) (0.0334) (0.0334) (0.0391) (0.0391) (0.0391) (0.0336) (0.0336) (0.0336) Takes Advice 0.277*** 0.276*** 0.277*** 0.126*** 0.126*** 0.125*** 0.211*** 0.210*** 0.211***
(0.0306) (0.0306) (0.0306) (0.0379) (0.0379) (0.0379) (0.0306) (0.0306) (0.0306) Multi Site 0.100*** 0.102*** 0.100*** 0.0944** 0.0939** 0.0947** 0.0480 0.0495 0.0478
(0.0358) (0.0358) (0.0358) (0.0436) (0.0436) (0.0436) (0.0360) (0.0360) (0.0360) Aims to Grow 0.384*** 0.384*** 0.384*** 0.238*** 0.238*** 0.238*** 0.298*** 0.298*** 0.299***
(0.0315) (0.0315) (0.0315) (0.0435) (0.0435) (0.0435) (0.0326) (0.0326) (0.0326) Age 1 -3 -0.0542 -0.0549 -0.0540 -0.125 -0.125 -0.125 0.00951 0.00873 0.00994 (0.0621) (0.0622) (0.0621) (0.0785) (0.0785) (0.0785) (0.0630) (0.0630) (0.0630) Age 4 – 10 -0.162*** -0.164*** -0.161*** -0.138* -0.138* -0.139* -0.0947 -0.0971 -0.0936
(0.0588) (0.0588) (0.0588) (0.0745) (0.0746) (0.0746) (0.0597) (0.0597) (0.0597) Age 11 + -0.326 -0.324 -0.325 -0.00120 -0.00135 -0.00222 -0.325 -0.323 -0.324
(0.275) (0.275) (0.275) (0.388) (0.388) (0.388) (0.292) (0.292) (0.292) Constant -0.180 -0.142 -0.183 -1.540*** -1.553*** -1.534*** -0.340*** -0.296** -0.347***
(0.118) (0.120) (0.119) (0.151) (0.154) (0.151) (0.119) (0.121) (0.119)
Sectoral Dummies YES YES YES YES YES YES YES YES YES
Regional Dummies YES YES YES YES YES YES YES YES YES
Table 6. Process innovation: Probit regression models
(1) (2) (3) (4) (5) (6) (7) (8) (9)
VARIABLES Any process innovation Original process innovation Learned process innovation
Creative Industries 0.0147 0.0140 0.139 -0.0567 -0.0554 -0.0191 0.0345 0.0332 0.160 (0.0831) (0.0831) (0.119) (0.120) (0.120) (0.176) (0.0859) (0.0860) (0.122) Creative
Occupations (%)
0.303 0.224 0.307 -0.338 -0.101 -0.337 0.462** 0.323 0.466** (0.204) (0.345) (0.204) (0.293) (0.500) (0.293) (0.209) (0.349) (0.209) Creative
Occupations * Urban
0.105 -0.311 0.183
(0.366) (0.534) (0.371)
Creative Industries * Urban
-0.168 -0.0506 -0.170
(0.116) (0.172) (0.118)
Urban 0.0265 0.0194 0.0395 0.0373 0.0591 0.0414 0.0152 0.00286 0.0285 (0.0325) (0.0404) (0.0338) (0.0488) (0.0611) (0.0508) (0.0334) (0.0415) (0.0347) Sole trader -0.672*** -0.672*** -0.673*** -0.0188 -0.0191 -0.0187 -0.720*** -0.719*** -0.720***
(0.0612) (0.0612) (0.0612) (0.0914) (0.0914) (0.0914) (0.0630) (0.0630) (0.0630) Micro firm -0.415*** -0.415*** -0.415*** -0.000429 -0.00161 -0.000239 -0.431*** -0.431*** -0.431***
(0.0485) (0.0485) (0.0485) (0.0713) (0.0713) (0.0713) (0.0490) (0.0490) (0.0490) Small firm -0.200*** -0.200*** -0.200*** 0.0406 0.0395 0.0409 -0.218*** -0.217*** -0.217***
(0.0448) (0.0448) (0.0448) (0.0638) (0.0637) (0.0638) (0.0450) (0.0450) (0.0450) PLC 0.0679** 0.0679** 0.0680** 0.123** 0.123** 0.123** 0.0315 0.0314 0.0315
(0.0324) (0.0324) (0.0324) (0.0479) (0.0479) (0.0479) (0.0334) (0.0334) (0.0334) Exports 0.185*** 0.185*** 0.185*** 0.231*** 0.232*** 0.231*** 0.0966*** 0.0963*** 0.0967***
(0.0339) (0.0339) (0.0339) (0.0471) (0.0471) (0.0471) (0.0348) (0.0348) (0.0348) Takes Advice 0.366*** 0.366*** 0.367*** 0.178*** 0.179*** 0.178*** 0.317*** 0.316*** 0.317***
(0.0309) (0.0309) (0.0309) (0.0447) (0.0446) (0.0446) (0.0314) (0.0315) (0.0315) Multi Site 0.104*** 0.105*** 0.104*** 0.122** 0.121** 0.122** 0.0635* 0.0639* 0.0632* (0.0364) (0.0364) (0.0364) (0.0514) (0.0514) (0.0514) (0.0370) (0.0370) (0.0370) Aims to Grow 0.439*** 0.439*** 0.439*** 0.218*** 0.218*** 0.218*** 0.410*** 0.410*** 0.411***
(0.0336) (0.0336) (0.0336) (0.0533) (0.0533) (0.0533) (0.0350) (0.0350) (0.0350) Age 1 -3 -0.0897 -0.0897 -0.0890 -0.0345 -0.0347 -0.0343 -0.0872 -0.0874 -0.0865
(0.0642) (0.0642) (0.0643) (0.0940) (0.0940) (0.0940) (0.0661) (0.0661) (0.0661) Age 4 – 10 -0.188*** -0.189*** -0.187*** -0.141 -0.141 -0.141 -0.150** -0.150** -0.148** (0.0611) (0.0611) (0.0612) (0.0909) (0.0910) (0.0909) (0.0626) (0.0626) (0.0626) Age 11 + -0.0645 -0.0643 -0.0612 0.256 0.256 0.257 -0.157 -0.157 -0.153
(0.298) (0.298) (0.299) (0.375) (0.375) (0.375) (0.327) (0.327) (0.327) Constant -0.438*** -0.432*** -0.451*** -1.911*** -1.929*** -1.915*** -0.520*** -0.508*** -0.533***
(0.121) (0.123) (0.121) (0.194) (0.198) (0.195) (0.123) (0.125) (0.124)
Sectoral Dummies YES YES YES YES YES YES YES YES YES
Regional Dummies YES YES YES YES YES YES YES YES YES
Table 7. London effects: Probit regression models for product and process innovation
(1) (2) (3) (4) (5) (6)
VARIABLES Any product innovation Original product innovation
Learned product innovation
Any process innovation Original process innovation
Learned process innovation
Creative Industries 0.0190 0.188* -0.109 0.0277 -0.0650 0.0517 (0.0818) (0.0992) (0.0831) (0.0845) (0.123) (0.0873) Creative Occupations 0.575*** 0.440* 0.284 0.380* -0.223 0.499** (0.216) (0.245) (0.215) (0.220) (0.311) (0.225) Creative Occupations *
London
-0.247 -0.480 -0.00277 -0.305 -0.744 -0.0383
(0.506) (0.569) (0.511) (0.517) (0.790) (0.526) Creative Industries *
London
-0.101 0.0471 -0.158 -0.118 0.144 -0.181
(0.191) (0.210) (0.196) (0.201) (0.292) (0.204) Constant -0.186 -1.548*** -0.343*** -0.446*** -1.921*** -0.525***
(0.118) (0.151) (0.119) (0.121) (0.194) (0.124)
Firm controls YES YES YES YES YES YES
Regional dummies YES YES YES YES YES YES
Sector dummies YES YES YES YES YES YES
Observations 9,158 9,154 9,158 9,154 9,141 9,154 Pseudo R2 0.0768 0.0647 0.0384 0.0987 0.0436 0.0816