Published Online March 2013 in SciRes (http://www.scirp.org/journal/psych) http://dx.doi.org/10.4236/psych.2013.43A055
Educational Program to Promote the Correlation between
Preference and Food Selection: A Replication Study
María del Refugio López-Gamiño
1, Martha Elba Alarcón-Armendáriz
1,
Assol Cortés-Moreno
2, Xóchitl Karina Torres-Beltrán
11Grupo de Investigación en Educación para la Salud y Estilos de vida, Facultad de Estudios Superiores Iztacala, Universidad Nacional Autónoma de México, Tlalnepantla, México
2Proyecto de Investigación en Aprendizaje Humano, Facultad de Estudios Superiores Iztacala, Universidad Nacional Autónoma de México, Tlalnepantla, México
Email: [email protected]
Received December 31st, 2012; revised January 29th, 2013; accepted February 25th, 2013
Some studies have demonstrated the importance of various factors involved in feeding behavior, although only a few have focused on the correlation between preference and food selection as an indicator of the needed skills to interact with the diversity of situations associated with healthy feeding. In a previous study, performed with 116 Mexican schoolchildren, some changes were observed in the correlation be- tween preference and selection food, in order to more accurately assess the modified dimensions of feed- ing behavior, the study was repeated on a different sample. The study allowed us to test a food education strategy designed to promote four levels of behavioral complexity and their effect on preference and food selection in a group of schoolchildren. Participants were 298 schoolchildren (141 boys and 157 girls) 6 - 13 years old who were second, fourth or sixth grades and who were assigned to four intervention pro- grams: noninstrumental situational, instrumental situational, extrasituational and transituational. The ac- tivities were designed according to the behavioral complexity level. At the start of the intervention, each participant’s anthropometric measurements were recorded and natural and industrialized food preference and selection was evaluated at the beginning, at the end and one month after the intervention (pre, post and follow-up).There were some changes in the children’s behavior of preference and selection, particu- larly in fourth grade. This underscores the importance of designing educational strategies which promote the acquisition of knowledge, the development of attitudes towards healthy eating and, above all, effective and constant practice.
Keywords: Behavioral Intervention; Nutritional Education; Health Psychology; Schoolchildren; Food Preferences
Introduction
Dietary habits are reflected in the health of populations. The frequent consumption of a proper diet promotes health while the frequent consumption of a wrong diet alters it. Malnutrition, overweight and obesity are clear signals of deficits or food excesses related to wrong food habits, widely linked to a num- ber of diseases (García-Solís & Aceves, 2005). Dietary habits are the concrete expression of a number of socio-economic, cul- tural circumstances and also the concrete expression of the pe- culiar skills which individuals have, manifesting in the feeding behavior of each person, ranging from the selection and prepa-ration of products to the intake in certain combinations and quantities (Reinaerts, De Nooijer, Candel, & De Vries, 2007).
From the combination of the various factors that affect eating behavior, since childhood we learn to accept or reject certain foods. Consumption preferences are determined by early ex- periences such as the association of food with certain socials contexts, aversive or pleasant consequences when eating, the repeated presence of new foods, consumption patterns of the parents, internal signals (satiety) and external (environmental “demands”) and availability (Bourges, 1994; Birch, 1998).
Particularly social changes of recent decades have had an impact on the ways in which families are fed and therefore on
their eating habits, for instance, the fact that some mothers work outside the home results in the reduction of available time for the preparation of food with the consequent rapid increase in consumption of fast food whose salt content, fat and carbo- hydrates is higher than that a regular diet prepared at home can contain. The social value that publicity given to certain easily accessible products (especially for schoolchildren) such as chips and sweets, alters the balance that must exist in nutrient intake to maintain an adequate diet.
Food problems in the Mexican population, coupled with their hereditary characteristics, have resulted in a polarized popula- tion suffering from malnutrition in addition to overweight and obesity. These problems have worsened in recent decades both among schoolchildren and adults (Toussaint, 2000; Ramírez, García, Cervantes, Mata, Zárate, Mason, & Villarreal, 2003; Shama-Levy, 2010). The facts are alarming because a signifi- cant percentage of the population is, from a very early age, at risk for chronic non communicable diseases such as diabetes and hypertension, among others.
char-acteristic of populations with overweight and obesity problems. (Seaman, Woods, & Grosset, 1997; Evans, Sawyer, & Betsin- ger, 2000; Ward, Hoelscher, & Briley, 2002). What children prefer to consume has also been assessed, and it has been found that, for example, children under 12 have a high intake of sug- ary drinks, chips and fatty foods (Douglas, 1998).
If consumption patterns are part of the formation of prefer-ences, then it is important to facilitate situations where it is more likely to consume the necessary foods and not just those individuals most like (Douglas, 1998). This requires that people have information on how to develop a proper diet; however, that knowledge alone is not enough. It is also required to de- velop and maintain feeding behaviors compatible with a healthy diet. Health education, according to the World Health Organi- zation (WHO, 1998) is an alternative of intervention not only to provide information but also to contribute to the creation or modification of habits in any population.
Dodds, Benedict, Leontos and Krelle (1998) agree that edu- cation is an alternative to increase the consumption of fruits and vegetables, which are very important foods in any diet but which are not enough consumed. They implemented a program in elementary schools to increase knowledge, to improve atti- tudes and to promote the consumption of fruits and vegetables using a combination of educational methods to influence a be- havior change, from the social learning theory. They found that, schoolchildren attitudes regarding the acceptance to eat these foods, improved significantly, as well as their perception re- garding their ability to eat five fruits and vegetables a day. Be- fore the intervention, the schoolchildren showed a high level of knowledge about the benefits of eating fruits and vegetables but they would not carry it into practice. Although the program improved attitudes and perception, these authors point out that it was not possible to measure objective changes in the behavior of interest.
The specific interventions in health education come from various theoretical models arising from some disciplines such as psychology, sociology, anthropology, and marketing. The interventions are often community, interpersonal and individual (Pardío & Plazas, 1998). The models most commonly used are the Bandura’s Social Cognitive Theory and Prochaska’s Stages of Changes, along with that of Action-Research. For this work purposes, the health model proposed by Ribes (1990) has been taken. This model was also used by Cortés , López, Alarcón and Torres (2009) in a Mexican population. The proposal claims that the state of health or disease is maintained by indi- vidual’s behavior, which performs particular competences and styles to interact within certain situations. The competences
may be available into four different levels of complexity, which results in the know how to do types: what, how, why, and what other actions can be carried out under the present circumstances. The level of behavioral complexity depends on the nature and degree of participation in Linguistic Conventions.
The authors designed an educational program for each of the four levels of complexity: 1) Situational non-instrumental: it is the least complex, the individual only interacts with the situa- tion without altering the properties of the events (objects, peo- ple or happenings) that regulate his behavior; 2) Instrumental Situation: at this level, the individual interacts with the situation, changing only the immediate context. His responses are effec-tive to alter the relationship with his environment; 3) Extra-situational: at this third level, the interaction is modulated by linguistic behavior because the individual responds depending on his experience, to circumstances with non-explicit properties in the current situation; it means that he acts, before a particular situation, “as if” he had some characteristics of other situation that is present; 4) Transituational: this level is more complex. In it, the individual can abstract generic situations in not present and not momentary situations through his linguistic behavior, and thus, he faces the situations depending on how he concep- tualizes them. Table 1 shows an example of the type of pur-poses and activities that led the intervention.
While the previous application of this model showed that it affected mainly the preference for natural products and to a lesser extent the selection (Cortés et al., 2009), it was considered as relevant to replicate it with another school sample to more ac-curately assess the dimensions of the modifying eating behavior.
Method
Participants
We worked with 298 elementary schoolchildren; boys and girls aged between 6 and 13 years old, attending a public ele- mentary school in Mexico City: 106 second grade, 99 fourth grade and 93 sixth grade. Students were divided into 12 groups, four per grade, which at the time of the intervention were al- ready constituted, so that it was possible to assign one group for each grade and program. Parents accepted their children to participate in the study and signed an informed consent.
Materials
Workbooks on food information (specifically designed for in-tervention by the researchers) were used. Each workbook with a different level of functional complexity: noninstrumental
Table 1.
Example of purposes and activities that guided the food education program.
Program Purpose of the activity Example
Noninstrumental Situational Name concepts. Name three foods containing mainly calcium.
Instrumental Situational Select foods acording to the nutrients they contain. Select, from a group of different foods, those containig more calcium.
Extrasituational Establish effectiveness criteria in the situation, from previous experiences recovery. Analize if food eaten the prior day meets the recommendations of a proper diet.
Transituational Master rules. Develop a scheme to recover the function and utility of Dietary Guidelines.
[image:2.595.56.532.614.732.2]situational, instrumental situational, extrasituational and tran-situational. The issues were the same in all workbooks, but the activities varied depending on the level of functional complex-ity. The issues were the same in all workbooks, but the activi-ties varied depending on the level of functional complexity.
Procedure
Anthropometric measurements of age, weight and height were taken to all children to get their nutritional status from tables of the NCHS (National Center for Health Statistics.) Once the students were assigned to one of the four programs (noninstrumental situational, instrumental situational, extra-situational or tranextra-situational), they were given a food education course with the same content, but the activities in the work-books were according to the level of complexity required for each program. We also evaluated the preference and selection of natural and industrialized foods.
Preference assessment and selection of food products were conducted individually for three periods or phases: before the intervention (pre), at the end of it (post) and one month after the post-test (follow-up). Each phase consisted of three consecutive days. Each child was presented with five natural and five in-dustrialized food displayed randomly on a table, and then they were asked to hierarchize them according to their preference, placing first the most liked and finally the least liked. Once the products were ordered, schoolchildren were asked to select one of them for consumption and we handed in at that moment.
Results
Nutritional Status
About 50% of the children had a normal weight according to the standards applied by the NCHS. The rest was distributed among underweight, overweight and obesity. As seen in Table 2 the distribution in these three categories was fairly homoge- neous in the groups we worked with. We should highlight that
[image:3.595.97.498.515.586.2]about 30% of the schoolchildren fall into the category of over-weight and obesity.
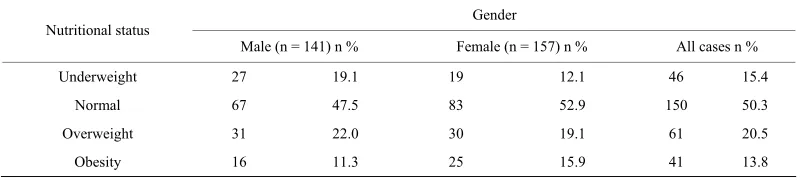
Table 3 shows the nutritional status of children considering gender. We found that, compared to girls, a greater number of boys was underweight or overweight, while more girls were obese. The differences were not significant. According to the test JI2 (2 × 4) applied: X2(3, n = 298) = 4.22,
p > 0.05.
Preference and Food Selection
Table 4 shows the percentages of preference and food selec-tion (natural and industrialized) for educaselec-tional program and school grade in the three times of the assessment (pre-test, post-test and follow-up). In general, it is observed that children say they most prefer natural foods, although they mainly select industrialized ones. Next we analyze the differences according to grade and educational program.
Preference/Selection in Second Grad
e
The four groups showed differences in preference patterns and food selection before the intervention (see Table 4) al-though it can be seen that in three of them, children say they prefer more natural products. In all cases, they select them less for consumption. In instrumental situational and extrasitua-tional programs, the selection of natural products remains in a higher level than that of industrialized ones, but always below what they say they prefer (see Figures 1-4).
Noninstrumental Situational Program (Second Grade) Before the intervention, almost twice the number of children who participated in this program said they preferred natural products above the industrialized ones, but they chose in the same proportion the industrialized ones. During the post-test and the follow-up, the preference for natural products increased (see Table 4), which was reflected in a greater selection of natural products, that rose from 33.3% in the pre-test to 50% in the follow-up (Figure 1).
Table 2.
Percentage of participants according to nutritional status and intervention program.
Program/Nutritional Status Underweight Normal Overweight Obesity
NoninstrumentalSituational 20 48 17 15
Instrumental situational 14 48 18 20
Extrasituational 13 59 17 11
Transsituational 15 47 29 9
Note: Data from anthropometric measurements.
Table 3.
Participants according to nutritional status and gender.
Gender Nutritional status
Male (n = 141) n % Female (n = 157) n % All cases n %
Underweight 27 19.1 19 12.1 46 15.4
Normal 67 47.5 83 52.9 150 50.3
Overweight 31 22.0 30 19.1 61 20.5
Obesity 16 11.3 25 15.9 41 13.8
[image:3.595.98.498.633.723.2]Instrumental Situational Program (Second Grade)
Students who received this educational program showed be-fore the intervention, similar preference patterns to noninstru-mental situational program between natural and industrialized food, although the selection was the same for both types of products. In the post test there was an increase in the preference and selection of natural products, and therefore they less pre-ferred and less select industrialized foods (see Table 4). During the follow-up, the observed effects in the post-test were re-versed observed to a level similar to that of the initial assess-ment, however, the preference for natural products remained at the level reached during the post-test (see Figure 2).
Extrasituational Program (Second Grade)
In the initial evaluation of this group, as in the previous group, the most preferred products, and also the least selected ones are natural products. The preference and selection of natu- ral products remain above industrialized ones in three phases. In the case of selection, a phase by phase steady increase of na- tural products can be observed. After the intervention, the pref- erence for natural foods decreases slightly, but its selection in- creases. This effect will be maintained during the follow-up (see Table 4 and Figure 3).
Transituational Program (Second Grade)
As shown in Table 4 and Figure 4, this group of students showed equal preference for both types of products in the pre-test. After the intervention the selection and preference for natural products improved slightly. This situation was reversed
during the follow-up.
Preference/Selection in Fourth Grade
The four groups of this grade showed in the pre-test very similar patterns of preference and selection for both types of products. Like their second grade schoolmates, they chose with a higher proportion industrialized foods, although there are differences between the various educational programs (Table 4 and Figures 5-8).
Noninstrumental Situational Program (Fourth Grade) This schoolchildren group shows in the initial evaluation the biggest preference for natural foods of all groups and grades (95.06%), as well as a high percentage of selection of the same foods. As shown in Table 4 and Figure 5, during post evalua-tion, preference decreases slightly (about 8%), while the selec-tion is reduced by almost 30%. In the follow-up, besides the constant diminution of the selection of natural products, the preference is also restricted, which causes preference and selec-tion percentages to reverse between the initial test and the fol-low-up monitoring.
Instrumental Situational Program (Fourth Grade)
In the initial assessment the fourth graders, who participated in the Instrumental Situational program, most preferred and most selected natural products than they did in the two subse-quent phases, however, the difference between preference (87.21%) and selection (67.06%) is high. Upon finishing the intervention, the preference for natural products is reduced by
Table 4.
Preference/Choice pretest, posttest and follow up, in percentage.
Grade Noninstrumental Situational Instrumental situational Extrasituational Transituational
Phase Nat Ind Nat Ind Nat Ind Nat Ind
Pre 61.54 38.46 61.25 38.75 73.33 26.67 48.81 51.19
Post 69.23 30.77 75.31 24.69 69.33 30.67 53.01 46.99
Preference
Follow up 71.79 28.21 78.21 21.79 70.27 29.73 46.43 53.57
Pre 33.33 66.67 51.21 48.75 52.00 48.00 35.71 64.29
Post 39.74 60.26 66.67 33.33 57.33 42.67 40.96 59.04
Second
Selection
Follow up 50.00 50.00 51.28 48.72 62.16 37.84 36.90 63.10
Pre 95.06 4.94 87.21 12.79 90.91 9.09 86.89 13.11
Post 87.65 12.35 62.07 37.93 96.97 3.03 74.60 25.40
Preference
Follow up 67.90 32.10 77.01 22.99 84.15 15.15 70.97 29.09
Pre 69.14 30.86 67.06 32.94 75.76 24.24 67.80 32.20
Post 44.44 55.56 52.87 47.13 74.24 25.76 55.56 44.44
Fourth
Selection
Follow up 35.80 64.20 54.02 45.98 54.55 45.45 54.84 45.16
Pre 76.92 23.08 89.83 10.17 76.00 24.00 85.90 14.10
Post 78.79 21.21 81.36 18.64 53.33 46.67 84.62 15.38
Preference
Follow up 79.69 20.31 73.33 26.67 45.33 54.67 71.43 28.57
Pre 53.85 46.15 76.27 23.73 45.95 54.05 61.54 38.46
Post 57.38 42.42 57.63 42.37 39.19 68.81 56.41 43.59
Sixth
Selection
Follow up 66.67 33.33 56.67 43.33 41.33 58.67 41.56 58.44
Figure 1.
Preference and selection. Situational no instrumental program (second grade).
Figure 2.
Preference and selection. Instrumental situational program (second grade).
Figure 3.
Preference and selection. Extresituational program (second grade).
Figure 4.
Preference and selection. Transituational program (second grade).
Figure 5.
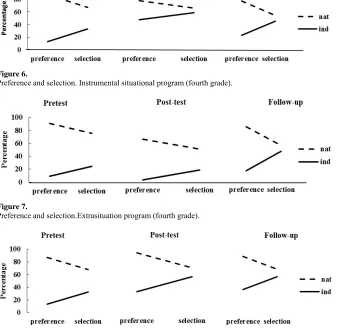
[image:5.595.129.469.66.728.2] [image:5.595.129.471.83.343.2] [image:5.595.128.472.456.716.2]Figure 6.
Preference and selection. Instrumental situational program (fourth grade).
Figure 7.
Preference and selection.Extrasituation program (fourth grade).
Figure 8.
Preference and selection. Transituational program (fourth grade).
25%, as well as the selection which is reduced by 14% (see Table 4 and Figure 6). During follow-up, preference levels for natural products recover up to 77%, however, children choose natural products only in 54% of all cases.
Extrasituational Program (Fourth Grade)
The results observed in the initial test show that schoolchil-dren chose, at a rate of 3 to 1, more natural products that indus-trialized ones. This level remains the same in the post-test, and we can also observe a slight increase in the preference for these products. During the follow up there was a decrease in the choice of natural products, with the consequent increase in the choice of industrial products (see Figure 7).
Transituational Program (Fourth Grade)
Figure 8 shows a steady decline in natural food preference, between the initial test and the follow-up (86.89%, 74.60% and 70.97% respectively). The same effect is observed in the selec-tion of natural products, which went down from 67.80% in the pre-test, to 54.84% in the follow up.
Preference/Selection (Sixth Grade)
Preference/selection patterns that these grade schoolchildren showed during the pretest were similar to those of their school-
mates from other grades. They generally most prefer natural products, but at the same time they selected them less, and in reverse, they claim not to prefer very much industrialized products but they most often select them.
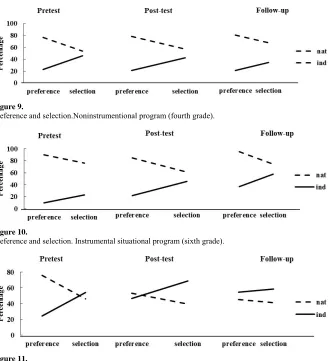
Nonsituational Instrumental Program (Sixth Grade) In this group we can observe, in the post test, a slight in-crease in the selection of natural products, which expands slightly during the follow-up; although the preference for this type of products remains unchanged among the three phases of evaluation. In contrast, industrialized product selection de-creases phase to phase (Figure 9).
Instrumental Situational Program (Sixth Grade)
In this group, unlike the Noninstrumental Situational pro-gram group, a decrease in the preference for natural products is observed from phase to phase, although regarding the selection of natural products, there is a decrease from 76.27% in the pre-test to 57.63% in the post-test. No differences in the fol-low-up (Figure 10).
Extrasituational Program (Sixth Grade)
[image:6.595.133.464.83.181.2] [image:6.595.132.469.116.446.2]com-pared to the percentages obtained in the pre-test was reflected in the preference increase for industrialized products. In the follow-up, we can observe how both preference and selection of the two types of products are stabilized within about 50% ( Fig-ure 11).
Transituational Program (Sixth Grade)
This group, like the first two groups, shows a bigger prefer-ence for natural products, but a lesser selection of them. After the intervention no changes in either behavior were observed (see Figure 12), but in the follow-up we do observe a decrease, mainly in natural product selection
Differences between Preference and Selection
To determine whether the observed differences between phases for the preference and selection according to type prod- uct, degree and educational program, were significant, we ap-plied a Student’s t-test for related samples, the results are shown in Tables 5 and 6 respectively.
As for the preference (Table 5) of natural food products, it can be seen that, in the noninstrumental situational program there was only significant difference in fourth grade between the post-test and the follow up; in the instrumental situational program there was a difference in the second grade between pre and post-test and between the post-test and the follow-up; in the
extrasituational program in the fourth grade between the post- test and the follow up; and finally in sixth grade between the pre and the post-test.
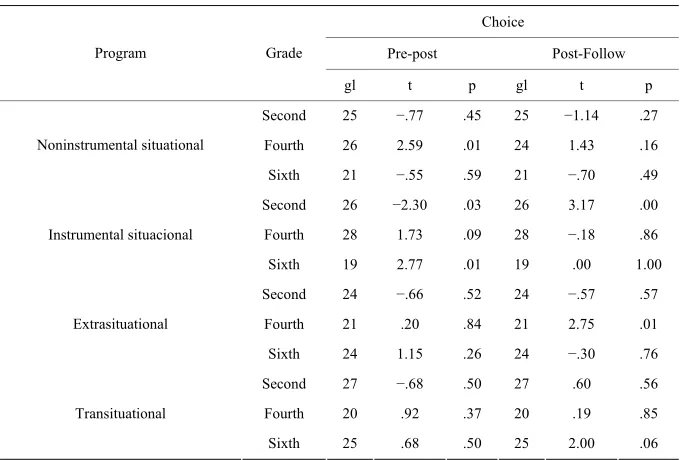
Table 6 shows the results in the selection of natural products. Significant differences were found in the noninstrumental situ-ational program with fourth grades from pre to post-test; in the instrumental situational program, the differences were found in second grades from the pre to the post-test and from the post- test to the follow up and with sixth graders from the pre to the post-test, in the extrasituational program there were significant differences with fourth graders from the post-test to the follow- up the post-evaluation
Discussion
Children in this study reported more preference for natural foods, but selected industrialized ones; this is consistent with the study conducted by Cortés, et al. (2009) who found that individuals show differences in the same direction between preference and selection of natural and industrialized products.
Furthermore, Dittuss, Hillers and Beerman (1995) demon-strated the value of nutritional education in a work aimed to observe changes in the attitudes about the nutritional benefits and the attributes of fruits and vegetables for cancer prevention, as well the perceived obstacles in the consumption of these. They concluded that nutritional education interventions are
Figure 9.
[image:7.595.136.464.361.722.2]Preference and selection.Noninstrumentional program (fourth grade).
Figure 10.
Preference and selection. Instrumental situational program (sixth grade).
Figure 11.
[image:7.595.131.464.377.544.2]Figure 12.
Preference and selection. Transituational program (sixth grade).
Table 5.
Natural food preference by grade and program across measures.
Preference
Pre-post Post-follow-up Program Grade
gl t p gl t p
Second 25 −.86 .40 25 −.28 .78
Fourth 26 1.54 .14 26 3.05 .00
Noninstrumental Situational
Sixth 21 −.44 .66 21 .29 .77
Second 26 −2.28 .03 26 .00 1.00
Fourth 28 4.06 .00 28 −2.22 .03
Instrumental situational
Sixth 19 1.56 .13 19 .75 .46
Second 24 .46 .65 24 .00 1.00
Fourth 21 −1.45 .16 21 2.16 .04
Extrasituational
Sixth 24 3.18 .00 24 .84 .41
Second 27 −.59 .56 27 .96 .34
Fourth 20 1.37 .19 20 .64 .53
Transituational
Sixth 25 .21 .83 25 1.88 .07
Note: Pre-post = pretest-post-test, Post-follow-up = post-test-follow up.
Table 6.
Natural food selection by grade and program across measures.
Choice
Pre-post Post-Follow
Program Grade
gl t p gl t p
Second 25 −.77 .45 25 −1.14 .27
Fourth 26 2.59 .01 24 1.43 .16 Noninstrumental situational
Sixth 21 −.55 .59 21 −.70 .49
Second 26 −2.30 .03 26 3.17 .00
Fourth 28 1.73 .09 28 −.18 .86 Instrumental situacional
Sixth 19 2.77 .01 19 .00 1.00
Second 24 −.66 .52 24 −.57 .57
Fourth 21 .20 .84 21 2.75 .01 Extrasituational
Sixth 24 1.15 .26 24 −.30 .76
Second 27 −.68 .50 27 .60 .56
Fourth 20 .92 .37 20 .19 .85
Transituational
Sixth 25 .68 .50 25 2.00 .06
[image:8.595.129.469.233.451.2] [image:8.595.128.472.493.723.2]useful. These interventions also contribute to make a significant impact on the healthy food behaviors, first because they pro-mote dietary changes, such as the increase of consumption of fruits and vegetables; and secondly, they can also be used to promote the identification of barriers to healthy behavior and the alternatives to change it.
In this research, the differences in the preference and selec-tion of non-instrumental situaselec-tional programs in all grades, and extrasituational particularly in fourth and sixth grades, suggest a possible effect of the educational program, in terms of pref-erence and selection of natural foods. These effects were ob-served in the levels of complexity that require more skills re-lated to the information that the construction of knowledge, which could be related to the skill level that children would have at the time of application and the level of skills required in the activities of the programs.
It is evident that food education plays an important role in the acquisition of healthy eating habits, and the modification harmful ones. Shamah and Vázquez (1998) argue that for a behavior to become a habit, it is necessary to repeat it very often. From different theoretical perspectives in psychology, repetition is a fundamental element: for Piaget (1987), experi-ence is the result of the repeated action with objects. Such ex-perience becomes a habit that is part of a repertoire that will incorporate new actions which in turn will be the basis to face new experiences. For Vygotsky (1979), the child becomes an expert after performing an activity repeatedly, first with the help of an adult and then by himself. From the behavioral per-spective, the increase in the frequency of a behavior indicates that there was some learning. This increase is mediated by the reinforcement (Skinner, 1979). For Ribes (1990) interactive styles are consistent ways of behaving functionally in certain situations and these are shaped in the psychological develop-ment process. When acting consistently, the individual is form-ing his idiosyncratic interactive history, which is a critical fac-tor for the modulation of their own health or disease.
The feeding behavior can be changed with the acquisition of knowledge and the development of new attitudes, but mostly through practice. Shamah and Vázquez (1998) add that the school is an ideal setting for learning that can serve for the suc- cessful application of health programs in general and nutritional programs in particular. The favorable results, regarding the preference and selection of natural foods which are observed in some participants in this study, are an indicator of what can be achieved with the work with schoolchildren, but we must take into account the characteristics of the population to adjust pro-grams and thus, to get better results.
REFERENCES
Birch, L. (1980). Effects of peers models food choice and eating be- havior on preschoolers food preferences. Child Development, 51, 489-496.
Birch, L. (1998). Psychological influences on the childhood diet. The
Journal of Nutrition, 128, 407S-410S.
Bourges, R. H. (1994). Evolución de la alimentación humana. Cuader-nos de Nutrición, 17, 21-28.
Chávez, A., & Chávez, M. (1995). La nueva alimentación. Pax: Méx- ico.
Cortés, M. A., López, G. R., Alarcón, A. M., & Torres, B. X. (2009). Behavioral strategy on nutritional education. Journal on Behavior, Health & Social Issues, 1, 29-36.
Dittuss, K. L., Hillers, V. N., & Beerman, K. A. (1995). Benefits and barriers to fruit and vegetable intake: relationship between attitudes and consumption. Journal of Nutrition Education, 27, 120-126. doi:10.1016/S0022-3182(12)80802-8
Dodds, S. M., Benedict, J., Leontos, C., & Krelle-Zepponi, N. (1998). Increasing fruit and vegetable consumption among middle school students: Implementing the 5-a-day program. Journal of Extension, 36.
http://www.joe.org/joe/1998august/a4.php
Douglas, L. (1998). Children’s food choice. Nutrition & Food Science, 1, 14-18. doi:10.1108/00346659810196273
Evans, A. E., Sawyer-Morse, M. K., & Betsinger, A. (2000). Fruit and vegetable consumption among Mexican-American college students.
Journal of the American Dietetic Association, 100, 1399-1402.
doi:10.1016/S0002-8223(00)00388-6
García-Solís, P., & Aceves, C. (2005). Estudio de los factores nutri-cionales asociados a la prevención de cáncer mamario. Importancia de los modelos animales. Archivos Latinoamericanos de Nutrición, 55, 211-225.
López, G. R., Alarcón, A. M., & Gómez, P. R. (1994). Patrones de preferencia selección alimentaria en niños de 8 y 9 años de edad.
Re-vista Cubana de Nutrición, 8, 28-32.
Olaiz-Fernández, G., Rivera-Dommarco, J., Shamah-Levy, T., Rojas, R., Villalpando-Hernández, S., Hernández-Ávila. M., & Sepúlveda- Amor, J. (2006). Encuesta Nacional de Salud y Nutrición 2006. Cuernavaca: Instituto Nacional de Salud Pública.
Olivares, S., Snel, J., MacGrann, M., & Glasauer, P. (1998). Educación en nutrición en las escuelas primarias. Alimentación, Nutrición y Ag- ricultura,22, 57-62.
Pardío, J., & Plazas, M. (1998). Modelos para el cambio de conducta.
Cuadernos de Nutrición, 21, 58-64.
Piaget, J. (1987). Psicología de la inteligencia. Buenos Aires: Editorial Psique.
Ramírez, M. J., García, C. M., Cervantes, B. R., Mata, R. N., Zárate, M. F., Mason, C. T., & Villarreal, E. A. (2003). Transición alimentaria en México. Anales de Pediatría, 58, 568-573. doi:10.1157/13048089 Reinaerts, E., De Nooijer, J., Candel, M., & De Vries, N. (2007). Ex-
plaining schoool children’s fruit and vegetable consumption: The contributions of availability, exposure, parental consumption and ha- bit in addition to psychosocial factors. Appetite, 48, 248-258 doi:10.1016/j.appet.2006.09.007
Ribes, I. E. (1990). Psicología y Salud: Un análisis conceptual. México: Trillas.
Seaman, C., Woods, M., & Grosset, E. (1997). Attitudes to healthy eating among Scottish school children. Health Education, 1, 19-22. Shamah-Levy, T. (2010) Encuesta Nacional de Salud en Escolares
2008. Cuernavaca: Instituto Nacional de Salud Pública (MX). Shamah-Levy, T., & Vázquez-Resenos, C. (1998). Evaluación del im-
pacto de la orientación alimentaria en escolares a través de la vigi- lancia nutricional. Boletín Médico del Hospital Infantil de México, 55, 314-322.
Skinner, B. F. (1979). Contingencias de reforzamiento. México: Trillas. Toussaint, M. G. (2000). Patrones de dieta y actividad física en la
pa-togénesis de la obesidad en el escolar urbano. Boletín Médico del
Hospital Infantil de México, 57, 650-661.
Ward, J., L., Hoelscher, D., M., & Briley, M. E. (2002). Food choices of third-grade children in Texas. Journal of the American Dietetic
Association, 102, 409-412. doi:10.1016/S0002-8223(02)90095-7
Vigotsky (1979). El desarrollo de los procesos psicológicos superiores. Barcelona: Grijalbo.
World Health Organization (1998). Health promotion glossary. Geneva: WHO .