Personalised, Multi-modal, Affective State
Detection for Hybrid Brain-Computer Music
Interfacing
Ian Daly, Duncan Williams, Asad Malik, James Weaver, Alexis Kirke, Faustina Hwang, Eduardo Miranda,
and Slawomir J. Nasuto
Abstract—Brain-computer music interfaces (BCMIs) may be used to modulate affective states, with applications in music therapy, composition, and entertainment. However, for such systems to work they need to be able to reliably detect their user’s current affective state.
We present a method for personalised affective state detection for use in BCMI. We compare it to a population-based detection method
trained on 17 users and demonstrate that personalised affective state detection is significantly (p <0.01) more accurate, with average
improvements in accuracy of 10.2 % for valence and 9.3 % for arousal. We also compare a hybrid BCMI (a BCMI that combines physiological signals with neurological signals) to a conventional BCMI design (one based upon the use of only EEG features) and
demonstrate that the hybrid design results in a significant (p <0.01) 6.2 % improvement in performance for arousal classification and a
significant (p <0.01) 5.9 % improvement for valence classification.
Index Terms—EEG, GSR, Affective state detection, BCMI, Personalised affective state detection.
F
1
I
NTRODUCTIONB
RAIN-COMPUTER music interfaces (BCMIs) provide a mechanism for their users to interact with music di-rectly via brain activity, without the need for movement [1]. BCMIs have a number of potential applications, including entertainment and creative expression [2]. They have also been suggested for use in music therapy as they provide an alternative method for individuals to express themselves emotionally [3].Music therapy is a psychological therapy technique which aims to facilitate communication between patient and therapist, and to ultimately improve the emotional state of the patient via musical interaction with the therapist [4]. This represents the intentional use of an arts discipline to effect therapeutic change, rather than solely for the purpose of an artistic experience [5]. In this context, the music becomes a means to an end; there is a shift of focus from production to process, which includes amongst other things, the music-making and the interaction between the client and therapist as a source of various therapeutic interven-tions. Practices include music improvisation, song-writing, and guided imagery with music. There are two schools of thought regarding the communication process: expres-sionist/referential approaches, whereby the meaning in the • I. Daly is with the Brain-computer interfaces and Neural Engineering laboratory, School of Computer Science and Electronc Enginerring, Uni-versity of Essex, Wivenhoe Park, Colchester, Essex CO4 3SQ, United Kingdom
E-mail: [email protected]
• A. Malik, J. Weaver, F. Hwang, and S.J. Nasuto are with the Brain Embodiment Lab, School of Systems Engineering, University of Reading, Reading, RG6 6AY, UK.
• D. Williams, A. Kirke and E. Miranda are with the Interdisciplinary Centre for Music Research, University of Plymouth, Plymouth, Devon, PL8 4AA, UK.
Manuscript received ; revised .
music creation process may express or refer to something non-musical (this sound reminds me of when I climbed Mount Kilimanjaro), and absolutist/formalist approaches, where the meaning is solely contained and communicated by the musical form [6].
In either of these approaches, the patient might, for example, perform in duet or in response to the music of the therapist. A BCMI could work in this context by facilitating patients who are not musically confident or otherwise competent enough (for example due to physical disability) to engage in these music-making processes via traditional methods. Music has been described as the lan-guage of emotion and the possibility of offering emotional expression without significant training by means of BCMI explored in [7], for example when working with sufferers of Alexithymia (a trait which can cause a deficiency in the ability to verbally express emotions) [8], [9], as engaging in music creation might offer one way in which individuals with such difficulties might be able to express themselves [10], [11].
A related area of research is the use of sonification to translate an individual’s physiological signals into music. For example, in [12] methods are reported for translating EEG activity into music, while in [13] a combination of EEG and functional magnetic resonance imaging (fMRI) is used to achieve a similar effect.
We extend this idea and present a BCMI designed for use in music therapy applications as an affective state mod-ulation tool. This BCMI aims to both detect and provide a mechanism to assist users in modulating their own affective state. As such it aims to provide a method for allowing musical communication within a music therapy context.
In order for this BCMI design to work it is vital to have an accurate method for detecting affective states. We have
recently developed a method to detect a user’s affective states, while they listen to music, by classifying EEG derived features [3].
It has been demonstrated that it is possible to recognise emotions from the EEG via a variety of techniques [14], [15], [16], and that this may be done in real-time for use in music-therapy [17]. It has also been demonstrated that it is possible to recognise emotions from the EEG during music listening tasks [18] and from a combination of EEG and acoustic features [19], [20]. However, these approaches use a population based classification approach, in which the same classification model is applied to all the study participants.
Emotional responses to stimuli such as music are also known to involve a wide range of different physiological processes affecting the heart, the central nervous system, and other related processes, such as respiration [21], [22]. It has been demonstrated that such physiological signals may be used to recognise emotions [23]. Thus, in order to best understand and accurately detect changes in affective states it is also important to integrate these different physiological processes into an affective state detection system.
Additionally, it has been shown that a combination of EEG and other physiological signals may be used to iden-tify an individual’s affective state when visual stimuli or combinations of visual and auditory stimuli are used [24], [25], [26], [27]. However, neurological responses to affective stimuli differ according to the modality of the stimuli [28], so affective state detection methods designed for visual stimuli may not work as well for musical stimuli. Specifically, the combination of visual and audio stimuli are likely to show synergistic effects, which makes detection of affective states a fundamentally different problem.
Furthermore, it is well-known that individuals can each respond to the same emotional stimulus in very different ways depending on factors such as their gender [29] and age [30]. Furthermore, physiological signals such as the EEG are subject to a very large amount of inter-participant variability [31] and non-stationarity [32]. Thus, we suggest that such population-based approaches are not optimal for identifying an individual’s emotional response to music or other stimuli.
Therefore, we seek to develop a high performance af-fective state detection system as part of a hybrid BCMI (hBCMI) design, an extension of a conventional BCI [33], which incorporates both EEG features and other physiolog-ical features [34]. Additionally, we investigate personalisa-tion of this affective state detecpersonalisa-tion system. We train the method on a per-participant basis and compare the resulting classification accuracies to those that may be achieved when individual participant differences are not considered by the affective state detection system. Specifically, we compare per participant classification accuracies to those achieved when cross-participant training is used.
We make two hypotheses: first, the accuracy with which we can detect affective states, while users of a BCI system listen to music, will increase when we integrate a range of physiological processes; second, because the neural and physiological markers of these affective states are specific to each participant’s felt response to music, the affective state detection system will be more accurate when it is personalised to the individual.
2
M
ETHODS2.1 hBCMI design
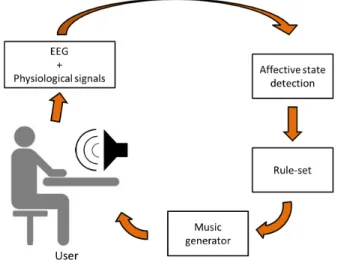
The proposed hBCMI design comprises four key stages. First, EEG and other physiological signals are recorded from the user. Second, the BCMI attempts to detect the user’s current affective state from these signals. Third, a rule-set is used to determine how best to move the user from their current affective state to a new target affective state. Finally, a music generator is used to play music corresponding to the rule-set to achieve the goals of the BCMI system (modulation of the user’s affective state).
This hBCMI system is illustrated in figure 1 and is more fully described elsewhere [35].
Fig. 1. Schematic of the proposed hBCMI system for use in affective state modulation.
2.2 Experiments
In order to train and test the proposed affective state detec-tion system, a set of experiments were conducted as a part of a larger study seeking to develop and test the hBCMI. This study consisted of multiple sessions, with each participant asked to attend five sessions, spread over a period of about five months.
There were three types of sessions in the experiment: (1) a single calibration session, (2) three training sessions, and (3) a single testing session. This is illustrated in figure 2.
The calibration session was designed to identify neural and physiological correlates of emotional responses to mu-sic, while subsequent runs were used to identify trajectories for moving between affective states. The details of the complete study are described elsewhere [36], along with a comprehensive discussion of details such as referencing schemes. In this present study we analyse the data obtained during the calibration session to determine whether person-alised classification methods for each participant provide better results than generic classifiers for all participants.
The calibration session consisted of five runs, while each training session contained four runs. Each run contained eighteen trials. A single trial contained a fixation cross (1-2 s), a period of music playing ((1-20 s) during which the music was generated to attempt to induce a particular affective
Fig. 2. Order of events (sessions and runs) within the experiment. The sessions occur sequentially on separate days; within each session the runs occur in sequence with breaks between each run.
state in the participant, a self-assessment manikin [37], and a final distraction task (15 s). This is illustrated in figure 3. Each participant completed one calibration session. During the music period participants were instructed to use a track-ball to continuously report their current affective state via the FEELTRACE interface, which allows 2-dimensional simultaneous reporting of both valence and arousal by the participant [38].
Fig. 3. Trial order used in the experiment. A fixation cross was first presented, followed by a period of music (during which participants may also be asked to report their current emotions via FEELTRACE), followed by a self-assessment manikin (SAM), a washout task, and then a short inter-stimulus interval (ISI). Note, the timings of each item vary according to the type of session.
A stimulus length of 20 s of music was chosen as this was considered to be sufficiently long to evoke the desired emotional responses [39], while being short enough to allow for a large enough number of trials within each session for sufficient statistical power. This length of stimuli was confirmed to be appropriate in pilot work conducted with an independent small group of participants, who reported experiencing the desired affective states.
The training session had a very similar structure. The only key differences were that the music was played for 40 s and the music was generated to attempt to induce two different affective states in the participant. The first 20 s attempted to induce one affective state and the next 20 s
attempted to induce a different state. The training session was repeated three times over three different days for each participant.
In each trial of the calibration session one of nine dif-ferent affective states was targeted. Thus, each calibration session played music generated to induce one of nine differ-ent affective states in each participant ten times.
Each trial within the training sessions contained a unique pairing of a different initial and final affective state from the same set of nine discrete affective states used in the calibration run.
The testing session was used to test the hBCMI system during online use and is not considered here. Results on this session type and further details on the method, as well as further details on the differences and relationships between the sessions, are reported in [36].
2.2.1 Participants
Twenty-two healthy participants were recruited for this study. The participants were all right handed. Ethical ap-proval was granted by the University of Reading research ethics committee and participants gave informed consent.
In order to ensure some homogeneity in the participant population in terms of musical preferences, all participants were asked to complete a Short Test Of Musical Preferences (STOMP) questionnaire [40]. Participants who indicated they had a strong dislike for two or more music genres, or who had a strong dislike for the classical music genre, were excluded from the study.
This resulted in two participants being excluded at this stage. The remaining twenty participants had a mean age of 22 (range 19-30). Nine of these participants were female. Each participant was reimbursed £10.00 GBP for each ses-sion of the experiment they attended.
2.2.2 Data recording
EEG was recorded using a BrainAmp EEG amplifier (Brain-Products, Germany) via 32 EEG channels positioned accord-ing to the International 10/20 system and referenced to a single electrode placed at FCz (see [36] for more details). The specific EEG channels used are illustrated in figure 4. Impedances were kept below 10 kΩfor each participant. Ad-ditionally, galvanic skin response (GSR) was recorded from the ventral medial phalanx positions of the participants’ left hand index and middle fingers, electrocardiogram (ECG) was recorded from the participants’ wrists, respiration was recorded from a respiration belt placed around the base of the rib cage, and blood oxygenation levels were recorded via a pulse oximeter on the left thumb.
All physiological responses were recorded via a BrainAmp ExG amplifier (BrainProducts, Germany). All signals were recorded at a sampling rate of 1,000 Hz and co-registered to stimuli presentation via the ‘TOBI’ standards [41], [42].
2.2.3 Music generation
The music stimuli used in these experiments was generated via an affective algorithmic composition (AAC) system [43]. Music was generated to target specific discrete locations in the valence-arousal space. Specifically, 9 types of music
Fig. 4. The EEG recording montage used throughout the experiments.
stimuli were generated to target high, neutral, and low valence and high, neutral, and low arousal.
Multiple pieces of music were generated for each stimu-lus type. Thus, each participant listened to several examples of pieces of music generated to target each affective state but never listened to the same piece more than once. This allowed us to avoid confounding the participants’ responses by familiarising them with specific stimuli [44]. The stimuli were played to each participant in random order.
2.3 Analysis
2.3.1 Artefact removal
To remove artefacts and ensure some degree of homogeneity between sessions, artefacts were removed from the EEG via the method ‘Fully online and automated artifact removal for brain-computer interfacing (FORCe)’ [45]. FORCe first decomposed the EEG signal into a set of wavelet coefficients and then further decomposed these coefficients into inde-pendent components via Indeinde-pendent Component Analysis. The components were then altered or removed via a com-bination of soft and hard thresholding, using thresholding previously trained on other, independent, datasets [45]. Fi-nally, visual spot checking was then used to check signal quality. Three participants were removed at this stage due to large amounts of artefact contamination remaining in the signal.
Trial rejection was then used to ensure that data from the remaining participants was clean. Trials for which the max-imum amplitude was greater than±100µV were removed from the data from the remaining 17 participants.
2.3.2 Feature extraction
Features were extracted from the recorded signals for the affective state detection system.
TABLE 1
Scalp regions from which features are extracted.
Scalp region EEG channels Whole scalp All channels
Frontal FP1, FP2, F7, F3, Fz, F4, F8 Central C3, Cz, C4, CP5, CP1, CP2 Parietal P7, P3, Pz, P4, P8, POz Occipital O1, O2 Left Temporal FT9, T7, TP9 Right Temporal FT10, T8, TP10 Midline Fz, Cz, Pz, POz Left Hemisphere FP1, F7, F3, FT9, FC5, FC1, T7, C3, TP9, CP5, CP1, P7, P3, O1 Right Hemisphere FP2, F4, F8, FC2, FC6, FT10, C4, T8, CP2, CP6, TP10, P4, P8, O2
EEG features were extracted from 10 frequency bands of interest (delta (1-4 Hz), slow theta (4-5.5 Hz), fast theta (5.5-7 Hz), total theta (4-(5.5-7 Hz), slow alpha (8-10 Hz), fast alpha (10-12 Hz), total alpha (8-12 Hz), sigma (12-14 Hz), beta (14-30 Hz), and gamma ((14-30-45 Hz)) via a method adapted from [46]. The mean band power in each frequency band was calculated over the length of each sub-trial (see section 2.3.4) and extracted over 10 scalp regions (all channels, frontal, central, parietal, occipital, left temporal, right temporal, midline, left hemisphere, and right hemisphere channels), which are listed in table 1.
Features were also extracted to describe the other physi-ological processes. The mean GSR amplitude was extracted after low-pass filtering (5 Hz, 2nd order Butterworth filter). Specifically, the mean average amplitude of the GSR was extracted as a single feature describing the GSR within each sub-trial. Electrocardiogram (ECG) and blood pulse sensor (BPS) signals were first de-trended by estimating and then subtracting a 40’th order polynomial function from these signals and then band-pass filtering these signals (3-45 Hz, 2nd order Butterworth filter). The filter parameters were set by visually inspecting different filters on a subset of the data. Mean peak-to-peak intervals were then used as the features of interest. Specifically, single features were ex-tracted from the ECG and BPS signals describing the mean peak-to-peak interval times in the filtered signals. Finally, the respiration rate was band-pass filtered (0.1-0.6 Hz, 2nd order Butterworth filter) before extracting the mean band power centered at 0.35 Hz as the feature of interest.
Thus, a total of 104 features were extracted from the data recorded from each participant. These formed a set of candidate features, which were then sub-selected prior to classification.
2.3.3 Participant reports
Musical emotions can be both felt and perceived. A felt emo-tion refers to the emoemo-tion (affective state) that an individual feels as they listen to music. In contrast, perceived emotions refer to the emotions a listener thinks a piece of music is attempting to convey. For example, a piece of music can be perceived to be sad but enjoyable to listen to [47].
Participants were instructed to report their current felt emotions on a continuous scale via the FEELTRACE inter-face [38], which they operated with their right hand using a
trackball. The FEELTRACE responses were discretised into 9 discrete affective states by segmenting the valence-arousal space into 9 equal sized regions and identifying which region the FEELTRACE report occupied at each moment in time.
2.3.4 Trials
In order to produce an affective state detection method with high temporal resolution, trials were then segmented into 1 s long, non-overlapping, sub-trial sections. Mean features and participant reports of their felt affective states were calculated over each of these new 1 s long sub-trials.
2.3.5 Feature selection
A subset of features was selected for use in the classifica-tion method via an Eigen-decomposiclassifica-tion based automated supervised feature selection method [48]. Features were first z-scored and then decomposed into Eigen-vectors. An adapted spectral clustering method was then used to select the sets of features that clustered with the class labels (the participant’s reports of their felt affective states). Specifically, an automated clustering method (spectral clustering) was applied to the set of candidate features and class labels. The cluster that was identified as containing the class labels was retained and the other features that were grouped into this clustered were selected as the features of interest.
Further detail on this method, as well as validation on synthetic and real EEG datasets and a comparison with other state-of-the-art feature selection methods, can be found in [48].
2.3.6 Classification
Classification was attempted via a support vector machine (SVM) employing a polynomial kernel and a least squares estimation method. Classifier training and validation was attempted within a cross-fold train and validation scheme. Specifically, the Integrating Homologous Samples (IHS) method was used to split the data into 10 training and testing set tuples [49], with 10 % of the trials placed in the testing set in each fold. This method of constructing a cross-validation training and testing procedure assigns homologous samples to the same testing set. Consequently, this allows accurate estimates to be taken of the classifica-tion accuracy of a particular method without homologous samples in the testing set artificially inflating the accuracy. Note that the IHS method to separate the data into training and testing sets was applied before application of the feature selection method described in section 2.3.5. Thus, training and testing data were kept separate at all stages from feature selection through to classification.
The classification problems that were attempted were differentiating trials in which participants reported high vs. low affective states on either the valence or arousal axes, which were considered independently. Specifically, the dis-cretised valence-arousal space may be further segmented via either valence or arousal independently. We considered two binary classification problems within this space, specifically high vs. low valence and high vs. low arousal. Sub-trials were extracted in which participants’ mean FFELTRACE reports of their current affective state (either valence or
arousal) were labelled as high or low. Two binary classifi-cation problems were then tackled with the SVM classifier: high vs. low valence and high vs. low arousal.
2.3.7 Comparisons
In order to evaluate the difference between the personalised affective state detection method and an affective state detec-tion method that does not consider individual participant differences, classification was performed in two different ways. In the first approach a leave-one-participant-out train and validation scheme was used, in which data from all but one participant was used to train a detection method to be applied to the left out participant. In the second approach trials from each participant were treated separately and the 10x10 train and validation scheme was re-run for each participant.
Additionally, the influence of the use of physiological and EEG based features on the performance of the person-alised affective state detection method was evaluated. Clas-sification, on each individual participant, was attempted with three different candidate feature sets: physiological features only, EEG features only, and a hybrid feature set combining both physiological and EEG based features.
3
R
ESULTS3.1 Artefacts
Amplitude thresholding of the EEG on a trial by sub-trial basis resulted in a total of 782 sub-sub-trials being removed (22.9 % of the total number of 3,408 sub-trials). Thus, the final dataset contained 2,626 sub-trials.
3.2 Affective state generation
We first compared the FEELTRACE responses given by participants to the affective states targeted by the music generation system within each trial for each participant. Specifically, we asked whether the participants reported the same felt emotions during the experiment as the affective states targeted by the generated music.
Table 2 lists the correlations between the affective states the generated music was targeting for each participant and the mean FEELTRACE responses reported by each partic-ipant while they listened to the music. It may be noted that there are significant correlations between the targeted affective states and the reported affective states for all par-ticipants, confirming that the music generator was able to produce the desired responses in all participants.
This may be observed in more detail by inspecting the mean confusion matrices of targeted and reported valence and arousal over all participants, as listed in table 3. It may be noted that there is a high degree of correspondence between the targeted and reported affective states when the targets were either high or low valence or arousal. However, participants often confused neutral targeted affective states with either high or low affective states.
3.3 Classification
The first classification approach used a leave-one-participant-out train and validation scheme. Thus, the clas-sifier was trained on data from a group of participants
TABLE 2
Correlations between mean FEELTRACE responses to the music reported by each participant and the affective state the music stimuli
was targeting. Valence Arousal Participant r p r p 1 0.656 <0.01 0.564 <0.01 2 0.409 <0.01 0.524 <0.01 3 0.609 <0.01 0.433 <0.01 4 0.608 <0.01 0.516 <0.01 5 0.638 <0.01 0.675 <0.01 6 0.499 <0.01 0.408 <0.01 7 0.628 <0.01 0.612 <0.01 8 0.540 <0.01 0.488 <0.01 9 0.663 <0.01 0.479 <0.01 10 0.606 <0.01 0.426 <0.01 11 0.657 <0.01 0.694 <0.01 12 0.678 <0.01 0.711 <0.01 13 0.613 <0.01 0.664 <0.01 14 0.613 <0.01 0.509 <0.01 15 0.581 <0.01 0.379 <0.01 16 0.594 <0.01 0.661 <0.01 17 0.454 <0.01 0.429 <0.01 Avg. 0.591 - 0.539 -TABLE 3
Confusion matrices comparing targeted and reported affective states
for each piece of music over all participants (p-values have been
corrected for multiple comparisons via Bonferroni correction.
Target
Low Neutral High
Reported Low 0.856 0.385 0.031 Neutral 0.038 0.352 0.455 High 0.106 0.263 0.514 (a) Valence Target
Low Neutral High
Reported
Low 0.496 0.400 0.143 Neutral 0.437 0.420 0.174 High 0.066 0.179 0.683
(b) Arousal
and applied on a different, left-out, participant, without any attempt made to personalise the detection method to individual participants. Leave-one-participant-out train and test classification approaches such as this allow us to train a classifier from a population and test its applicability to a new individual who was not a part of the training popu-lation. Thus, this approach represents the best way to eval-uate the performance of the non-personalized classification approach.
This resulted in a mean valence classification accuracy of 0.586 (standard deviation across folds 0.053). This result was statistically significant when compared to the null hypothesis of random classification (i.e. that each class has equal chance of being selected by the classifier) (p < 0.01). Arousal was also classified with a similar mean accuracy of
0.593 (standard deviation of 0.038) and was also statistically significant (p < 0.01) when compared to random chance level classification.
The second classification approach (feature selection and SVM-based classification) was trained and applied on indi-vidual participants. Data from each participant was trained and classified within a 10x10 cross-fold train and validation scheme. The classification results for the individual partici-pants are listed in table 4.
TABLE 4
Accuracy (Acc.) of the performance of the personalised affective state detection method for high vs. low valence trials and high vs. low arousal
trials.
Valence Arousal Participant Acc. p Acc. p
1 0.734 <0.01 0.727 <0.01 2 0.657 <0.01 0.677 <0.01 3 0.786 <0.01 0.751 <0.01 4 0.840 <0.01 0.801 <0.01 5 0.667 <0.01 0.657 <0.01 6 0.570 <0.01 0.638 <0.01 7 0.677 <0.01 0.653 <0.01 8 0.672 <0.01 0.569 <0.01 9 0.791 <0.01 0.753 <0.01 10 0.653 <0.01 0.665 <0.01 11 0.749 <0.01 0.795 <0.01 12 0.642 <0.01 0.654 <0.01 13 0.686 <0.01 0.629 <0.01 14 0.673 <0.01 0.715 <0.01 15 0.661 <0.01 0.697 <0.01 16 0.672 <0.01 0.660 <0.01 17 0.569 <0.01 0.612 <0.01 Avg. 0.688 - 0.686
-This second approach (personalized detection for each participant) resulted in a mean classification accuracy for va-lence of 0.688 and a mean classification accuracy of 0.686 for arousal. Both results are statistically significant, compared to chance level classification, for all participants (p <0.01).
The results from this personalized classification ap-proach were also compared to the results achieved using the leave-one-participant-out train and validation scheme via a pairedt-test. These results are listed in table 5.
It may be observed that the personalised affective state classification approach was found to be significantly more accurate than the population-based classification approach (p <0.01) in 10 out of 17 participants for valence and 13 out of 17 participants for arousal classification.
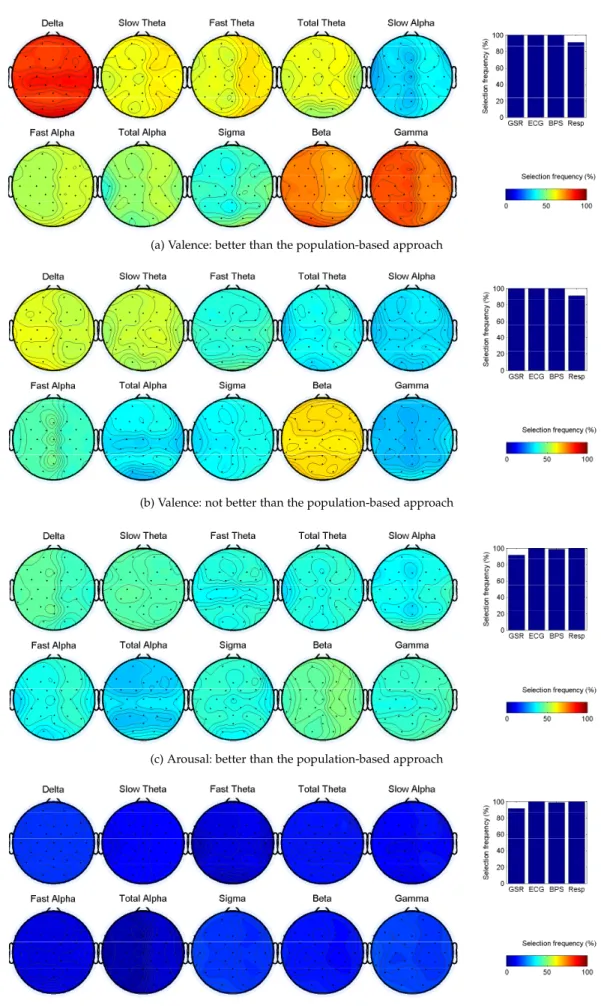
The features that were selected for classification are compared between groups of participants for whom the personalised classification approach performed significantly better than the population-based approach against those participants for whom personalised classification did not perform better than the population-based approach. The results are illustrated in figure 5.
It may be observed that, for participants for whom affective state classification is significantly better when clas-sification is performed on a per-participant basis than on a population basis, EEG band-power based features are much more frequently selected. This suggests that EEG-based features are useful for classification but that inter-participant variability in the EEG is a key factor in determining the classification success of this approach.
(a) Valence: better than the population-based approach
(b) Valence: not better than the population-based approach
(c) Arousal: better than the population-based approach
(d) Arousal: not better than the population-based approach
Fig. 5. Features selected for classifying affective states (valence and arousal) for participants for whom classification was significantly better on a per participant basis than the population-based approach and for participants for whom individual classification was not better than the population-based approach.
TABLE 5
Accuracy (Acc.) of participant (P.) wise classification compared to
population based classification (t-tests). The p-values indicate whether
the personalised classifier performed significantly better than the population-based classification approach.
Valence Arousal Participant Acc. p Acc. p
1 0.734 0.008 0.727 <0.001 2 0.657 0.037 0.677 0.016 3 0.786 0.003 0.751 <0.001 4 0.840 <0.001 0.801 <0.001 5 0.667 0.001 0.657 0.002 6 0.570 0.503 0.638 0.031 7 0.677 0.089 0.653 0.062 8 0.672 0.024 0.569 0.120 9 0.791 <0.001 0.753 0.001 10 0.653 0.069 0.666 0.009 11 0.749 0.004 0.795 <0.001 12 0.642 0.056 0.654 0.013 13 0.686 0.044 0.629 0.097 14 0.673 0.029 0.715 0.002 15 0.661 0.061 0.697 0.006 16 0.672 0.141 0.660 0.037 17 0.569 0.438 0.612 0.119 Avg. 0.688 - 0.686 -3.4 Feature types
The performance of the classification approach was com-pared between different feature sets. Specifically, feature selection and classification were performed on a per par-ticipant basis with three different sets of candidate features: (1) just EEG features, (2) just physiological features, and (3) a hybrid feature set combining both EEG and physiological features.
The classification results for high vs. low valence classi-fication for each of these three feature sets are listed in table 6.
TABLE 6
Performance (classification accuracies) of the affective state detection method for high vs. low valence trials for different feature types (EEG
features, physiological features, and hybrid features), for each participant (P.). Asterisks indicate classification accuracies that are
significantly better than chance (p <0.05).
Accuracy
P. EEG features Phys. features Hybrid features 1 0.637∗ 371 0.734∗ 2 0.629∗ 0.473 0.657∗ 3 0.721∗ 0.505 0.786∗ 4 0.809∗ 0.615 0.840∗ 5 0.606∗ 0.385 0.667∗ 6 0.500∗ 0.477 0.570∗ 7 0.603∗ 0.609∗ 0.677∗ 8 0.627∗ 0.470 0.672∗ 9 0.733∗ 0.601∗ 0.791∗ 10 0.586∗ 0.532∗ 0.653∗ 11 0.682∗ 0.576∗ 0.749∗ 12 0.586∗ 0.531∗ 0.642∗ 13 0.592∗ 0.519∗ 0.686∗ 14 0.631∗ 0.589∗ 0.673∗ 15 0.613∗ 0.611∗ 0.661∗ 16 0.609∗ 0.546∗ 0.672∗ 17 0.524∗ 0.521∗ 0.569∗ Avg. 0.629 0.525 0.688
These may be compared with the classification results for
high vs. low arousal when each of the different candidate feature types are used. These results are listed in table 7.
TABLE 7
Performance of the affective state detection method for high vs. low arousal trials for different feature types (EEG features, physiological features, and hybrid features), for each participant (P.). Asterisks indicate classification accuracies that are significantly better than
chance (p <0.05).
Accuracy
P. EEG features Phys. features Hybrid features 1 0.629∗ 0.586∗ 0.727∗ 2 0.614∗ 0.539∗ 0.677∗ 3 0.737∗ 0.608∗ 0.786∗ 4 0.834∗ 0.625 0.801∗ 5 0.602∗ 0.587∗ 0.657∗ 6 0.558∗ 0.551∗ 0.638∗ 7 0.601∗ 0.528 0.653∗ 8 0.555∗ 0.517∗ 0.569∗ 9 0.633∗ 0.556∗ 0.791∗ 10 0.574∗ 0.587∗ 0.666∗ 11 0.689∗ 0.658∗ 0.795∗ 12 0.580∗ 0.551∗ 0.654∗ 13 0.571∗ 0.476∗ 0.629∗ 14 0.657∗ 0.578∗ 0.715∗ 15 0.616∗ 0.637∗ 0.697∗ 16 0.627∗ 0.591∗ 0.672∗ 17 0.522∗ 0.541∗ 0.612∗ Avg. 0.624 0.572 0.686
The classification accuracies achieved with each type of feature were compared via an ANOVA with factor ‘feature type’ and levels ‘EEG’, ‘Physiological’, and ‘Hybrid’. A
χ2 test demonstrates that the data is normally distributed
(p < 0.05) and Bartlett’s test demonstrates that the accu-racies have statistically insignificantly different variances (p = 0.108), thus the assumptions of the ANOVA hold. A significant effect of ‘feature type’ was observed when attempting to classify valence (F(2,48) = 21.38,p < 0.001) and when attempting to classify arousal (F(2,48) = 14,
p < 0.001).
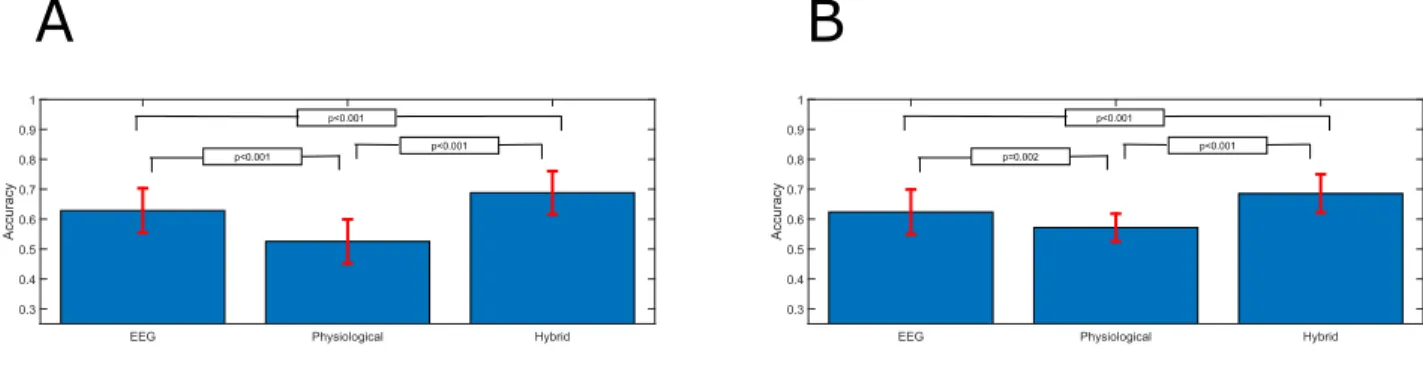
Post-hoc t-tests were used to compare the differences between individual pairs of feature types. Figure 6 illus-trates the mean and standard deviation of the classification accuracies achieved with each feature type when attempting valence and arousal classification. Significant differences, as identified via the paired t-tests, are also indicated on the figure.
It may be observed, from figure 6, that EEG and Hybrid features produce significantly higher classification accura-cies (p <0.01) than physiological features for both valence and arousal classification. The use of hybrid features also results in significantly higher classification accuracies than EEG features alone for arousal classification.
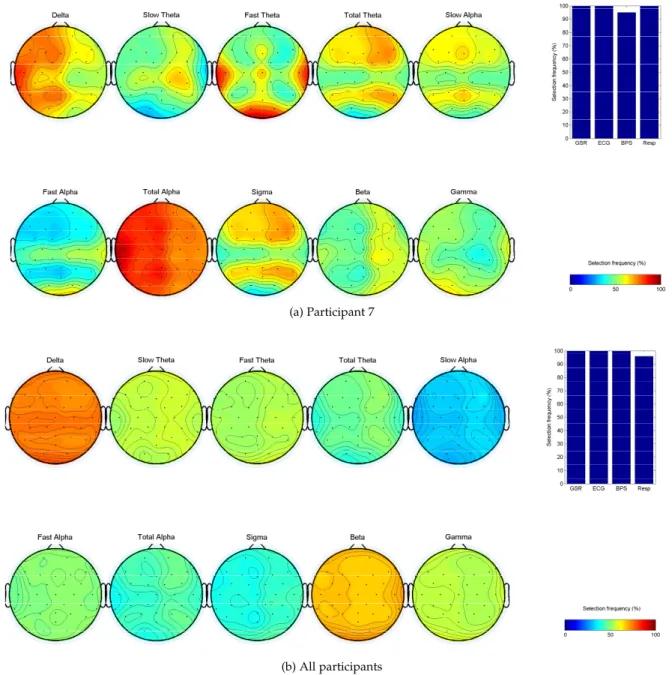
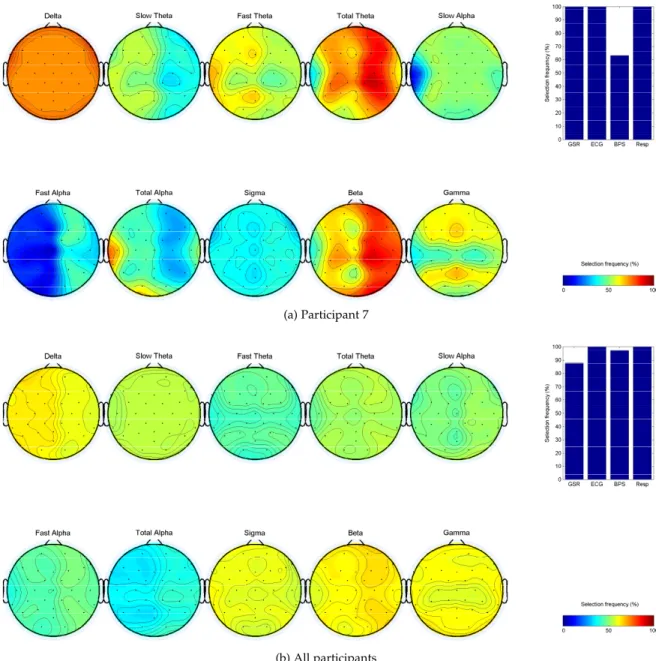
3.5 Selected features
An illustration of the features selected, from the hybrid candidate feature set, to differentiate high and low valence for a single, randomly selected, participant is shown in figure 7. Figure 7 also illustrates the features selected for differentiating high vs. low valence over all participants. It may be observed that EEG band-power features in the delta, alpha, and beta frequency bands are most frequently
A
B
EEG Physiological Hybrid
Accuracy 0.3 0.4 0.5 0.6 0.7 0.8 0.9 1 p<0.001 p<0.001 p=0.002
EEG Physiological Hybrid
Accuracy 0.3 0.4 0.5 0.6 0.7 0.8 0.9 1 p<0.001 p<0.001 p<0.001
Fig. 6. Mean classification accuracies achieved for high vs. low valence (A) and arousal (B) classification for each feature type. Error bars indicate
±1standard deviation and the p-values indicate feature types that produce significantly different classification accuracies (pairedt-test).
selected and that all four physiological features are very frequently selected.
This may be contrasted with features selected to solve the other classification problem (high vs. low arousal) for a different randomly selected participant and all participants. These features are illustrated in figure 8. Note that EEG band-power features in the alpha band are less frequently selected than in the case of valence classification.
4
D
ISCUSSIONBrain-computer music interfaces (BCMIs) may be used as affective state modulation systems and have potential appli-cations in music therapy. Specifically, our proposed BCMI design aims to provide a tool for allowing interaction be-tween an individual undergoing music therapy and ongoing music generation. Thus, providing a method for musical communication that aims to help individuals with regulate their emotions. However, in order for the proposed BCMI to be effective it needs to be able to accurately and quickly estimate a user’s current affective state.
Our proposed affective state detection system for use in BCMI systems and music therapy is able to significantly ac-curately (p <0.05) detect affective states in each participant in our study. The performance of the system is significantly better (p < 0.01) when the classifier is trained on a per-sonalised basis for each participant. This is most likely a result of the large, well-known inter-personal differences in physiological processes, EEG, and emotional responses to music [50].
The features selected for use by our affective state detec-tion system cluster into several key frequency bands and, in some cases, key spatial regions, while in others appearing to be more broadly spread across the scalp. The spreading of features across the scalp is not uniform, although the colour scaling gives this appearance in a small number of occasions. However, the relatively high specificity of the frequency bands involved in affective processing reflects results reported elsewhere which suggests a high degree of specificity in the frequency bands involved in affective state processing [14], [46], [51].
Physiological features are selected with very high fre-quency. This suggests that they are highly informative about an individual’s affective state and this reflects the
well-known close relationship between these sorts of signals and the emotions [3], [23], [52], [53].
We can conclude that personalised affective state detec-tion is more effective for use in BCMI systems than affective state detectors trained on population averages.
This reflects other results observed and reported else-where with other affective state detection systems. For ex-ample, in [54] higher EEG and physiological signal based classification of affective states are reported when the clas-sifier is trained on a smaller group of participants, sug-gesting inter-participant differences result in lower clas-sification accuracies. Additionally, in work presented in [55], [56] participant-dependent classification is compared to participant independent classification of EEG during music-video watching tasks, with the observation that participant-dependent classifiers result in higher accuracies.
Others have attempted affective state classification based on the EEG [57] or physiological signals [58]. Some re-searchers have also attempted to build hybrid affective state classification systems combining both EEG and other physiological signals [24], [25], [26], [27].
However, these hybrid classification methods were de-signed for use with affective stimuli using a visual modal-ity and may not translate well to a music based stimuli modality [28]. Furthermore, our proposed approach makes use of a supervised machine learning method to select an optimal subset of features for affective state classification, representing an advancement on these previous approaches. Finally, our proposed approach is explicitly developed for use within a Bracomputer music interface and are in-tended to be used on a single trial basis during online use of a BCMI.
Others have reported good, participant independent, affective state classification accuracies. For example, in [59] participant independent EEG-based classification of valence and arousal was achieved with accuracies of up to 81.3 %, while in [60] participant independent classification accura-cies of up to 85.17 % were achieved.
One possible explanation for this observed discrepancy could be the different stimulation modalities used in these studies to evoke emotions. Specifically, [59] uses images taken from the international affective picture system (IAPS) [61], while [60] uses images of facial expressions of emotions as its stimuli. Specifically, both studies use stimuli that
(a) Participant 7
(b) All participants
Fig. 7. Selected features from the hybrid candidate feature set to classify high vs. low music induced valence for participant 7 and for all participants. The colour bar indicates the frequency (%) with which each feature was selected.
employ a visual modality (a wide range of images or images of faces), while our study uses acoustic stimuli.
It may be suggested that music-induced emotions exhibit greater inter-participant differences than emotions evoked by stimuli of other modalities. For example, emotional responses to music can depend on culture [62], [63], per-sonality [64], and musical training [65], while emotional responses to faces have been reported to be more consistent across different peoples [66].
We did not attempt to classify neutral emotions within this study. This is motivated by the observation that partici-pants frequently confused ’neutral’ targeted affective states with either high or low valence/arousal affective states. This may in part be due to the artificiality of the concept of a ’neutral’ emotion. In reality very few experiences are truly emotionally neutral for every person, due to individual memories and tastes, and this is highly likely to also be
the case for music. Thus, when participants label a piece of music, that is intended to be ’neutral’ as something else it is likely that piece of music is triggering genuine emotional responses, which vary significantly between participants, and an attempt to apply a rigorous classification rule to it is less likely to succeed than the more consistently rated high or low affective responses.
There are some potential correlations between neigh-boring sub-trials in the analysis and it may be suggested that this represents a potential confound to the study. How-ever, the considerable non-stationarity of the EEG [32], [67], and the randomization of trial orders prior to validation, minimizes the effect of these relatively low inter-trial cor-relations. Additionally, the Integrated Homologous Sam-ples (IHS) cross-validation method was used to train and validate the classifiers as an additional precaution against inflating the classification accuracies [49].
(a) Participant 7
(b) All participants
Fig. 8. Selected features from the hybrid candidate feature set to classify high vs. low music induced arousal for participant 7. The colour bar indicates the frequency (%) with which each feature was selected.
An additional limitation of the method presented in this study is the low signal to noise ratio of the EEG and other physiological signals used for the personalised affective state detection system. This poor signal to noise ratio is well known [31] and represents a challenge for all attempts to identify cognitive states from physiological signals. Addi-tionally, the relatively small number of participants in this study may be interpreted as a potential weakness. However, as the aims of this study are to identify a method for personalised affective state detection, rather than a general method that would work with everyone, this relatively small number of participants provides a sufficiently robust test case for the method. Future work will explore the suitability of the method for affective state detection with larger numbers of participants.
The incorporation of other physiological features in ad-dition to EEG (i.e. a hybrid BCMI design) also significantly
improves the detection performance. This demonstrates that to understand emotions it is important to observe not only the brain, but also to examine the wider physiology associ-ated with emotional responses. It also suggests that a hybrid BCI approach [42] may be most successful in constructing affective BCMIs.
A
CKNOWLEDGMENTSWe would like to thank our participants for their time and assistance with our research. This work was supported by the EPSRC grants EP/J003077/1 and EP/J002135/1.
R
EFERENCES[1] E. R. Miranda, W. L. Magee, J. J. Wilson, J. Eaton, and R. Pala-niappan, “Brain-Computer Music Interfacing (BCMI): From Basic Research to the Real World of Special Needs,”Music and Medicine, vol. 3, no. 3, pp. 134–140, mar 2011.
[2] E. R. Miranda, “Brain-Computer music interface for composition and performance,”IntJ Dis Human Dev, vol. 5, no. 2, pp. 119–125, 2006.
[3] I. Daly, A. Malik, J. Weaver, F. Hwang, S. Nasuto, D. Williams, A. Kirke, and E. Miranda, “Identifying music-induced emotions from EEG for use in brain-computer music interfacing,” in 6th Affective Computing and Intelligent Interaction, 2015.
[4] J. Bhattacharya and E.-J. Lee, “Modulation of EEG Theta Band Signal Complexity by Music Therapy,” International Journal for Bifurcation and Chaos, vol. 26, p. 9, oct 2012.
[5] G. Ansdell and M. Pavlicevic,Community Music Therapy. Jessica Kingsley Publishers, 2001.
[6] K. Aigen, Music-centered Music Therapy. Barcelona: Barcelona Publishers, 2005.
[7] A. Kirke and E. Miranda, “Combing EEG Frontal Asymmetry Studies with Affective Algorithmic Composition and Expressive Performance Models,” pp. 1–4, 2011.
[8] S. Ahrens and G. Deffner, “Empirical study of alexithymia: methodology and results.” American journal of psychotherapy, vol. 40, no. 3, pp. 430–47, jul 1986.
[9] J. D. Parker, G. J. Taylor, and R. Bagby, “The relationship between emotional intelligence and alexithymia,”Personality and Individual Differences, vol. 30, no. 1, pp. 107–115, 2001.
[10] W. L. Magee and J. W. Davidson, “The effect of music therapy on mood states in neurological patients: a pilot study.”Journal of music therapy, vol. 39, no. 1, pp. 20–9, 2002.
[11] D. Aldridge,Music therapy and neurological rehabilitation: Performing health, 2005.
[12] D. Wu, C.-Y. Li, and D.-Z. Yao, “Scale-free music of the brain.” PloS one, vol. 4, no. 6, p. e5915, jan 2009.
[13] J. Lu, D. Wu, H. Yang, C. Luo, C. Li, and D. Yao, “Scale-free brain-wave music from simultaneously EEG and fMRI recordings.” PloS one, vol. 7, no. 11, p. e49773, jan 2012.
[14] L. A. Schmidt and L. J. Trainor, “Frontal brain electrical activity (EEG) distinguishes valence and intensity of musical emotions,” Cognition & Emotion, vol. 15, no. 4, pp. 487–500, jul 2001.
[15] R. Khosrowabadi, C. Chai Quek, K. K. Kai Keng Ang, and A. Wahab, “ERNN: A Biologically Inspired Feedforward Neural Network to Discriminate Emotion From EEG Signal,” IEEE Transactions on Neural Networks and Learning Systems, vol. 25, no. 3, pp. 609–620, mar 2014.
[16] L. Bozhkov, P. Koprinkova-Hristova, and P. Georgieva, “Reservoir computing for emotion valence discrimination from EEG signals,” Neurocomputing, vol. 231, pp. 28–40, mar 2017.
[17] Y. Liu, O. Sourina, and M. Nguyen, “Real-Time EEG-Based Emotion Recognition and Its Applications,” in Transactions on Computational Science XII, ser. Lecture Notes in Computer Science, M. L. Gavrilova, C. J. K. Tan, A. Sourin, and O. Sourina, Eds. Berlin, Heidelberg: Springer Berlin Heidelberg, 2011, vol. 6670, pp. 256–277.
[18] Y.-P. Lin, C.-H. Wang, T.-L. Wu, S.-K. Jeng, and J.-H. Chen, “EEG-based emotion recognition in music listening: A comparison of schemes for multiclass support vector machine,” in2009 IEEE International Conference on Acoustics, Speech and Signal Processing. IEEE, apr 2009, pp. 489–492.
[19] I. Daly, D. Williams, J. Hallowell, F. Hwang, A. Kirke, A. Malik, J. Weaver, E. Miranda, and S. J. Nasuto, “Music-induced emotions can be predicted from a combination of brain activity and acoustic features.”Brain and cognition, vol. 101, pp. 1–11, dec 2015. [20] R. Sawata, T. Ogawa, and M. Haseyama, “Novel favorite music
classification using EEG-based optimal audio features selected via KDLPCCA,” in2016 IEEE International Conference on Acoustics, Speech and Signal Processing (ICASSP). IEEE, mar 2016, pp. 759–763.
[21] A. K. Seth, “Interoceptive inference, emotion, and the embodied self.”Trends in cognitive sciences, vol. 17, no. 11, pp. 565–73, nov 2013.
[22] A. J. Blood and R. J. Zatorre, “Intensely pleasurable responses to music correlate with activity in brain regions implicated in reward and emotion.”Proceedings of the National Academy of Sciences of the United States of America, vol. 98, no. 20, pp. 11 818–23, sep 2001. [23] J. Wagner and E. Andre, “From Physiological Signals to
Emotions: Implementing and Comparing Selected Methods for Feature Extraction and Classification,” in2005 IEEE International Conference on Multimedia and Expo. IEEE, 2005, pp. 940–943. [24] M. Soleymani, J. Lichtenauer, T. Pun, and M. Pantic, “A
Multimodal Database for Affect Recognition and Implicit
Tagging,”IEEE Transactions on Affective Computing, vol. 3, no. 1, pp. 42–55, jan 2012.
[25] S. Koelstra, C. Muhl, M. Soleymani, Jong-Seok Lee, A. Yazdani, T. Ebrahimi, T. Pun, A. Nijholt, and I. Patras, “DEAP: A Database for Emotion Analysis ;Using Physiological Signals,” IEEE Transactions on Affective Computing, vol. 3, no. 1, pp. 18–31, jan 2012.
[26] G. K. Verma and U. S. Tiwary, “Multimodal fusion framework: A multiresolution approach for emotion classification and recogni-tion from physiological signals,”NeuroImage, vol. 102, pp. 162–172, 2014.
[27] J. Zhang, M. Chen, S. Zhao, S. Hu, Z. Shi, and Y. Cao, “ReliefF-Based EEG Sensor Selection Methods for Emotion Recognition,” Sensors, vol. 16, no. 10, p. 1558, sep 2016.
[28] S. Shinkareva, J. Wang, J. Kim, M. Facciani, L. Baucom, and D. Wedell, “Representations of modality-specific affective processing for visual and auditory stimuli derived from functional magnetic resonance imaging data,” Human Brain Mapping2, vol. 35, no. 7, pp. 3558–3568, 2014.
[29] M. Bianchin and A. Angrilli, “Gender differences in emotional responses: a psychophysiological study.” Physiology & behavior, vol. 105, no. 4, pp. 925–32, feb 2012.
[30] V. Orgeta, “Specificity of age differences in emotion regulation.” Aging & mental health, vol. 13, no. 6, pp. 818–26, nov 2009. [31] P. Nunez and R. Srinivasen,Electric fields of the brain. Oxford
University Press, 2006.
[32] X. Chai, Q. Wang, Y. Zhao, X. Liu, O. Bai, and Y. Li, “Unsupervised domain adaptation techniques based on auto-encoder for non-stationary EEG-based emotion recognition,”Computers in Biology and Medicine, vol. 79, pp. 205–214, dec 2016.
[33] I. Daly, S. J. Nasuto, and K. Warwick, “Single tap identification for fast BCI control,”Cognitive Neurodynamics, vol. 5, no. 1, pp. 21–30, 2011.
[34] G. Pfurtscheller, B. Z. Allison, C. Brunner, G. Bauernfeind, T. Solis-Escalante, R. Scherer, T. O. Zander, G. M ¨uller-Putz, C. Neuper, and N. Birbaumer, “The hybrid BCI,”Frontiers in Neuroprosthetics, vol. 4, no. 30, 2010.
[35] I. Daly, D. Williams, A. Kirke, J. Weaver, A. Malik, F. Hwang, M. Wairagkar, E. Miranda, and S. Nasuto, “An Affective Brain-computer music Interface,” inProceedings of the 6th International Brain-Computer Interface Meeting, organized by the BCI Society, 2016. [36] I. Daly, D. Williams, A. Kirke, J. Weaver, A. Malik, F. Hwang, E. Miranda, and S. J. Nasuto, “Affective braincomputer music interfacing,”Journal of Neural Engineering, vol. 13, no. 4, p. 046022, aug 2016.
[37] M. M. Bradley and P. J. Lang, “Measuring emotion: the Self-Assessment Manikin and the Semantic Differential.”Journal of behavior therapy and experimental psychiatry, vol. 25, no. 1, pp. 49–59, mar 1994.
[38] R. Cowie, E. Douglas-Cowie, S. Savvidou, E. McMahon, M. Sawey, and M. Schr ¨oder, “’FEELTRACE’: An Instrument For Recording Perceived Emotion In Real Time,” in Proceedings of the ISCA Workshop on Speech and Emotion, 2000, pp. 19–24.
[39] E. Bigand, S. Filipic, and P. Lalitte, “The time course of emotional responses to music.”Annals of the New York Academy of Sciences, vol. 1060, pp. 429–37, dec 2005.
[40] P. J. Rentfrow and S. D. Gosling, “The do re mi’s of everyday life: the structure and personality correlates of music preferences.” Journal of personality and social psychology, vol. 84, no. 6, pp. 1236–56, jun 2003.
[41] C. Breitwieser, I. Daly, C. Neuper, and G. Muller-Putz, “Proposing a Standardized Protocol for Raw Biosignal Transmission.”IEEE trans. on bio-med. eng., vol. 59, no. 3, pp. 852–859, dec 2012. [42] G. R. M ¨uller-Putz, C. Breitwieser, F. Cincotti, R. Leeb,
M. Schreuder, F. Leotta, and Et.al., “Tools for Brain-Computer In-teraction: A General Concept for a Hybrid BCI.”Front Neuroinform, vol. 5, p. 30, jan 2011.
[43] D. Williams, A. Kirke, E. R. Miranda, E. Roesch, I. Daly, and S. Nasuto, “Investigating affect in algorithmic composition systems,”Psychology of Music, pp. 1–24, aug 2014.
[44] N. Thammasan, K. Moriyama, K. Fukui, and M. Numao, “Investigation of Familiarity Effects in Music-Emotion Recognition Based on EEG,” in Brain Informatics and Health, ser. Lecture Notes in Computer Science, Y. Guo, K. Friston, F. Aldo, S. Hill, and H. Peng, Eds. Cham: Springer International Publishing, 2015, vol. 9250.
[45] I. Daly, R. Scherer, M. Billinger, and G. Muller-Putz, “FORCe: Fully Online and automated artifact Removal for brain-Computer interfacing.”IEEE transactions on neural systems and rehabilitation engineering, vol. 23, no. 5, aug 2014.
[46] M. Stikic, R. R. Johnson, V. Tan, and C. Berka, “EEG-based classification of positive and negative affective states,” Brain-Computer Interfaces, vol. 1, no. 2, pp. 99–112, may 2014. [47] K. Kallinen and N. Ravaja, “Emotion perceived and emotion felt:
Same and different,”Musicae Scientiae, vol. 10, no. 2, pp. 191–213, sep 2006.
[48] I. Daly, F. Hwang, A. Kirke, A. Malik, J. Weaver, D. Williams, E. Miranda, and S. J. Nasuto, “Automated identification of neural correlates of continuous variables.”Journal of neuroscience methods, dec 2014.
[49] S. Liu, D. Zhang, M. Xu, H. Qi, F. He, X. Zhao, P. Zhou, L. Zhang, and D. Ming, “Randomly dividing homologous samples leads to overinflated accuracies for emotion recognition,”International Journal of Psychophysiology, vol. 96, no. 1, pp. 29–37, 2015. [50] I. Daly, A. Malik, F. Hwang, E. Roesch, J. Weaver, A. Kirke,
D. Williams, E. Miranda, and S. J. Nasuto, “Neural correlates of emotional responses to music: an EEG study,”Neuroscience Letters, vol. 573, pp. 52–57, may 2014.
[51] R. Khosrowabadi, A. Wahab, K. K. Ang, and M. H. Baniasad, “Affective computation on EEG correlates of emotion from musical and vocal stimuli,” in2009 International Joint Conference on Neural Networks. IEEE, jun 2009, pp. 1590–1594.
[52] F. Agrafioti, D. Hatzinakos, and A. K. Anderson, “ECG Pattern Analysis for Emotion Detection,” IEEE Transactions on Affective Computing, vol. 3, no. 1, pp. 102–115, jan 2012.
[53] A.-M. Brouwer, M. Hogervorst, B. Reuderink, Y. van der Werf, and J. van Erp, “Physiological signals distinguish between reading emotional and non-emotional sections in a novel,”Brain-Computer Interfaces, vol. 2, no. 2-3, pp. 76–89, apr 2015.
[54] A. Tauseef Sohaib, S. Qureshi, J. Hagelb¨ack, O. Hilborn, and P. Jerˇci´c, “Evaluating Classifiers for Emotion Recognition Using EEG,” inFoundations of Augmented Cognition, ser. Lecture Notes in Computer Science, D. D. Schmorrow and C. M. Fidopiastis, Eds. Berlin, Heidelberg: Springer Berlin Heidelberg, 2013, vol. 8027, pp. 492–501.
[55] S. Koelstra, A. Yazdani, M. Soleymani, C. Muhl, J. Lee, A. Nijholt, T. Pun, T. Ebrahimi, and I. Patras, “Single Trial Classification of EEG and Peripheral Physiological Signals for Recognition of Emotions Induced by Music Videos,” in Brain Informatics, ser. Lecture Notes in Computer Science, Y. Yao, R. Sun, T. Poggio, J. Liu, N. Zhong, and J. Huang, Eds. Berlin, Heidelberg: Springer Berlin Heidelberg, 2010, vol. 6334.
[56] E. Kroupi, A. Yazdani, and T. Ebrahimi, “EEG Correlates of Different Emotional States Elicited during Watching Music Videos,” in Affective Computing and Intelligent Interaction, ser. Lecture Notes in Computer Science, S. D’Mello, A. Graesser, B. Schuller, and J.-C. Martin, Eds. Berlin, Heidelberg: Springer Berlin Heidelberg, 2011, vol. 6975.
[57] S. Makeig, G. Leslie, T. Mullen, D. Sarma, N. Bigdely-Shamlo, and C. Kothe, “First Demonstration of a Musical Emotion BCI,”Affecti. Comput. and Int. Interact. Lect. Notes in Comp. Sci., vol. 6975, pp. 487–496, 2011.
[58] J. Kim and E. Andr´e, “Emotion recognition based on physiological changes in music listening.”IEEE transactions on pattern analysis and machine intelligence, vol. 30, no. 12, pp. 2067–83, dec 2008. [59] C. A. Frantzidis, C. Bratsas, C. L. Papadelis, E. Konstantinidis,
C. Pappas, and P. D. Bamidis, “Toward emotion aware computing: an integrated approach using multichannel neurophysiological recordings and affective visual stimuli.” IEEE transactions on information technology in biomedicine : a publication of the IEEE Engineering in Medicine and Biology Society, vol. 14, no. 3, pp. 589–97, may 2010.
[60] P. Petrantonakis and L. Hadjileontiadis, “Emotion Recognition From EEG Using Higher Order Crossings,”IEEE Transactions on Information Technology in Biomedicine, vol. 14, no. 2, pp. 186–197, mar 2010.
[61] P. Lang, M. Bradley, and B. Cuthbert, “International Affective Picture System (IAPS): Technical Manual and Affective Ratings,” NIMH Center for the Study of Emotion and Attention, 1997.
[62] J. H. Lee and X. Hu, “Cross-cultural Similarities and Differences in Music Mood Perception,” in iConference 2014 Proceedings. iSchools, mar 2014.
[63] A. H. Gregory and N. Varney, “Cross-Cultural Comparisons in the Affective Response to Music,” Psychology of Music, vol. 24, no. 1, pp. 47–52, apr 1996.
[64] M. Park, K. Hennig-Fast, Y. Bao, P. Carl, E. P ¨oppel, L. Welker, M. Reiser, T. Meindl, and E. Gutyrchik, “Personality traits modulate neural responses to emotions expressed in music.” Brain research, vol. 1523, pp. 68–76, jul 2013.
[65] A. Kawakami, K. Furukawa, K. Katahira, K. Kamiyama, and K. Okanoya, “Relations Between Musical Structures and Perceived and Felt Emotions on JSTOR,” pp. 407–417, 2013.
[66] P. Ekman and W. V. Friesen, “Constants across cultures in the face and emotion.”Journal of Personality and Social Psychology, vol. 17, no. 2, pp. 124–129, 1971.
[67] L. Schomer and F. Lopes de Silva, Eds.,Niedermeyer’s electroen-cephalography: Basic principles, clinical applications, and related fields, 6th ed. Lippincott Williams & Wilkins, 2011.
Ian Dalyreceived the M.Eng. degree in Com-puter science and the Ph.D. degree in Cyber-netics from the University of Reading, Reading, U.K. Between May 2011 2013 he was a post-doctoral researcher in the Laboratory of Brain-Computer Interfaces, Graz University of Technol-ogy, Graz, Austria, where he researched Brain-computer interfaces (BCIs) for individuals with stroke and cerebral palsy. He then worked as a post-doctoral researcher in the University of Reading from 2013 to 2016 before joining the department of Computer Science and Electronic Engineering, University of Essex in 2016 as a lecturer within the Brain-computer interface and Neural Engineering group.
His research interests focus on BCIs, nonlinear dynamics, machine learning, signal processing, bio-signal analysis, meta-heuristic search techniques, and connectivity analysis in the EEG and fMRI. He is also interested in the neurophysiological correlates of motor control, emotion, and stimuli perception and how they differ between healthy individuals and individuals with neurological and physiological impairments.
Duncan Williamsholds a PhD in Psychoacous-tics and Digital Signal Processing from the Uni-versity of Surrey, UK. From 2012-2017 he was a Research Fellow in the Interdisciplinary Centre for Computer Music Research, Plymouth Univer-sity, UK, and from October 2017 a researcher in the Digital Creativity Labs, University of York, UK. He is a member of the Audio Engineering Society and a fellow of the Higher Education Academy.
Asad Malikis currently working on in his PhD in Cybernetics at the University of Reading, UK. He received the BSc (Hons) degree with a double major in Mathematics and Computer Science from the Lahore University of Management Sci-ences, Pakistan, and the MRes degree in Com-puter Music from the University of Plymouth, UK.
James Weaverreceived his BSc in Biomedical Engineering and Cybernetics in 2012. His the-sis focused on predicting epileptic seizures by analysing EEG data and applying a variety sig-nal processing techniques. His PhD in Computer Science focused on developing a brain computer interface (BCI) that can estimate the emotional state of an individual whilst they listen to emo-tionally charged music. Through analysis of joint EEG/fMRI recordings, this research attempted to model these emotions so that the BCI system can successfully alter the emotional state by changing the parameters of the musical stimuli presented.
Alexis Kirke is senior research fellow at the Interdisciplinary Centre for Computer Music Re-search at the University of Plymouth, UK. He received a BSc in Mathematics from University of Plymouth, a PhD in Computing and a PhD in Arts at the University of Plymouth. His research areas focus on applications of the arts to AI / HCI, and applications of multimedia to mental health.
Faustina Hwangreceived the BEng and MEng degrees from Memorial University of Newfound-land, Canada and the PhD from the Engineer-ing Design Centre, University of Cambridge, UK. She is Associate Professor of Digital Health in the Biomedical Engineering Section at the Uni-versity of Reading, UK and Associate Editor of the ACM Transactions on Accessible Computing. She is a member of the IEEE.
Eduardo Mirandais composer and AI scientist working in the fields of Brain-Computer Music Interfacing, Evolutionary Computing and Uncon-ventional Computation. He received a PhD from University of Edinburgh and served as a re-search scientist at Sony in France before moving to Plymouth University in 2003, where is Pro-fessor in Computer Music and director of the Interdisciplinary Centre for Computer Music Re-search.
Slawomir J. Nasutois the Lead of Biomedical Engineering Section, School of Biological Sci-ences at the University of Reading, UK. He is the Director of the Brain Embodiment Laboratory. He received the MSc degree in Pure Mathematics from the University of Maria Curie-Sklodowska in Lublin, Poland and the PhD in Cybernetics from the School of Systems Engineering, University of Reading, UK. He is Professor of Cybernetics and the Associate Editor of the Research on Biomedical Engineering Journal.