Munich Personal RePEc Archive
Russian policies in support of innovation:
elusive quest for efficiency
Simachev, Yuri and Kuzyk, Mikhail and Feygina, Vera
Interdepartmental Analytical Center
January 2014
Online at
https://mpra.ub.uni-muenchen.de/56750/
Russian Policies in Support of Innovation: Elusive Quest for Efficiency
Yuri Simachev, Mikhail Kuzyk, Vera Feygina Interdepartmental Analytical Center
Focused on the efficiency of the Russian innovation-fostering policy, the research is based on an empirical analysis of how policy instruments impact firms‟ behavior. The data is obtained from two surveys of more than 600 Russian industrial companies in 2011-2012.
The analysis shows that tax incentives are more conducive to innovations with a longer payback period, whereas public funding is more likely to facilitate launching new innovative projects. At the same time, both kinds of innovation support tools are affected by crowding out private funds by public ones. Besides, innovation policy design and administration are not friendly to young companies.
Keywords: innovation, firm behavior, tax incentives, public subsidies and grants, evaluation of government innovation policy
JEL Classification: L20, O31, O32, O38
The study is supported by the Ministry of Education and Science of the Russian Federation
In the recent decades, in the context of globalization and increasing international competition, national governments pay more and more attention to fostering innovation in order to compensate for market failures, system failures, and failures in the ability to absorb new knowledge. There is a wide range of innovation-supporting instruments: tax incentives, public funding, institutes for development, etc. However, the issues of efficiency and advisability of different support policies are crucial, especially in the situation of budget constraints. It is necessary to choose innovation support policies that would be efficient enough while not tangibly distorting the market environment.
Progress in learning new innovation support mechanisms and their application in Russian innovation policy has become apparent in the last few years1. Nevertheless, experience both positive and negative experience of earlier-introduced support policies application is largely neglected when new policies are being designed. Moreover, expert discussions of improving public spending efficiency and development of the Russian tax system have demonstrated that the debate of the pros and contras of different approaches to innovation still brews in Russia, even at a very high level of generalization, e. g., when comparing tax and financial incentives.
For all its multidirectionality, the innovation policy realized by the state still lacks one necessary attribute: regular independent progress evaluation. Although there is a general practice of macroeconomic evaluation of budget losses and short term benefits from the use of innovation support policies, there is no integrated system of analyzing the impact of different support mechanisms on innovation development at the micro level, such as change in companies' behavior, shifts in preferences of major stakeholders, developments in cooperation with research institutions, and increasing learning capacity.
In this context, the main objective of our paper is a micro-level study of how support mechanisms impact companies' innovative behavior. We also evaluate effectiveness of tax and direct tools to support innovation and compare positive and negative effects of these policies' application.
1.
The research agenda: main questions and hypotheses for empirical
testing
The general agenda of the study is determined by the sequence of six questions:
(1) To which extent increase in firms' productivity is connected to their innovation activity?
(2) How does state support of innovation impact the quality of firms' innovation activity?
(3) What companies receive state support for innovation more often?
(4) How does the system of state-business relations affect allocation of state support?
(5) What is the difference between how financial and tax incentives influence
companies' innovation activity?
(6) What accounts for the costs of companies' access to innovation support
incentives?
Regarding the above-mentioned questions, we have put down several propositions for further empirical testing:
1) To what extent firms' productivity growth is related to their innovation activity? What are the basic parameters that determine increase in productivity?
We initially assume that there is a general positive correlation between innovation activity of a firm and its increased competitiveness, in particular, the increase in its productivity. However, this recognition of innovation influence does not exclude the possibility that certain firms can find other ways to maintain their competitiveness, of which classical examples are: a firm's abuse of its market monopoly (Bogetic, Olusi, 2013), lobbying, receiving state support (not necessarily for innovation) by ineffective companies considering their social importance. Due to this circumstance, firms of significantly disparate productivity are allowed to exist in the same market for fairly long time. Extremely high heterogeneity of firms in terms of productivity, both within and between industries, has been highlighted in a study of the European Central Bank (Giannangeli, Gomez-Salvador, 2008). Such imbalances are also observed in the Russian economy, and lack of staff turnover is pointed to as a major impediment to equalizing productivity levels among enterprises (Bessonov et al., 2009)
Since technological level of Russian companies is largely below the level of foreign competitors, borrowing technology through the acquisition of new equipment should prepare a significant jump in productivity growth (Mckinsey Global Institute, 2009). Imitational development involves lower risks, is characterized by significant training effects and often interpreted as a first step in the transition to innovation economy (Mukoyama, 2002).
Proposition #1. The majority (most probably, the great majority) of companies who have recently increased their productivity are innovatively active. The increase in productivity is first of all determined by the firms' investment in new equipment.
2) What is the role of state support in companies' ability to innovate? What indicators of companies' performance are significantly improved thanks to their use of state support?
Many authors recognize the importance and effectiveness of state support of innovation (Goldberg, Gobbard, Racin, 2011; OECD, 2011). At the same time, they also point to problems and risks associated with state intervention. State support of innovation is important in terms of fostering change in companies' behavior, but there are quite significant lags in improving outcome indicators of innovative firms and their competitiveness (Lopez-Acevedo, Tan, 2010; Roper, Hewitt-Dundas, 2012; Shin, 2006). We suggested that, for a considerable number of companies, the risks of using state support are rather high. Costs associated with obtaining support, such as more frequent inspections and commitment to price regulation, have been confirmed empirically (Frye, 2002). These risks incite well-to-do companies to innovate without state support.
Certainly, there are risks of rent-seeking behavior of companies receiving state support. We can expect that companies interested in getting rent will not be strongly motivated to make effective use of acquired resources. Meanwhile, the state in the situation of asymmetrical information faces the difficulty to evaluate business efficiency and has to focus on more transparent and easily observed indicators, such as the volume of new products or export. Thus programs of direct public funding in New Zealand have had a positive effect on the dynamics of recipients' sales dynamics, but did not affect productivity and value added (Morris, Stevens, 2010).
Hypothesis #2. Significant number of companies innovate without state support while achieving great success in improving their performance (productivity and profitability). At the same time, state support of innovation stronger promotes improvement of output indicators in volume terms (amount of the revenue, volumes of new products and export).
3) What companies receive state support for innovation more often?
Increased share of large enterprises among recipients of state support witnesses about the reluctance of the state to risk (Garcia, Mohnen, 2010). It is clear that a small number of large recipients instead of a great number of small ones reduces transaction costs of funds allocation and simplifies control of their use. Besides, the proximity of big business to the state allows lobbying for additional financing.
It is known that large enterprises innovate more often, so bias towards supporting big business ensures a pseudo-positive result necessary for reporting. At the same time, many
empirical studies (see, for example, Lööf, Hesmati 2005; Wanzenbock, Scherngell, Manfred, 2011) indicate that positive impact of external financing is significantly higher on small enterprises, since they make more efficient use of the funds, and their behavior is more sensitive to external financing.
In Russia, the tendency to support big business has additional grounds, specifically, social ones: concentration of labor at large strategic enterprises compels the state to pay them more attention (Simachev, Kuzyk, Kuznetsov, 2010). Furthermore, the anti-crisis measures to reduce tensions in the labor market were continued after the main phase of the crisis had ended (Zubarevich 2010).
Another possible distortion in the implementation of the state innovation policy is excessive support of partially state-owned companies. Interaction with such companies decreases uncertainty for decision-makers providing state support. Besides, public companies may have better skills of interaction with authorities.
Hypothesis #3. Companies likely to receive state support of their innovation are: (1) big, (2) partially state-owned.
4) How does the model of state-business relations influence allocation of innovation public funding?
The system of business-state relations is the most important element of the national business climate, which in turn has a decisive influence on companies' innovative activity (RSPP, 2011). The nature of this influence is not so obvious. On the one hand, state intervention in economy significantly distorts parties' motivation. On the other, the necessity for the state to support generation of new knowledge, promote connections among different actors, develop coordination mechanisms, and create search network for the innovation are generally recognized.
fact of companies' receiving public support may give rise to their informal commitments before the state (Simachev, Kuzyk, 2012). These commitments may limit companies' capacity to increase their efficiency and choose direction of their innovation, which in turn may reduce effectiveness of state support. We suppose that, due to the selective nature of state support, receiving direct public funding by companies will more often associate with the 'support in exchange for behavior' relationship pattern.
Hypothesis #4. The pattern of business-state relationship is one of significant factors of companies' having (or lacking) state support of their innovation; in addition, (1) the less the government directly demands from business – the fewer the facts of state support are; (2) the model of direct exchange of commitments will more often be associated with receiving financial support by a business than the use of tax incentives.
5) What are the features of tax and subsidies’ effect on companies' innovative behavior? What are the advantages and disadvantages of their use as part of the state innovation policy?
Tax and financial innovation incentives vary significantly in their effect on business. Direct public funding measures suggest that sharing risks between business and the state reduce the degree of uncertainty. Direct funding may push a company to realize new projects. Equally important, reduced risks extend the planning horizon, resulting in initiated projects with a longer payback period that would not be implemented in the absence of public funding.
Tax incentives, by contrast, primarily stimulate investment in already-launched projects (Guellec, Van Pottelsberghe, 2000; Jaumotte, Pain, 2005). Redistribution of benefits in favor of ongoing projects serves to accelerate their completion or increase return on investment. Lastly, tax incentives may contribute to implementation of projects with lower rate of return (Köhler,
Larédo, Rammer, 2012).
Differences between the two groups of innovation incentives are not limited by the features of projects they support. The neutrality of direct funding measures to the characteristics of company tax structure and the possibility to grant targeted and selective support thus lowering the recipients' risks (see Berube, Mohnen, 2007) have at a reverse side of the coin the problem of supplanting private expenses by the public ones, or the crowding out effect.
deliberately selecting successful projects that would have been implemented even without external involvement (David, Hall, Toole, 2000).
Since tax incentives directly affect the marginal cost of research, the crowding out effect in the case of their use is far less pronounced, and public spending on tax policy eventually pays off by additional investments by businesses. For example, it has been noticed that a ten-percent reduction of R&D costs may in the long run lead to a growth of over 10% (Bloom et al., 2002).
Hypothesis #5. Tax incentives and financial support have a different effect on companies' innovation: (1) financial incentives more than tax benefits reduce risks and contribute to the launch of new innovative projects; (2) at the same time, the problem of supplanting of private funds by the state ones is more typical for financial incentives.
6) What are the costs of companies' access to innovation support mechanisms, and how do the main problems and application risks of financial and tax incentives relate to each other?
To compare advantages and disadvantages of innovation support mechanisms, it is not only necessary to analyze their influence on companies' behavior but also to evaluate main problems (risks) associated with the use of these mechanisms. Contractors demand for the public support of innovation can be largely limited by deficient performance tuning and faulty design of these measures, as well as by unfriendly administration.
Specific advantages of a support policy in its influence on business almost always entail high costs and objective difficulties of its administration. For example, one of the major utilities of tax incentives is expressed in the principle of 'neutrality,' when decision to support is taken automatically if applicant meets formal criteria known in advance (OECD, 2002), but it also increases the risks of benefits misuse.
Another factor that is important to take into account when evaluating access to support mechanisms is the deterring effect. As it was earlier shown in the example of Spanish firms, many firms give up launching innovative activity because of overestimated expectations about
upcoming challenges (D‟Este et al., 2012). In Russia, the problem of distortion of real problems
Hypothesis #6. Perception of problems and risks of use of innovation support mechanisms that is dominant in the business environment is more negative compared to the real situation. This trend is responsible for the significant deterring effect that discourages businesses to use support mechanisms.
2. Methodological approach: initial data, features, and limitations
This research is based on the microeconomic data obtained from surveys of companies' senior executives. The use of surveys for economic analysis has become fairly widespread in Russia. This approach has both its advantages and drawbacks, which we are not going to discuss in detail, since fortunately they have already been systematically examined (Dolgopyatova, 2008). Suffice it to say that surveys provide significant opportunities to evaluate how diverse state policies affect behavior of economic agents (see, for example, (Gershman et al., 2004), (Zasimova et al., 2008), (Sushkevich, Avdasheva, Markin, 2013)).
In this paper, we have focused on the advantages of using surveys of companies' senior management in order to reveal behavioral changes, motivations, and limitations of decision-making at the enterprise level. We regard the possibility to assess characteristics of beneficiaries and effects of implementation of different state policies as especially valuable.
The empirical base of the research is comprised of two formalized questionnaire polls of Russian industrial enterprises conducted in September-October 2011 and August-September 20122. In the first case, the sample consists of 602 companies, and of 652 in the second, while the panel includes 415 companies (Appendix Table 1). Sampling of enterprises was determined by quotas of companies representing manufacturing industries.
The originality of this research is, as we see it, in the following:
(1) comparing different phases in the dynamics of companies' innovation activity, while distinguishing the following enterprise groups: those with no innovations; those who started to innovate over the past three years; those whose innovations are being continued; those whose innovations have been ceased in the past three years.
(2) more sophisticated analysis of change in competitive environment, compared to the typical 'insider/outsider' approach. In the past few years, partly due to intensive learning process, the differences in businesses' competition with domestic and foreign firms have gradually diminished. Thus the respondents were asked to evaluate the competition conditions in this
extended circle of economic agents: old Russian firms, new Russian firms, Russian divisions of foreign firms, and foreign firms.
(3) analyzing the impact of innovation support mechanisms not only on output parameters, such as changing values of production and export and manufacturing new products, but also on changing companies' innovative behavior, choosing in-house innovation strategy (e. g., switching to the implementation of longer-term innovative projects, launching new projects, etc.);
(4) comparing gains in the mechanisms of innovation state support with possible typical risks (e. g., the crowding out effect), analyzing problems of companies' access to support mechanisms and administration of their implementation.
It is necessary to pay attention at some significant limitations of this research3.
First. We have examined companies' technological innovation only. Let us note that in research on economically developed countries, innovations support policies are most often analyzed narrowly, concerning their encouraging companies' R&D spending. We have regarded not only R&D-related incentives but also mechanisms promoting investment in new equipment.
Second. Certainly, comparing between two basic groups of policies, i.e., tax and subsidies, is a significant shortcut. However, even these generalized groups differ fundamentally by a number of criteria, e.g., universality or selectivity of choice, spending- or project-based approach, and indefinite or fixed duration of support.
3. Results of empirical study
3.1. Companies' productivity growth: innovation, imitation, or optimization?
Growth of labor productivity is a good indicator of company's development and transition to more efficient production. However, there are different ways to increase productivity. It might be the active strategy of boosting business competitiveness via its modernization, shifting to advanced technologies, staff training and development. Otherwise, it might be a passive, dilatory tactic associated mostly with cutting costs and intensification of labor.
We have chosen the logarithm of worker efficiency as an indicator of labor productivity. Given the pronounced distinguishing features of each industry, we have differentiated three groups of enterprises within each industry by the level of productivity: low, medium, and high. We have thus received the opportunity to group sample enterprises by the relative measure of performance. Based on the panel data, we have selected a group of enterprises that in 2011
demonstrated higher values of relative efficiency compared to 2010 (the share of these enterprises in the sample is 42%).
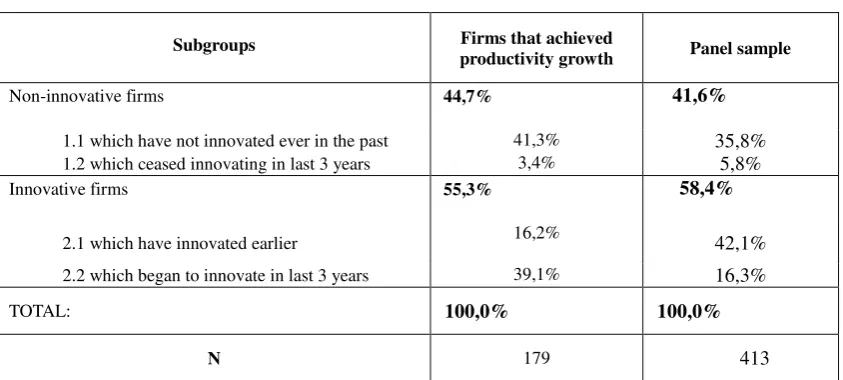
So how does the increase in productivity relate to company innovation? Our findings seemed unexpected to us (Table 2 of Appendix): among enterprises who demonstrated positive dynamics in their productivity, just every second one innovation!
At the core of the first – innovative – subgroup of enterprises with growing efficiency are successful young companies, exporting, and growing companies. Productivity growth of these companies is associated first of all with increase in turnover and increased investment in fixed assets. Notably, a significant share of this innovative subgroup is comprised of enterprises who have recently started to innovate. A noticeable increase in these firms' productivity can be attributed to the beginners' effects of transition to the innovative development strategy.
Regarding the second – non-innovative subgroup (which has also achieved increased productivity) – we could note that its representatives more often mentioned unfavorable financial situation, technological inadequacy, and lack of export. Companies of the non-innovative subgroup are characterized mostly by personnel cuts they have experienced.
Regression analysis that we conducted (it included several specifications: see Table 3 of Appendix) showed that increase in productivity is observed mainly in the group of relatively small companies (with staff of up to 250 employees). We have confirmed our initial observations: innovative companies have been mostly focused on investment in fixed assets. Notably, the level of spending on innovation does not affect the variable in question. Companies that had nothing to do with innovation have increased their productivity first of all by way of cutting their staff.
Obviously, if during the economic crisis companies' efforts to reduce their staff were actively checked by the government in order to maintain social stability, then certain easing of these restrictions after the crisis could further push companies to optimize their labor costs. In effect, this optimization became an available alternative to innovation on the way of maintaining business competitiveness.
3.2. State support of companies' innovation: is there a new quality?
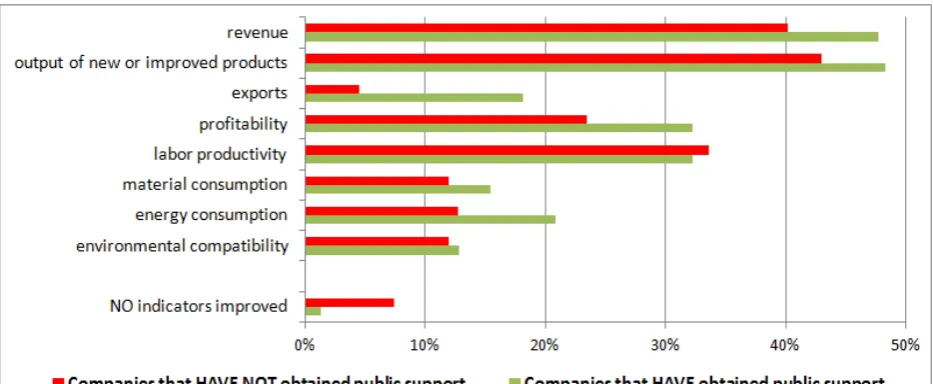
Figure 1. Improvement of companies' operation characteristics due to technological innovation in the past three years (frequency of responses of innovative companies' administrators)
Most common effect of innovation is the increased output: both total and innovative one. Innovation markedly more rarely affects performance indicators: only in about a third of cases, technological innovation brings about an increase in productivity, and in a quarter – profitability improvement. Of course, we can assume that initially, different goals were set at the start of innovative projects, which resulted in higher prevalence of some effects compared to other.
Be that as it may, the central question for us is not innovation particular effects, but what effects go more often with state support. In the analyzed sample, over a third of innovative firms are consumers of various instruments of state innovation support.
In general, among state support recipient companies, the situation is almost always improved due to innovation, at least as reflected some output indicators. This could be definitely attributed as well to the respondents' striving to report on the progress made; we suggest, however, that our use of subjective statistics and meeting anonymity requirements have largely reduced this risk of bias.
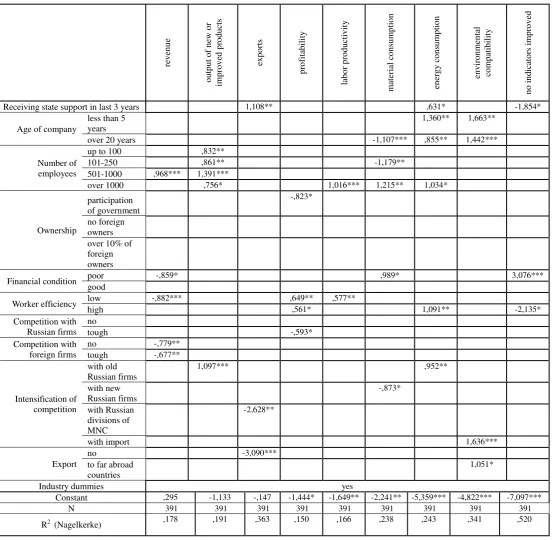
To evaluate effects of state support on innovation outcomes more accurately, we have conducted a regression analysis that let us significantly limit the effects of company selection for state support and government preferences. Results of this simulation allow us (Table 4 of Appendix) to come to two basic conclusions: on the one hand, companies who have been receiving support in recent years are likely to demonstrate at least some positive change, in terms of the parameters under consideration; on the other, significant positive correlation with obtaining state support has been revealed only in two characteristics of company performance:
their efficiency better without state support has not been confirmed: availability (or absence) of state support by no means affects productivity growth.
In general, the impact of state support for the majority of indicators considered is very
weak, so we believe it is important to examine a more conspicuous influence of companies' own
parameters and the quality of external environment on the effectiveness of innovation.
First, growth of volume indicators affected by innovation is typical for relatively large companies (500-1000 employees), regardless of whether or not they have state support. Apparently, small Russian companies are not motivated to increase their scale: it is likely that for them, the increase is associated with significant risks and costs due to the insufficiently favorable business environment, which has been repeatedly noticed in many studies in Russia.
Remarkably, companies demonstrating increase in total revenue following innovation are more often in optimal competitive conditions with foreign producers: among them, such competition is rarely non-existent or too strong; besides, companies are pushed to develop and extend output of new innovative products by stronger competition of old Russian firms.
Secondly, positive dynamics of all indicators of resource efficiency – materials and energy consumption and labor productivity – are more common in large companies. Perhaps this is because these companies are more resource intensive, characterized by excessive employment, and the main subject of non-market influences, including informal ones by government officials. Third, improvement of energy efficiency and environmental friendliness is conventional for either relatively new companies or otherwise old enterprises created in the Soviet times. For young companies, this relation can be determined by initially high susceptibility to advanced technological solutions, whereas for the 'Soviet' ones – by their severely outdated technologies and subsequently the low base effect. In fact, it is no coincidence that gain in energy efficiency due to innovation is standard for companies who have encountered increased competition of old Russian enterprises. As for the environmental friendliness, this result of innovation is noticeable in companies who have confronted growing competition of foreign firms, e. g., when exporting to distant foreign countries (not of the former Soviet Union, or FSU).
In general, we can track different strategies of companies' innovation that are hardly influenced by state support and much stronger – by the companies' size, as well as the status quo and change in competition.
3.3. What firms become recipients of innovation state support more often: the needy or the deserving ones?
Interpretation of the innovation state support membership doesn't look like a trivial task at all. Indeed, what is better and righter, in terms of public objectives: to support a rather effective firm by additional resources and thus ensure the resources' efficient use, or allocate funds to a firm that is just starting to innovate while switching it to the innovative mode, but at high risks of failure and loss of funds? We can hardly arrive at somewhat unequivocal answer, given the system of rough evaluations available to us, but still the question as such is interesting:
is state support of innovation in Russia a bonus to the best or a chance to stragglers?
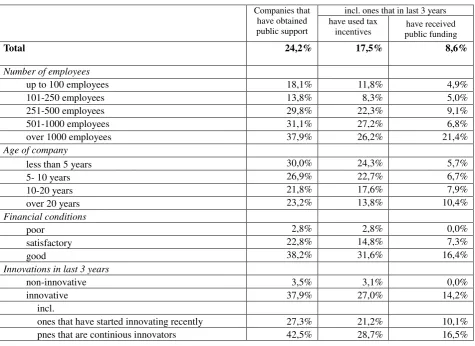
Let us scrutinize what companies have become recipients (users) of innovation support mechanisms, including tax incentives and special purpose funding. Descriptive statistics (Table 5 of Appendix) witness about a certain shift of innovation state support in favor of big business. Regarding company age, there is a bias of tax incentives towards younger firms, whereas financial support is oriented at more mature companies.
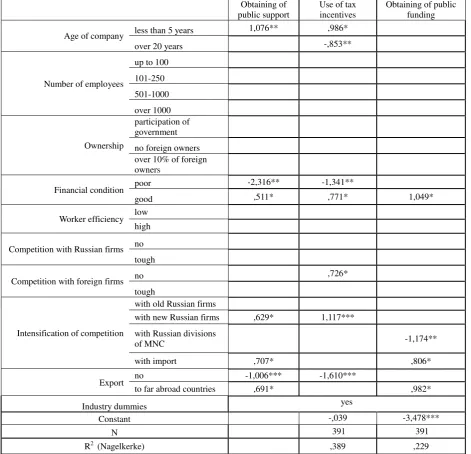
Regression analysis (Table 1 of Appendix) has not confirmed our hypothesis about the preferential position of big business in obtaining state support. Neither have we found proof of the argument that state participation in companies' capital raises their chances to receive support. In the recent years, well-off and exporting companies (first of all, those exporting to the non-FSU countries) more often became beneficiaries of state support of their innovation. Thus,
state innovation fostering instruments are more oriented at successfully operating companies rather than at 'outsider' firms.
Companies created in the last five years and, more rarely, enterprises that started operation in the Soviet era are significantly more often represented among consumers of innovation tax incentives. Apparently, this is a consequence of a wide use by new firms of bonus depreciation (a one-time write-off of part of new equipment cost) in their generation and development of production base.
exactly of companies' preferences, this case would be also common for Russia: representatives of young Russian companies are more often interested in obtaining direct public financing as part of innovation policies (Ivanov, Kuzyk, Simachev, 2012). Preferences and access to the support, though, are not the same thing, naturally. Costs of access to financial support mechanisms in Russia can be quite high for young firms who do not have developed connections in the system of government agencies.
The use by companies of tax or financial support mechanisms is heavily dependent on the change in the competition. Apparently, although both the costs of state support use are significant and the instruments themselves are not very friendly to companies, but growing competition urges firms to use state innovation fostering instruments. Thus the use of tax instruments is characteristic for companies in the situation of growing competition with new Russian makers, while enterprises that face stronger pressure of import more often receive direct public funding. The first relation: tax incentives vs. pressure of new Russian companies is probably due to the fact that it is precisely new companies who more often than others resort to the use of tax incentives, so we can suppose that there is the training effect and competition for the best tax regime. As for the financial support vs. import pressure relation, it is likely that it manifests the state's propensity to protect national companies from external competition, doing it in various ways. Besides, this relation has also to be the consequence of the concepts of the necessity to support import substitution and expand domestic demand that are especially popular in Russia.
3.4. Models of building business-state relations: help in exchange for the right behavior? We found it logical to suppose that the practice of providing state support to companies should be connected with the existing common model of business-state relations. We also suggested that the state's being friendly to the support recipients, the justice and transparency with which it conducted selection of companies to be granted support were the important elements contributing to the motivation of conscientious companies to use state support.
To characterize the system of business-state interaction4 (at the federal level), we have determined six conditional models (Table 7 of Appendix), among which first two models are
partnership ones, two following models imply social and political responsibility, the fifth model is oriented only at the state's fiscal interests, and the sixth model suggests non-interventionism by the state while maintaining formal enforcement of regulations in the business environment. It is precisely the last models that are massively represented in the sample: models defined as indifference of the state to business (40% of companies) and as interest in business only as a source of income (29%).
Let us assess correspondences among the models of business-state relations and use (receiving) of state support, based on regression analysis (Table 8 of Appendix). First thing to be pointed to: the specified models of business-state relations are, as it has turned out, significantly related with the use (or, alternatively, non-use) of public support for innovation. Within relationship models in which the state does not attempt to influence business behavior, companies are significantly less likely to use any instruments of public support for innovation. We cannot, however, assert what in this relationship comes first: is it that state support is more targeted at companies responsive to the needs and requests of government representatives, or, instead, is it that, after companies have already obtained support, government officials get greater opportunity to control their behavior and bargain on some special 'game rules.'
Second. Positive correlation between the model of political loyalty and availability of state support for a company could be regarded as logical, but expression of this relationship through the use of tax incentives requires additional scrutiny. Perhaps politically loyal owners regard their business sufficiently protected from all kinds of inspections, including tax ones, but this is only a supposition.
Third. However unexpectedly, companies from whom the state expects social responsibility seldom become beneficiaries of innovation state support. Another disappointment (purely a researchers' one) to be pointed out: due to the selectivity of direct financial support and hence inescapable subjectivity of decisions, we supposed initially that companies acting by the social responsibility model can more than others count on getting this support. However, we obtained the opposite result. Perhaps whenever the state really needs the exchange, in particular for companies' social commitments, there are more convenient mechanisms for this purpose (rather than those related to fostering innovations), e.g., public procurement or providing support via specialized state-controlled banks.
3.5. Impact of state innovation fostering policies on companies' innovative behavior: can one choose the better between tax incentives and financial support?
practices. While discussing the impact of state support on companies' innovative behavior, we examined the latter in terms of possible effects, in particular the change in innovative projects' parameters (increase in implementation terms and financial scale), changes in the use of resources (attracting additional private resources or release of funds for other business areas), reduction of innovation risks and ensuring commercialization of R&D operations (Fig. 2).
Figure 2. Impact of state policies on companies' innovative behavior (frequency of responses of recipient companies' administrators)
Considering descriptive statistics, we can see that, on the one hand, the proportion of respondents who reported the absence of any positive impact of state support on company innovation is very small: at the level of 10% in the group of companies who received public
support. On the other, the most common effect of innovation support mechanisms is positive for
companies but negative concerning the results of public innovation policy, i. e. the release of company funds for other development areas. This is nothing else but the effect of replacement of
private funds with public ones (the „crowding out‟ effect).
Comparing impact of different innovation support mechanisms, we can see that the crowding out effect is significant not only in financial support mechanisms, but also in tax incentives. This finding is in tune with results obtained earlier in the study (Lokshin, Mohnen, 2012), which pointed out significant presence of crowding out effect when tax incentives were used.
Let us proceed to the results of regression analysis (Table 9 of Appendix). First, crowding out private funds by the public spending is observed more often in old companies (20 years old
0% 5% 10% 15% 20% 25% 30% 35%
Due to public support new promising innovative project have been launched
Public support allowed for implementation of more valuable projects
Public support allowed for implementation of projects with a longer payback period
Public support helped to mitigate risks of innovation
Public support helped to attract private financing for innovation
Public support helped to commercialize R&D
Public support allowed for redirecting of
company’s finances to other activities
Public support has had no influence on company’s
innovation activities
or older). Usually these companies have many diverse pending problems; hence innovation for them is far from being the only field to invest in. Furthermore, we can assume that these companies have had more frequent chances to use non-innovative ways to ensure their competitiveness, in particular by way of lobbying and receiving direct public funding thanks to their social importance.
Interestingly, the effect of state support associated with realization of bigger projects that is to some extent inverse to the crowding out effect is typical for partially state-owned companies. Perhaps state officials pioneer expansion of innovation in these companies (the known and popular logic of forcing public sector companies to innovate), and besides, as noted in Russian and foreign studies, representatives of the state, due to information asymmetry, usually pay more attention at simple and clear indicators, such as those associated with the growth of spending on innovation.
Second, public funding significantly more often induces initiation of new projects, while tax incentives are more helpful in launching projects with longer payback period. This result in its first part is analogous to the relationship revealed in (Guellec, Van Pottelsberghe, 2000) study on EU countries. It is clear that, in view of the way public support mechanisms are organized, usually based on projects' competitive selection under certain conditions, these mechanisms often instigate the need to create a new project (or re-format an existing one). But the fact that it is tax incentives and not public funding that contribute to companies' realization of longer-term projects seemed unexpected and requiring further explanation. We believe that this relationship is not due to special aspects of tax incentives but rather reflects the undeveloped state of Russian mechanisms of innovation public support, especially regarding the very strict deadlines for supported projects (usually no more than three years).
3.6. Costs of companies' access to innovation state support and risks of its use: are practitioners always pessimists?
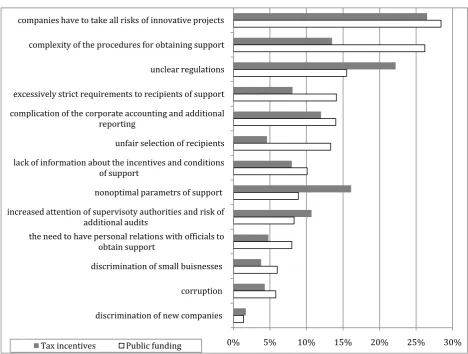
According to descriptive analysis data (Fig. 3), profiles of both tax and fiscal incentives' major problems differ significantly: the use of tax mechanisms is clearly stronger limited by obscure regulation and deficient support parameters (such as the value of benefits), while public funding is more impaired by the complex procedures of obtaining support, overly stringent requirements for recipients (applicants), and insufficient justice of selecting the latter.
Figure 3. Flaws of tax and financial instruments of innovation state support – frequency of responses
To reveal the deterring and underestimated problems of support mechanisms use, we have used regression analysis where the main explaining variable was the fact whether a company has or has not used a state support mechanism (Table 11 of Appendix). The analysis let us make the following clarifications and additions.
First, our hypothesis that theoreticians are more pessimistic has been partially confirmed. For example, the problem that all risks of innovative projects implementation have to be faced by an enterprise even when it has state support is regarded as much less important by practitioners,
no matter if they used tax or fiscal incentives. In addition, representatives of companies that did not use financial support were more critical about the vagueness of relevant legislation.
0% 5% 10% 15% 20% 25% 30% companies have to take all risks of innovative projects
complexity of the procedures for obtaining support
unclear regulations
excessively strict requirements to recipients of support
complication of the corporate accounting and additional reporting
unfair selection of recipients
lack of information about the incentives and conditions of support
nonoptimal parametrs of support
increased attention of supervisoty authorities and risk of additional audits
the need to have personal relations with officials to obtain support
discrimination of small buisnesses
corruption
discrimination of new companies
Second, it would be wrong to argue that practitioners are less concerned about all the mentioned problems. On the contrary, they can see even better deficient parameters of tax incentives and excessively stern requirements to the structure of allowed spending when using public funding. Apparently, practitioners are especially disappointed in limited value of tax benefits and inflexible usage of public funding.
Third, we have found that the difficulties of support mechanisms usage vary significantly in groups of young and old enterprises. For example, costs of complicated enterprise accounting are more significant for young companies, whether using tax benefits or public funding.
While representatives of old companies (more than 20 years old) are less critical to the parameters of tax instruments, they are also less troubled by the problem of overly stringent requirements to potential tax beneficiaries. Therefore, tax incentives better conform by their design and terms of access to the needs of old business.
4. Discussion of obtained results
1. Our research sample results have not confirmed our initial hypothesis that innovative activity is the major factor in labor productivity growth: a half of companies whose productivity has increased have had nothing to do with innovation. While innovative enterprises have increased their output thanks to investing more in renewal of their production capacities, the group of non-innovative enterprises achieved the same result by cutting their staff. We suggest that excessive employment has been due to limitations imposed on business during the crisis. Labor costs optimization has become possible for companies after the main phase of the crisis ended.
We can suppose that the remaining narrow circle of innovatively active companies in the post-crisis period is the consequence of former forced limitations to optimize business. When these limitations were eased, companies received other-than-innovation opportunities to maintain their competitiveness – to cut staff in particular. Choosing this path can be also the result of personnel low cost and value for innovatively passive and technologically underdeveloped companies: they do not need special skills; neither they invest much in human capital development.
support only in increasing export volume and energy efficiency. However, we have noticed no impact of state support availability or absence on firms' productivity growth.
As we can see, the factor of state support alone is rather neutral for company performance and especially for the efficiency of its innovation – the quality of company's innovation is much more influenced by competitive environment. Enterprises are driven to expand manufacture of new products by growing competition with old Russian firms which, consequently, exhausts their potential to improve traditional products.
3. Sufficiently well-off and exporting companies are likely to become beneficiaries of innovation state support. Obviously, the latter is oriented at the successful companies and is not associated with the help to outsider or, alternatively, insider (partially state-owned) firms. This conclusion, however, does not at all exclude distribution of state support to inefficient firms outside innovation fostering policy.
It might seem quite unexpected that state support more often goes to relatively young companies, but this is the outcome of the existing structure of support mechanisms. Among these, bonus depreciation for investment in new equipment is designed for most massive use; what's more, this incentive is more important for startups intensively building their fixed assets. Active use of tax benefits is to a large extent a consequence of the training effect and competition for the best tax regime with new Russian firms, whereas financial support is more often associated with the growing competitive pressure of import. We believe that the latter trend reflects the authorities' primal concern to preserve jobs and protect interests of domestic producers. These tasks are probably better converted into obtaining financial support from the state than anything else in terms of innovation.
4. Companies' use of state support is largely determined by the established model of their relationship with the state. If the state does not attempt to control business behavior (e. g., demand something from it or restrict it), then the business enjoys significantly less state support of its innovation. It could be argued, of course, that the state curbs provision of support to companies who do not do its assignments, however, it is rather true, judging by a set of attributes, that companies try not to be often put on the spot.
5. According to our analysis of how support mechanisms affect companies' innovative behavior, the most common effect is the crowding out of private funds by the public spending. Moreover, the effect is typical for both public funding and tax incentives mechanisms. We believe that the demonstration effect of innovation state support is rather weak. Furthermore, innovation is in many cases not a single priority for companies who have had received support, and sometimes it rather serves as a mere pretext to receive additional resources.
As we compared the influence of tax and financial incentives on companies' innovation
policy, we found that state financial support brings more results in initiating new projects, whereas application of tax policies has positive correlation with longer-term projects. That the tax incentives rather than public funding contribute to the realization of longer projects is likely a consequence of imperfect design of typical Russian public funding mechanisms, primarily the limited time of project support.
6. Efficiency of innovation state support is significantly impaired by deficiencies of access and risks of use for companies. Sharing risks with the state has been most frequently articulated as most significant problem of state support. This problem has been largely repelling for companies who have not used state support of their innovation; furthermore, it hinders the growth of competition to receive state support.
Companies-recipients of innovation support consider the most critical problem of tax incentives the inadequate benefits' parameters, whereas major drawbacks of public funding for these firms are red tape and complexity of support obtaining procedures. In any case, both the tax and fiscal instruments, due to requirements of additional reporting and complicated accounting, determine higher costs for young start-up businesses. The fact that the design and administration of tax instruments are friendlier to old companies is a natural consequence of that interests of an established business are easier to take into account, it looks more significant to the authorities, and its representatives have better opportunities to influence development and amendment of support mechanisms.
In conclusion, we would like to put forward the following theses for further study and discussion:
(2) innovation may be influenced stronger by improvements in institutional environment, especially development of competition, besides, attempts to amend innovation policy apart from the issues of industrial sectors' organization development can significantly impair possible results;
(3) the choice of an 'ideal' innovation support mechanism is hardly possible: both tax and fiscal mechanisms have their own sets of pros and cons, nevertheless, it is important to actively engage new and young business in support instruments amending discussion;
(4) efficiency of innovation support mechanisms cannot be evaluated only in the short-term
dimension and only in the aspect of volume indicators – it is important to monitor change in companies' behavior, though the latter is quite sensitive to the transparency and predictability of support terms and real distribution of risks.
References
Aschhoff B. 2010. Who Gets the Money? The Dynamics of R&D Project Subsidies in Germany.
Journal of Economics and Statistics (Jahrbücher für Nationalökonomie und Statistik)230 (5): 522-546. Bérubé C., Mohnen P. 2009. Are firms that receive R&D subsidies more innovative?CIRANO – Scientific Publication No. 2007s-13.
Bessonov V.A., Gimpelson V.E., Kuzminov Ya.I., Yasin E.G. 2009. Proizvoditel'nost' i faktory
dolgosrochnogo razvitiya rossijskoj ekonomiki (Productivity and longterm factors of the Russian economy
development). M.: Izdatel'skij dom GU VSHE.
Bloom N., Griffith R., van Reenen J. 2002. Do R&D Tax Credits Works? Evidence from a Panel
of Countries 1979-1997. Journal of Public Economics85: 1-31.
Bogetic Z., Olusi O. 2013. Drivers of Firm-Level Productivity in Russia’s Manufacturing Sector.
Policy Research Working Paper 6571, The World Bank.
Bustom I., Corchuelo B., Ros E.M. 2012. Tax Incentives or Subsidies for R&D? UNU-MERIT
Working Papers 1871-9872.
David P., Hall B., Toole A. 2000. Is Public R&D a Compliment or a Substitute for Private R&D?
A Review of Econometric Evidence. Research Policy29 (4): 497-529.
D‟Este P., Iammarino S., Savona M., von Tunzelmann N. 2012. What Hampers Innovation? Revealed Barriers Versus Deterring Barriers. Research Policy41 (2): 482-488.
Dolgopyatova T.G. 2008. Empiricheskie obsledovaniya predpriyatij: metody i praktika (Firm-level Empirical Serveys: Tools and Practice). Ekonomicheskij zhurnal VSHE2: 239-271.
Effectivnaya Rossiya: proizvoditel‟nost‟ kak fundament rosta. Issledovanie McKinsey Global Institute (Lean Russia: Sustaining economic growth through improved productivity). Per. s angl. 2009.
Fier A., Heneric O. 2005. Public R&D Policy: The Right Turns of the Wrong Screw? The Case of
the German Biotechnology Industry. ZEW Discussion Papers. No. 05-60.
Frye T. 2002. Capture or Exchange? Business Lobbying in Russia. Europe-Asia Studies 54 (7): 1017-1036.
Garcia A., Mohnen P. 2010. Impact of government support on R&D and innovation. UNU-MERIT working paper, Maastricht.
Gershman R.B., Gorst M.Yu., Evdokimenko I.V., Kuznetsov B.V., Simachev Yu.V., Tsukhlo S S.V. 2004. Mikroekonomicheskaya otsenka posledstvij nalogovoj reform s uchetom ozhidaemoj reaktsii
ekonomicheskikh agentov (Microeconomic evaluation of the tax reform effects with due consideration of the economic agents' expected response). V kn.: Mikroekonomicheskaya otsenka posledstvij nalogovoj
reformy. M.: MONF, IKSI, TSEFIR, S.9-154.
Golikova V.V., Dolgopyatova T.G., Kuznetsov B.V., Simachev Yu.V. 2003. Spros na pravo v
oblasti korporativnogo upravleniya: ehmpiricheskie svidetel'stva (Demand for justice in corporate management: empirical evidence). Razvitie sprosa na pravovoe regulirovanie korporativnogo upravleniya
v chastnom sektore. Moskovskij obshhestvennuj fond: M., 229-339.
Giannangeli S., Gomez-Salvador R. 2008. Evolution and Sources of Manufacturing Productivity
Growth. Evidence from a Panel of European Countries. ECB Working Paper Series No 914.
Goldberg I., Gobbard G., Racin J. 2011. Igniting innovation: rethinking the role of government in
emerging Europe and Central Asia. World Bank, Washington DC.
Guellec D., Van Pottelsberghe B. 2000. The Impact of Public R&D Expenditure on Business
R&D. STI Working Paper 2000/4, OECD, Paris.
Ivanov D.S., Kuzyk M.G., Simachev Yu.V. 2012. Stimulirovanie innovatsionnoj deyatel'nosti rossijskikh proizvodstvennykh kompanij: vozmozhnosti i ogranicheniya. (Fostering Innovation
Performance of Russian Manufacturing Enterprises: New Opportunities and Limitations).
Foresight-Russia6 (2): 18-42.
Jaumotte F., Pain N. 2005. An Overview of Public Policies to Support Innovation. OECD Economic Department Working Paper No. 456.
Köhler C., Larédo P., Rammer C. 2012. The Impact and Effectiveness of Fiscal Incentives for R&D. Nesta Working Paper 12/01.
Lach S. 2002. Do R&D Subsidies Stimulate or Displace Private R&D? Evidence from Israel.
Journal of Industrial EconomicsL: 369-390.
Lööf H., Hesmati A. 2005. The Impact of Public Funding on Private R&D Investment. New Evidence from a Firm Level Innovation Study. MTT Discussion papers.
Lokshin B., Mohnen P. 2012. How effective are level-based R&D tax credits? Evidence from the
Netherlands. Applied Economics 44(12): 1527-1538
Lopez-Acevedo G., Tan H. 2010. Impact evaluation of SME programs in LAC. The World Bank.
Mukoyama T. 2002. Innovation, Imitation and Growth with Cumulative Technology. Journal of
Monetary Economics50: 361-380.
OECD. 2002. STI Report: tax incentives for research and development – trends and issues. Paris: OECD.
OECD. 2011. OECD reviews of Innovation Policy: Russian Federation 2011. OECD Publishing. Roper S., Hewitt-Dundas N. 2012. Does Additionality Persist? A panel data investigation of the
legacy effects of public support for innovation. Paper to be presented at DRUID 2012.
RSPP (Russian Union of Industrialists and Entrepreneurs). 2011. Doklad o sostoyanii
predprinimatel'skogo sektora v 2007-2011 godakh (Report on state of business climate at 2007-2011). Shin T. 2006. Behavioural Additionality of Public R&D Funding in Korea. In Government R&D
Funding and Company Behaviour, chap.9, OECD Publishing: 167-180.
Simachev Yu.V., Kuzyk M.G. 2012. Gosudarstvennaya antikrizisnaya podderzhka rossijskikh
kompanij: pomoshh' i ogranicheniya (Government Anti-Crisis Support to Russian Companies: Aid and Restrictions). Zhurnal Novoj ekonomicheskoj assotsiatsii 1(13): 100-125.
Simachev Yu.V., Kuzyk M.G., Kuznetsov B.V. 2010. Otsenka vozdejstviya razlichnykh
antikrizisnykh mer na predpriyatiya obrabatyvayushhej promyshlennosti (Evaluation of different anti-crisis policy tools effects on industrial firms). Ekonomicheskaya politika1: 122-134.
Simachev Yu.V., Kuzyk M.G. 2013. Rossijskaya politika po stimulirovaniyu innovatsij: ehvolutsiya, dostizheniya, problemy i uroki (Russia's Innovation Promotion Policies: Their Evolution,
Achievements, Problems and Lessons). Rossijskaya ekonomika v 2012 godu. Tendentsii i perspektivy. Vypusk 34. M.: Institut Gajdara.
Sushkevich A.G., Avdasheva S.B., Markin M.E. 2013. Sotsiologicheskie metodyv otsenke effectov gosudarstvennoj politiki na primere antomonopol'nogo kontrolya sliyanij (Using Sociological
Methods to Access the Impact of the Public Policy: a Case of the Merger Notification). Sovremennaya
konkurentsiya 2 (38): 3-18.
Wanzenbock I., Scherngell T., Manfred F. 2011. How do distinct firm characteristics affect behavioural additionalities of public R&D subsidies? Empirical evidence from a binary regression
analysis. ERSA conference paper, European Regional Science Association.
Yakovlev А.А. 2005. Evolyutsiya strategii vzaimodeystviya biznesa i vlasti v rossiyskoj ekonomike (Evolution of Business-State Interaction Strategies in the Russian Economy). Rossijskij
zhurnal menedzhmenta 3 (1): 27-52.
Zasimova L.S., Kuznetsov B.V., Kuzyk M.G., Simachev Yu.V., Chulok A.A. 2008. Problemy
perekhoda promyshlennosti na put' innovatsionnogo razvitiya: mikroekonomicheskij analiz. (Problems of Switching Industry to Innovation-Driven Path) Seriya «Nauchnye doklady: nezavisimij ekonomicheskij analiz», №201. M.:Moskovskij obshhestvennuj nauchnyj fond.
Zubarevich N.V. 2010. Regiony Rossii: neravenstvo, krizis, modernizatsiya (Russian Regions:
Appendix
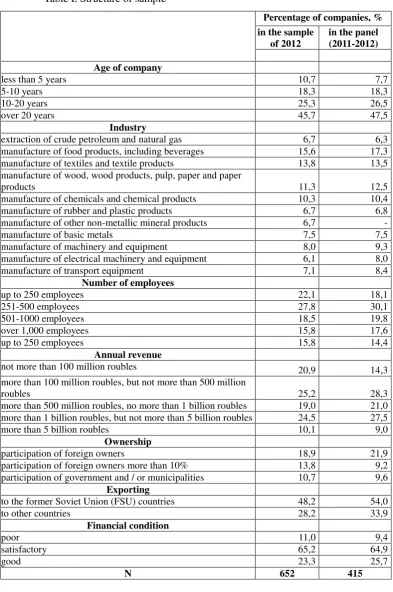
Table I. Structure of sample
Percentage of companies, %
in the sample of 2012
in the panel (2011-2012)
Age of company
less than 5 years 10,7 7,7
5-10 years 18,3 18,3
10-20 years 25,3 26,5
over 20 years 45,7 47,5
Industry
extraction of crude petroleum and natural gas 6,7 6,3 manufacture of food products, including beverages 15,6 17,3 manufacture of textiles and textile products 13,8 13,5 manufacture of wood, wood products, pulp, paper and paper
products 11,3 12,5
manufacture of chemicals and chemical products 10,3 10,4 manufacture of rubber and plastic products 6,7 6,8 manufacture of other non-metallic mineral products 6,7 -
manufacture of basic metals 7,5 7,5
manufacture of machinery and equipment 8,0 9,3 manufacture of electrical machinery and equipment 6,1 8,0 manufacture of transport equipment 7,1 8,4
Number of employees
up to 250 employees 22,1 18,1
251-500 employees 27,8 30,1
501-1000 employees 18,5 19,8
over 1,000 employees 15,8 17,6
up to 250 employees 15,8 14,4
Annual revenue
not more than 100 million roubles 20,9 14,3
more than 100 million roubles, but not more than 500 million
roubles 25,2 28,3
more than 500 million roubles, no more than 1 billion roubles 19,0 21,0 more than 1 billion roubles, but not more than 5 billion roubles 24,5 27,5
more than 5 billion roubles 10,1 9,0
Ownership
participation of foreign owners 18,9 21,9 participation of foreign owners more than 10% 13,8 9,2 participation of government and / or municipalities 10,7 9,6
Exporting
to the former Soviet Union (FSU) countries 48,2 54,0
to other countries 28,2 33,9
Financial condition
poor 11,0 9,4
satisfactory 65,2 64,9
good 23,3 25,7
Table II. Interrelation between productivity growth and innovation activity (on panel sample)
Subgroups Firms that achieved
productivity growth Panel sample
Non-innovative firms 44,7% 41,6%
1.1 which have not innovated ever in the past 41,3% 35,8%
1.2 which ceased innovating in last 3 years 3,4% 5,8%
Innovative firms 55,3% 58,4%
2.1 which have innovated earlier 16,2% 42,1%
2.2 which began to innovate in last 3 years 39,1% 16,3%
TOTAL: 100,0% 100,0%
[image:27.595.86.508.92.282.2]Table III. Labor productivity growth of companies – results of binary logistic regression parameters estimation
Productivity growth of non-innovative companies
Productivity growth of innovative companies
Model 1 Model 2 Model 1 Model 2
Age of company less than 5 years
over 20 years
Number of employees
up to 100 -0,634* 0,721* -0,871*
101-250 1,394** 0,842* 1,211*** 1,054**
501-1000
over 1000 -1,882*** -1,218**
downsizing 0,970**
Ownership
participation of government
no foreign owners -0,622*
Technological level high
low 1,096*
Financial condition good -0,905* -1,113*
poor
Competition with Russian firms
no tough lessening
intensification -0,897*
Competition with foreign firms
no tough
lessening 1,506**
intensification -0,136
Revenue
under $15 million over $200 million
increase 0,739* 2,230***
Fixed capital expenditure
under 1% -0,892* -0,975*
over 5%
increase 0,965**
TPP innovation expenditures
under 1% over 5% increase
Industry dummies yes
Constant 2,971 23,777 4,937 -0,389
N 415 415 415 415
R2 (Nagelkerke) 0,21 0,28 0,23 0,32
Hereinafter:
[image:28.595.88.544.90.630.2]Table IV Performance indicators increased due to innovations – results of binary logistic regression parameters estimation (for innovative companies subsample)
re v en u e o u tp u t o f n ew o r imp ro v ed p ro d u cts ex p o rts p ro fit ab il it y lab o r p ro d u cti v it y m ateria l co n su m p ti o n en er g y c o n su m p ti o n en v iro n m en tal co m p ati b il ity n o i n d ica to rs i m p ro v ed
Receiving state support in last 3 years 1,108** ,631* -1,854*
Age of company
less than 5 years
1,360** 1,663**
over 20 years -1,107*** ,855** 1,442***
Number of employees
up to 100 ,832**
101-250 ,861** -1,179**
501-1000 ,968*** 1,391***
over 1000 ,756* 1,016*** 1,215** 1,034*
Ownership participation of government -,823* no foreign owners over 10% of foreign owners
Financial condition poor -,859* ,989* 3,076***
good
Worker efficiency low -,882*** ,649** ,577**
high ,561* 1,091** -2,135*
Competition with Russian firms
no
tough -,593*
Competition with foreign firms
no -,779**
tough -,677**
Intensification of competition
with old Russian firms
1,097*** ,952**
with new Russian firms -,873* with Russian divisions of MNC -2,628**
with import 1,636***
Export
no -3,090***
to far abroad countries
1,051*
Industry dummies yes
Constant ,295 -1,133 -,147 -1,444* -1,649** -2,241** -5,359*** -4,822*** -7,097***
N 391 391 391 391 391 391 391 391 391
[image:29.595.10.563.91.631.2]Table V. State support for innovation regarding company's size, age, financial condition and innovation
activity
Companies that have obtained public support
incl. ones that in last 3 years have used tax
incentives public fundinghave received
Total 24,2% 17,5% 8,6%
Number of employees
up to 100 employees 18,1% 11,8% 4,9%
101-250 employees 13,8% 8,3% 5,0%
251-500 employees 29,8% 22,3% 9,1%
501-1000 employees 31,1% 27,2% 6,8%
over 1000 employees 37,9% 26,2% 21,4%
Age of company
less than 5 years 30,0% 24,3% 5,7%
5- 10 years 26,9% 22,7% 6,7%
10-20 years 21,8% 17,6% 7,9%
over 20 years 23,2% 13,8% 10,4%
Financial conditions
poor 2,8% 2,8% 0,0%
satisfactory 22,8% 14,8% 7,3%
good 38,2% 31,6% 16,4%
Innovations in last 3 years
non-innovative 3,5% 3,1% 0,0%
innovative 37,9% 27,0% 14,2%
incl.
Table VI. Obtaining of state support for innovation in last 3 years – results of binary logistic regression parameters estimation (for innovative companies subsample)
Obtaining of
public support
Use of tax incentives
Obtaining of public funding
Age of company less than 5 years 1,076** ,986*
over 20 years -,853**
Number of employees
up to 100
101-250
501-1000
over 1000
Ownership
participation of government
no foreign owners over 10% of foreign owners
Financial condition poor -2,316** -1,341**
good ,511* ,771* 1,049*
Worker efficiency low
high
Competition with Russian firms no
tough
Competition with foreign firms no ,726*
tough
Intensification of competition
with old Russian firms
with new Russian firms ,629* 1,117***
with Russian divisions
of MNC -1,174**
with import ,707* ,806*
Export no -1,006*** -1,610***
to far abroad countries ,691* ,982*
Industry dummies yes
Constant -,039 -3,478***
N 391 391
Table VII. Models of the business-state interaction at the federal level
Модели отношений
Dir
ec
t
st
a
te
inte
rv
ent
io
n
P
rio
rit
y
o
f
pr
ef
er
ence
s
P
er
ca
nta
g
e
o
f
co
mp
a
nies
1. State considers business as an equal partner; attracting investments
and improvement of business conditions are authorities‟ main priorities No Business 9%
2. State does not hamper the development of business but considers it as
a junior partner and aims to hold the keys of corporate actions Yes
Business and Government
16%
3. State focuses on companies‟ social responsibility but does not
intervene in any other matters Yes
Government and Society
14%
4. Authorities main concern is entrepreneurship political loyalty
Yes Government 6%
5. Business is considered as a sourse of income only
No Government 29%
6. Government non-interference with business except for law
enforcement No -
Table VIII. Obtaining of public support regarding model of business-state interaction – results of binary logistic regression parameters estimation
Obtainung of public
support
Use of tax incentives
Obtaining of public funding
Models of the business-state interaction
partners strategic control
social responsibility -0,766* -1,087* political loyalty 1,213** 0,970**
source of income -1,362*** -1,208** noninterference -1,879*** -1,258*** -1,618***
Control dummies See Table IV*
Constant -1,655**
N
R2 (Nagelkerke)