Munich Personal RePEc Archive
Monopoly Capital and Capitalist
Inefficiency
Lambert, Thomas and Kwon, Ed
Northern Kentucky University, Northern Kentucky University
22 September 2014
Online at
https://mpra.ub.uni-muenchen.de/69570/
Monopoly Capital and Capitalist Inefficiency
by
Thomas E. Lambert, PhD
Master of Public Administration Program
Department of Political Science, Criminal Justice, and Organizational
Leadership
Northern Kentucky University
Highland Heights, KY 41099
E-mail:
[email protected]
859-572-5324
And
Edward Kwon, PhD
Political Science Program
Department of Political Science, Criminal Justice, and Organizational
Leadership
Northern Kentucky University
Highland Heights, KY 41099
E-mail:
[email protected]
Abstract
This paper examines the arguments and assertions of Baran’s and Sweezy’s
Monopoly Capital: An Essay on the American Economic and Social Order (1966)
by assessing the degree of economic efficiency or inefficiency in how surplus value
and economic surplus were created by 16 major capitalist economies during the
2000s using data envelopment analysis (DEA). After assigning a score to the
degree of economic efficiency/inefficiency for each country, one can then assess
which factors influence the degree of efficiency/inefficiency. This paper finds
empirical support for many of the arguments put forth by the authors, Baran and
Sweezy, as well as others regarding the inefficiency of the use of some forms of
economic activity to help absorb economic surplus and to create surplus value.
January 2015
Acknowledgements: The authors would like to thank the reviewers for their helpful and constructive comments. Any errors or omissions are those of the authors.
Disclosure Statement: No funds were used in the development of or writing of this paper.
Keywords: data envelopment analysis, Marxian economics, neoclassical economics, over production, over investment, stagnation thesis, surplus value, under consumption,
x-inefficiency
Introduction
With the recent global financial crisis and Great Recession, Paul Baran’s and Paul
Sweezy’s analysis of monopoly capital brings to mind old criticisms of capitalism. When
their landmark book, Monopoly Capital: An Essay on the American Economic and Social
Order (1966)was published, orthodox political economists rarely gave them any credit for
pointing out the systematic drawbacks of a modern capitalistic economy. However, as the
globalization and integration of the world economy has proceeded since their book was
written in 1966, the negative byproducts of capitalist economies have caused severe
strains to global governance and problems in managing a stable international economy.
The United States sub-prime mortgage crisis and a series of bankruptcies of large financial
firms provided a picturesque example of how a country’s level of monopoly capital could
drive an international economy to a perilous situation.
Baran and Sweezy argued that as “profit maximizers and capital accumulators,”
modern giant corporations concentrate most of a country’s economic activity into what they
deemed to be monopoly capitalism.1 They attempted to update traditional Marxist thought
by arguing that a mature capitalist economy has a tendency toward stagnation because of
under consumption or over production, which prevents absorption of the economic surplus
(1966 9-10, 76, and 84). To be more precise, they define economic surplus as “property
income” (profits, dividends, rents, interest, and capital gains), or the traditional concept of
surplus value, plus the value of economic activities considered unproductive or
non-productive (advertising, distribution through wholesaling and retailing, government, finance,
insurance, etc.).Because of a lack of direct competition among the giant corporations,
1The economic surplus is an amount equal to what is produced in an economy minus its “social necessary”
stable pricing, and lower and lower production costs, corporate profits, and thereby surplus
value, would tend to increase in an unlimited fashion over time unless new outlets for
investment are found. Another problem is that as product markets mature and sales
growth stagnates, there is further pressure to absorb part of the surplus value generated
from business operations and labor exploitation. Due to the lack of surplus value
absorption, this part of the economic surplus is then channeled into “unproductive”
economic activities such as advertising, marketing, militarism, finance, and welfare
spending. Finally, another reason for the inability of all surplus to be absorbed is because
population growth and market development (i.e., more potential sales or sales outlets) are
not rapid enough to sell all products produced and to assist absorption. Therefore in the
short run there are only so many investment opportunities available for capitalist investors.2
The Baran and Sweezy thesis gave rise to a whole new way of thinking about
capitalism in the late 20thcentury and created an “overaccumulation” school of thought
within modern Marxism. Much of the Baran and Sweezy tradition is carried on in the
publication Monthly Review: An Independent Socialist Magazine and its editors and writers,
such as John Bellamy Foster and Fred Magdoff. Marxists have always subscribed to the
notions of increasing wealth and business concentration, and periodic crises, but the thesis
of overaccumulation of surplus and subsequent stagnation due to too much surplus not
being absorbed was a new way of thinking about capitalist recessions and crises.
Additionally, the notion that capitalists create and expand unproductive economic sectors
2
and use militarism, research and development, and other means in order to absorb surplus
was also somewhat of a new way of thinking. The contention that such avenues of surplus
absorption were wasteful and inefficient was also a unique contribution.
The purpose of this paper is to reevaluate their work and to assess the degree of
economic efficiency or inefficiency of 16 major economies in surplus value and economic
surplus production during the last decade empirically. This paper proceeds as follows. The
next section summarizes Baran’sand Sweezy’s main arguments regarding monopoly
capital. Next, a discussion of the data, variables, and methods used in this paper including
the technique and method of DEA as a tool for assessing efficiency. The subsequent
section examines the scale and efficiency of 16 OECD (Organization for Economic
Co-operation and Development) countries. Finally, there is an analysis of the degree of
capitalist inefficiency and monopoly capital through quantitative research methods. The
findings of the DEA, a set of correlation coefficients, and regression analysis are reviewed
and evaluated as to their importance and impact especially with regard to 1)
macroeconomic economies of scale, 2) degree of macroeconomic concentration, and 3)
the degree of unproductive consumption/investment in these 16 economies. Finally, in the
concluding section, the justification for validating much of the Baran and Sweezy (and
Edward N. Wolff [1987]) concepts of economic concentration and of surplus absorption
through unproductive consumption/investment are discussed including implications for
The Main Arguments of
Monopoly Capital
The Role of the Large Corporation
According to Bara and Sweezy, there exists a certain amount of excess capacity because
of the large size and market power of modern day corporations. In addition, the
underutilization of resources is encouraged (Steindl 1956) along with, as mentioned above,
the steady prices that are higher than what would be the case under more competitive
conditions (Berle and Means 1931; Strachey 1956). Despite partially mitigating over production
or under consumption, excess capacity and underemployment also promote a lack of
surplus absorption because less is in invested in productive activities than would otherwise
be the case. In a mature capitalist economy, most industries are considered
monopolistically competitive3 (e.g., large retail chains) or oligopolistic (e.g., airlines, large
manufacturers) and enjoy large economies of scale in production—lower and lower
average costs as output is increased or sales become greater (Slavin 2005, 567). Although
there are more firms and lower economic profits in a monopolistically competitive industry
when compared to an oligopolistic one, there is still less competition in monopolisitic
competition than in an ideal, perfectly competitive industry. Instead of competing on price,
firms rely heavily upon advertising and brand positioning. However, despite economies of
scale in production in monopolistic competition and oligopoly, consumer demand is often
not enough to buy all the products made at their normal prices unless techniques other
than price competition are employed. Price competition is avoided because of its
destructive potential and because it can lead to industry instability. Therefore, if other
3 See Edward H. Chamberlin, Theory of Monopolistic Competition (Cambridge, MA: Harvard University Press,
techniques of surplus absorption besides greater investment in manufacturing or
transportation activities are not employed, for example, the economy would be in a
perpetual state of under consumption (or overinvestment/overproduction),4 and there would
be less profits and no areas in which to invest or re-invest the economic surplus.
Surplus Absorption
The challenge to an advanced capitalist society is that besides using traditional means of
investment and consumer expenditures, it must find other ways to absorb the excess
surplus (which includes surplus value) by expanding the size of government through
military and social welfare spending; spending more money on product research and
development; and developing sectors of the economy which can be classified as
unproductive (sectors or lines of work such as marketing, advertising, and finance, for
example). These efforts provide outlets for the surplus value in terms of investment and
more profits and are attempts to boost the capitalist system toward full employment and
greater economy wide capacity utilization by making sure that industry produces a certain
amount of arms; that the poor have enough income to spend on consumer items; that
corporations spend a certain amount of profits on researching potential new products that
may open up new avenues for surplus absorption; and that goods that would ordinarily not
be sold at their regular prices are sold without price competition or price wars through the
extension of credit to consumers who would not otherwise be able to afford them, or
through selling their products by employing tools such as product differentiation, branding,
4
or repeated promotional efforts, even though not much of a difference may exist among the
products that are often in the mature stage of the product life cycle (Baran and Sweezy
1966).
The Dynamics of Capitalism
In order to analyze the dynamics of capitalism, Sweezy puts forth a relationship between
national income and surplus absorption of a capitalist economy in one of his earlier works.
Sweezy (1970, 187-189) citing Otto Bauer (1936) notes that the change in national income is
the sum of the change in wages, the change in surplus consumed by capitalists, and the
change in amount of surplus invested and added to the existing capital stock:
Δ National Income = Δ Wages +Δ Capitalist Surplus + Δ Surplus Invested (1)
Since the driving force of capitalism is greater and greater accumulation according to Baran
and Sweezy, and since this requires more and more investment, wages and capitalist
surplus are functions of the surplus invested, k, yet do not grow as fast as the surplus
invested. They grow but at a decreasing rate. If the rate of consumer goods spending, c, is
a positive function of wages and capitalist surplus, and if consumption goods produced are
proportional to the amount of capital stock in an economy, then the following contradiction
eventually occurs over time (t) as national income grows at a constant or a decreasing rate,
which is a characteristic of a mature capitalist economy:
This in turn means that consumption growth cannot keep up with output growth, which
results in a glut of goods produced unless other means are created for absorbing the
surplus.5
A mature capitalistic system not only suffers from a contradiction of not enough
consumption (or over production) to spur greater and greater accumulation through
productive activities, but it is also inefficient because the areas used to absorb the excess
surplus according to Baran and Sweezy are unproductive—expenditures on the military
and warfare, social welfare, advertising, marketing, finance, real estate, etc. These
economic sectors are assumed to be unproductive because they add little or no value to
the goods produced in an economy that satisfy the consumer needs of food, clothing,
shelter, education, etc. That is, they are only ancillary to the productive sectors of the
economy - agriculture, construction, certain government functions, manufacturing, mining,
transportation and utilities. Baran and Sweezy mention that “surplus can be absorbed in the
following ways: (1) it can be consumed, (2) it can be invested, and (3) it can be wasted”
(Baran and Sweezy 1966, 87). Much of the rest of the book discusses how the unproductive
sectors of the economy help surplus absorption through the waste of investment in
unproductive activities.6
Similarly, Wolff (1987) develops a model of the US economy which shows that
surplus absorption through unproductive consumption and investment is necessary in order
to try to prevent stagnation. However, unlike Baran and Sweezy, he does not believe that
5 This assumption of falling consumption takes into consideration the traditional Marxian notion of the fall
being due to rising exploitation through wage cuts or more intensive work or rising unemployment due to layoffs resulting from labor being replaced by machinery. However, these factors are not emphasized by Sweezy in chapter 10 of The Theory of Capitalist Development (1942 (1970)), which explains the under consumption theory of stagnation. They are addressed in other parts of the book.
6
this method of surplus absorption is a rational reaction to combating stagnation. Wolff
instead argues that it is irrational in that unproductive consumption and investment will only
increase over time, and since such activities are wasteful and do not create surplus value,
he argues that labor productivity and capital accumulation must eventually fall as time goes
by as unproductive employment and investment become bigger and bigger portions of the
economy. In general, and put in terms of neoclassical economics, if the economy can be
modeled using a Cobb-Douglas production function,
Y = AKαLβ (3)
where Y is national output, A is the impact or level of technology or total factor productivity,
K is total capital, L is total labor, α is the productivity of capital, and β is the productivity of
labor, then as increasing portions of K and L become more unproductive, α + β < 1, which
is a manifestation of decreasing or diseconomies of scale. That is, as more and more
capital and labor inputs are added, especially in unproductive sectors, there is
proportionally less and less output (and hence surplus), which is inefficient since less
output could be achieved from fewer resources, especially fewer unproductive resources.
Conversely, more output could be achieved if more or all inputs were in more productive
sectors or in productive lines of employment, although this would probably result in greater
output and over production.
This paper contends that a productivity measurement such as DEA can be used to
assess on a relative basis whether a national economy, in its production of surplus, is
operating under increasing, constant, or decreasing returns to scale.7 Briefly, DEA is a
7
linear programming technique that allows for the relative rankings and comparison of
different entities or decisions making units [e.g., nations, firms, etc.] according to their
efficiency in turning inputs into outputs. If an economy is exhibiting decreasing returns to
scale (that is, it is producing too little output relative to the inputs being used, which is also
inefficient),8one can assess how much of this is due to that economy’s share of economic
activity being classified as unproductive. Because not enough surplus can be absorbed due
to under consumption or over production, greater surplus absorption will be attempted
through unproductive pursuits. In other words, a greater and greater amount of resources
will be used in less productive pursuits. This is a situation that often becomes apparent at
the microeconomic level with decreasing returns to scale at the firm level with oligopolistic
industries.
Next, one of the tenets of Marxism is that capital tends toward greater concentration
and centralization so that most markets are dominated by a few corporations or
competitors. Monopoly capital is a concept often used by Marxists or Neo-Marxists to
characterize modern day capitalism. Mainstream economics also recognizes that many
markets in many advanced industrial countries are characterized by market concentration,
and it has developed terms such as oligopoly and monopolistic competition to describe
many modern day markets. Pryor (2001) finds that during the 1980s and 1990s many major
US markets became more concentrated after deregulation and mergers.
Mainstream economists also argue that monopolies, monopolistic competitors, and
oligopolies are characterized by a certain degree of x-inefficiency wherein firms earn
economic profits and operate at average total costs (short run and long run) higher than the
8
minimum possible average costs. This is often because they operate with a certain amount
of planned, excess capacity as Berle and Means (1931), Steindl (1956), and Baran and
Sweezy (1966) argue, and these firms engage in activities such as advertising or have high
executive salaries (Berle and Means 1931; Steindl 1956; Baran and Sweezy 1966; Colander
1998, 309-311). If many markets within an advanced capitalistic economy are either
monopolistically competitive or oligopolistic, then these economies could be operating with
a certain degree of x-inefficiency, i.e., the underutilization of plant and equipment
(capacity), or the underemployment of resources, such as labor, machinery, or buildings,
etc., or the use of too many resources in unproductive activities which add little to output.
The last situation would indicate too many resources being used to produce a certain level
of surplus.
This paper proposes the use of DEA as a way to assess whether national economies
are operating with x-inefficiency (Leibenstein and Maital 1992; Colander 1998, 309-311). If
economies are operating with x-inefficiency, or where average total costs > minimum
average total costs or where more inputs are being used relative to output, which would
indicate diseconomies of scale (that is, as output goes up, so do costs), then perhaps data
envelopment analysis offers a way to estimate the inefficiency of monopoly capital within
and among different nations. If that can be done, an estimate of how surplus absorption
takes place within a national economy is possible, especially since Baran and Sweezy
(1966) and Wolff (1987) among others indicate that surplus absorption is geared toward
investment in many areas deemed to be unproductive (i.e., military spending, sales effort,
etc.). DEA could then offer some empirical support or refutation of the the Baran and
The use of a mainstream, efficiency evaluation technique such as DEA would also
bolster any findings of capitalist inefficiency since it has some association with neoclassical
economics and has not been used in Marxian analysis to date, or at least its use in this way
has not been found in the course of research for this paper. And although a neoclassical
concept, the production function equation can be used to show decreasing returns to scale
in a mature, capitalist economy, and so its use is appropriate in this paper.
Methods
Data envelopment analysis (DEA) is a nonparametric, linear programming technique that is
designed to measure and compare the efficiency of different entities or decision making
units (DMUs) with regard to their abilities to minimize input usage in the process of
generating outputs, or with respect to their maximizing output in the process of using
inputs. From a list of the DMUs’ inputs and outputs, DEA creates a composite DMU, or
“super” DMU, which matches a production possibility frontier (PPF) that approximates the
minimum use of inputs or resources to get a maximum output level. Each DMU is assigned
an efficiency score based on how close it is to the composite DMU’s PPF, and those DMUs
which match the composite DMU or have a combination of inputs and outputs which would
place them on the PPF receive a score of 1.0. In input oriented DEA, those DMUs which
score below 1.0 fall below the composite DMU’s efficiency and are deemed “inefficient.”
Alternatively, in output oriented DEA, those DMUs which score above 1.0 are deemed
inefficient.
Therefore, in an output oriented DEA model,
which is then compared to and ranked with the scores of other DMUs according to how
close each comes to matching the performance of a composite DMU which is constructed
to illustrate maximum efficiency.
Since Baran and Sweezy argue that surplus maximization and continuous accumulation
of surplus are of paramount importance in a capitalist system, this paper focuses on output
oriented DEA where a country’s total labor hours and value of fixed assets in US dollars are
1) used as inputs to generate a country’s net operating surplus (NOS) or surplus value in
dollars; and 2) used as inputs to generate a country’s economic surplus, or NOS + the
value of unproductive economic activities. NOS is defined as the residual returns to capital,
or total business receipts minus wages and salaries, depreciation, interest paid on loans,
taxes, etc., and comes close to the Baran and Sweezy meaning of surplus value (US
Bureau of Economic Analysis http://www.bea.gov/glossary/glossary.cfm). The assumption
is that a capitalist economy attempts to maximize NOS production and ancillary economic
activity given its inputs with the goal of maximizing surplus value and economic surplus.
The DEA technique used in this paper is a general, linear Charnes, Cooper, and Rhodes
(1978), or CCR, output oriented DEA model (Charnes, Cooper, and Rhodes 1978, 23-24). For
the purposes of this paper, an efficiency score represents a country’s ability to transform a
set of inputs (labor and capital) into a set of output(s). The above model also identifies a
benchmark group (an efficient DMU which matches the composite DMU) for any inefficient
DMUs (Boussofiane, et. al. 1991; Anderson, et. al., 1999; Cooper, Seiford, and Tone 2006).
DEA has been used in the past to measure the performance of different countries with
regard to efficiency, whether efficiency in macroeconomic labor productivity (Lovell, Pastor,
and Thore 1997), or efficiency in GDP production (Lambert 2011). It has been proposed as a
useful tool for economists because of its ability to highlight “x-inefficiency” in production or
in any economic system (Leibenstein and Maital 1992). DEA can also estimate whether a
DMU is experiencing decreasing, constant, or increasing returns to scale with regard to
output production in relation to benchmark DMUs.
A DEA efficiency score represents an elasticity which measures “the relative change in
output compared to the relative change in input” according to Cooper, Seiford, and Tone
(2006, 119-121). A DEA returns to scale score is the sum of the output weights or
multipliers which indicate the degree or scale—increasing, constant or decreasing—at
which a DMU is producing its output with respect to the composite DMU or a benchmark
DMU(s).9 A returns to scale score can have a score anywhere from zero to no upper limit
with a score of 1.0 representing constant returns to scale whereas a score less than 1.0
indicates increasing returns to scale and a score greater than 1.0 indicates decreasing
returns to scale.
In the pursuit of surplus value and surplus maximization and absorption, overproduction
in the monopoly capital sense of the word is occurring in the countries which exhibit
decreasing returns to scale relative to more efficient countries given that the inputs used
are yielding output at a less than proportional rate. This is low productivity, which is a
symptom of stagnation. In both neoclassical and Marxian schools of thought, low
9 For the US in 2010 a score of 0.89 was calculated for an input oriented efficiency score and 1.24 for an
productivity of labor and capital would correspond to stagnating and/or lower returns or
payments to these “factors of production,” which in turn lead to difficulties in labor and
capitalist consumption, or in general, under consumption of the inefficiently produced
output over time, or lead to an increase in consumer debt and the growth of the finance,
insurance, and real estate industries (F/I/RE) in order to keep the rate of consumption
increasing (Foster and Magdoff 2009; Mosely 2013).
First, to show the concentration of economic activity that is occurring throughout the 16
countries, correlation coefficients will be calculated to show the degree of corporate
concentration in each country and throughout the globe. Next, two sets of scale scores,
which measure the output-oriented efficiency and the economies of scale each country has
in its production of surplus value and economic surplus relative to its benchmark
country(ries) are used as dependent variables in regression models (regular least squares,
fixed effects regression and random effects regression) and are predicted using the
independent variables listed below. These scale scores are based on how each country
uses its total fixed assets and total labor hours each year to produce surplus value (NOS)
and economic surplus.
The hypotheses are that the greater the value of inefficient ways of absorbing the
surplus (military expenditures, nonproductive industries, welfare expenditures, research
and development expenditures), the greater the value of the scale scores (the greater the
diseconomies of scale) for a country in the production of surplus value or total surplus.
Likewise, the greater the shares of worker/consumer expenditures, capitalist consumption,
and capitalist investment (NOS shares and additions to total fixed assets), the greater the
functions of investment. This would mean greater inefficiency and less economies of scale
in production. As outlined by Baran and Sweezy, each of the variables listed below
represents a way that surplus can be absorbed.
The sources of data for all of these variables are either the Organization for Economic
Cooperation and Development (OECD) statistics website
(http://stats.oecd.org/Index.aspx?#) or the United Nations (UN) Statistics Division
(http://unstats.un.org/unsd/snaama/dnllist.asp). Based on the Baran and Sweezy set of
assertions, we can hypothesize relationships between the scale scores of each country and
the following variables.
1. Research and Development (R and D) expenditures of each country as a percent
of GDP. In order to increase investment and future sales opportunities, capitalist
economies undertake a lot of research and development in order to come up with
new products and potential new markets, although much research and
development is wasteful, because a good portion of the money spent is on how
to re-design product packaging and styles, etc. Thus, as the value of research
and development expenditures of each country as a percent of GDP increases,
so do the scale scores for each country on average in ceteris paribus.
2. Military Expenditures as a Percentage of GDP. Militarism and imperialism are
important to surplus absorption since they guarantee a stable, global political
environment for capitalist markets. Also, they are usually politically easy to
support since military expenditures have a certain amount of public and popular
surplus absorption, a greater degree of military spending is associated with
greater scale scores (greater diseconomies) on average, ceteris paribus.
3. Total Public Social Welfare Expenditure as a Percentage of GDP. By creating
and occasionally expanding the welfare state, a capitalist system guarantees a
certain amount of surplus absorption by assuring that those unemployed and/or
in poverty have a minimum amount of money to spend through food stamps,
housing support, etc. Along the lines of Baran and Sweezy (1966), and
Greenberg (1977), among many others, there is the argument that the main
purpose of government is actually to serve capitalist interests, although Baran
and Sweezy more specifically believe that welfare state spending is generally
wasteful and is not the most preferred way to absorb surplus since too much of it
can lead to a workforce that cannot be exploited as easily. The hypothesis is that
the greater the welfare state spending, the greater are the scale scores on
average, all else constant.
4. Non-productive Sector of the Economy as a Percentage of GDP. As mentioned
earlier, outlets for surplus absorption present themselves through investment in
efforts such as sales and marketing, banking, finance, real estate, retailing, etc.,
even though such enterprises are not considered as productive or as yielding as
much surplus as other ventures in agriculture, mining, manufacturing, etc., or
those industrial pursuits deemed productive.10 The classification for industries
10
considered as productive follows the one outlined by Shaikh and Tonak (1994).
Therefore, this paper hypothesizes that the greater that this portion is of a
national economy, the higher the scale scores for a country on average.
5. Consumer Expenditures as a Percentage of GDP. Labor income as a share of
national income is used for Sweezy’s wage pool (1970) that keeps consumption
at a certain level. Workers’ consumption mostly comes from their income and
would be considered a traditional form of surplus absorption, although many
household expenditures would go into or for areas considered to be
non-productive (finance charges, retail markups, etc.). Since consumer expenditures
are a function of the surplus generated, this variable should be positively
associated with any inefficiency or diseconomies of scale in surplus value and
surplus production on average, ceteris paribus.
6. NOS as a Percentage of GDP. This is used to represent Sweezy’s shares of
capitalist consumption and investment (1970), and should be proportional to and
a function of surplus generation, whether the surplus value or the surplus is
generated efficiently or inefficiently, all else held constant. Therefore, this
variable is hypothesized to have a positive relationship with the scale scores.
7. Percentage Change in Total Fixed Assets from the Year before. This is another
traditional method of capitalist absorption of surplus as noted by Baran and
Sweezy and expressed as “k” in equation (1) above. Given the discussion by
Baran and Sweezy, it is proportional to the surplus value and surplus generated,
and so it is hypothesized to be positively associated with the economies of scale
scores in surplus value and surplus production, all else held constant.
8. Net Foreign Direct Investment as a Percentage of GDP. Baran and Sweezy
mention that one outlet source of surplus value and surplus is overseas
investment, although they show that more dollars flow back to the U.S. than is
channeled out with regard to net investment. Therefore, they do not see much
efficacy in net foreign direct investment (Net FDI). Nonetheless, Net FDI is an
attempt by a capitalist society to increase investment, and so it is used as an
independent variable, and the hypothesis is that greater levels of Net FDI should
be associated with more inefficient production of surplus value and economic
surplus all else constant.
Scale and Efficiency of the 16 OECD Countries
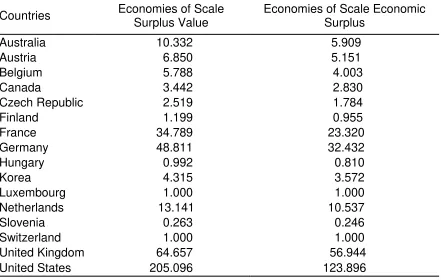
For this paper, the returns to scale scores for surplus value and economic surplus for the
16 OECD countries listed in Table 1 were calculated for each year from 2000 to 201011 in
order to assess whether each country was producing its surplus value (NOS) and economic
surplus with increasing, constant or decreasing returns to scale.12 For 2010 the total GDP
11 A time period which includes two recessionary periods (2001 and 2008-2009) and two cyclical peaks (2000
and 2007) so as to “smooth out” any cyclical effects of extreme upturns or downturns.
12
For this time period, there were only 16 countries for which the OECD database
(http://stats.oecd.org/Index.aspx?#) gave data for each year for each country on total fixed assets (which includes intangible assets such as copyrights, patents, etc.) and total labor hours. More data for other years existed for years prior to 2000, but some countries considered for the panel for the time period for this paper would have been lost, and so the panel would have been unbalanced. Also, since defining and quantifying a country’s level of technology into one factor or index is problematic (Romer 2012), this paper assumes that
technology is endogenous to the production of GDP and NOS and is “embodied” in the values of total fixed
for the 16 countries was around 61% of global GDP.13 A country which produces its surplus
value or economic surplus with increasing returns to scale (a score less than 1.0) basically
has the ability to add more inputs and yet at the same time expand output at a rate greater
than its percentage increase in inputs.
In fact, although such a country is operating inefficiently by not using enough inputs or
by producing too little, it has room for expansion. Such a country could also still be at the
stage of utilizing mostly productive labor, or increasing its amount of productive labor, and
not having to worry so much about surplus absorption relative to an advanced capitalist
country. The transitional and growing economies of Hungary and Slovenia showed an
average score that indicated increasing returns to scale scores for each year from 2000 to
2010 for both types of scale scores, surplus value and economic surplus. Finland, a more
developed nation, showed an average score for economic surplus production which
indicated increasing returns to scale. Countries showing decreasing returns to scale scores
(a score greater than 1.0), on the other hand, would be producing output at a decreasing
rate given their inputs, and thus would have to find alternative ways to absorb surplus
through unproductive activities, although the unproductive activities do not add as much
value to output growth as do productive activities. This type of performance is also rated as
inefficient, and decreasing scale scores for both surplus value and economic surplus were
typical for the economies of most of the advanced capitalist economies listed in Table 1
with the exceptions of Luxembourg and Switzerland.
(Insert Tables 1 to 5 around here)
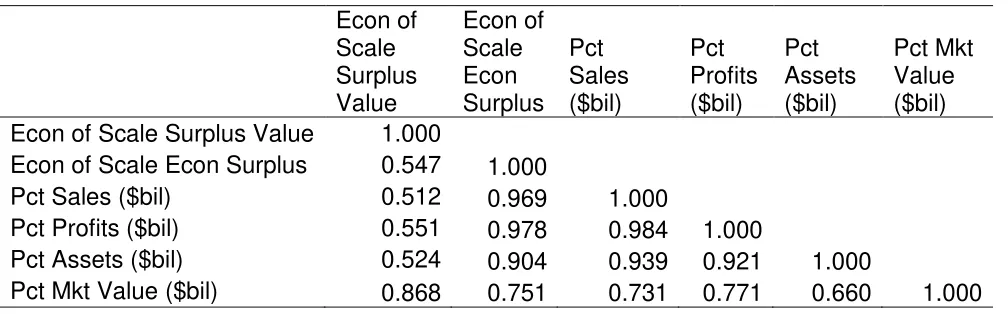
Table 2 displays descriptive statistics for the variables used in the DEA, correlation, and
regression analyses. Table 3 shows correlation coefficients that show the degree of
correlation among a country’s economies of scale scores and the share of a country’s
corporate sales, profits, assets, and market values as a percentage of the top 100
companies of the Forbes Global 2000 total amount of sales, profits, assets and market
value from 2006 to 2010 (Forbes 2006-2010). All of the correlation coefficients show a
moderate to strong positive correlation among the variables. The greater the degree of
diseconomies of scale for each nation, whether for surplus value or economic surplus
production, the greater the sales, profits, assets, and market values as a percentage of
global corporate sales, profits, assets, and market values, all else constant. Despite
inefficiencies in production due to too many inputs given outputs, larger corporate size is
associated with other measures of capitalist success. In standard microeconomics
teaching, although monopoly and pricing power are associated with ATC > minimum total
costs, which is inefficient, at the same time economic profits are higher than what they
would be in a more competitive situation. The results in Table 3 somewhat support this.
Capitalist Inefficiency and Monopoly Capital
As shown in Table 4, a regression analysis of 16 OECD countries was conducted where
surplus value was the dependent variable in the model. In looking at the different
regression results (least squares, fixed effects, and random effects) in Table 4, all three
models show pretty much the same results, six of the eight independent variables are
hypothesized sign with the exception of R & D expenditures as a portion of GDP.14 Total
welfare spending and Net FDI as portions of GDP do not matter, and R & D expenditures
are associated with lower scale scores (increasing and constant returns to scale scores),
and this fails to support the Baran and Sweezy notion of R & D spending as mostly being
associated with waste. Baran and Sweezy predict that R and D and “technological
progress” should not have that much of an impact on surplus absorption (1966. 110).
However, the results of the models indicate that it is associated with greater efficiency in
the production of surplus. Over 80% of the variation in the scale scores/weights can be
explained by the six variables that represent methods of surplus absorption - R & D
spending, military expenditures, consumer expenditures, capitalist consumption, fixed
assets investment, and nonproductive sectors as a share of GDP. Each, except for R & D
expenditures, is associated with greater diseconomies of scale. No evidence of
multicollinearity or serial correlation is apparent given the VIF (variance inflation factor)
scores and Durbin-Watson (D-W) statistic scores shown in the least squares results in
Table 4. All VIF scores are below 5.0, and the D-W statistic is either close to, at or above
2.0, which are appropriate cut-off scores to indicate no problems (Studenmund 2005).
Table 5 shows the results of regression analysis in which the dependent variable
used is economic surplus. These models show fewer statistically significant variables and
lower adjusted r-squared values (around 52-57%). Those variables which are good
predictors of the efficiency of economic surplus production are military expenditures, the
14
nonproductive share of an economy, and capitalist consumption (NOS as a percent of
GDP). There are no signs of multicollinearity or serial correlation problems in this model
either.
Military expenditures have the biggest impact on both types of scale scores.15 Using the
least squares results, a one percent increase in military spending is associated with around
a forty-three point increase in surplus value scale scores on average and around a
thirty-three point increase in economic surplus scale scores. This somewhat validates the Baran
and Sweezy argument that the greatest amount of excess surplus absorption in a modern
day capitalist economy, especially in the US, comes about through military expenditures,
although greater military spending is associated with greater diseconomies/inefficiency in
an economy (Baran and Sweezy 1966, 204-206). The variable which has the next greatest
impact on both scale scores is the non-productive share of economic activity. Again, using
the least squares model, a one percent increase in unproductive economic activity is
associated with a 1-3 point increase in surplus value and economic surplus scale scores,
on average, and holding all else constant.16
The results of the models in Tables 4 and 5 support most of the Baran and Sweezy and
Wolff assertions that monopoly capital outlets for surplus absorption are basically
inefficient, wasteful, or unable to create use value on average. They do not yield better
returns than productive means of surplus absorption through lines of industry that create
use value. Also, greater levels of consumer expenditures and capitalist consumption and
investment are also associated with greater surplus value scale scores (and greater levels
of capitalist consumption and investment are associated with greater economic surplus
15
Step-wise regression also confirms this.
scale scores), indicating that larger capitalist economies that rely upon large levels of
consumer spending—like most of those of the mature capitalist countries—are showing
signs of diseconomies of scale, or perhaps showing symptoms of stagnation and slower
growth. Again, larger economies of scale scores indicate greater degrees of diseconomies
of scale for each country, or that too many inputs are being used to yield too little additional
output or surplus value/economic surplus on a relative basis.17 Higher levels of six of the
variables are linked to higher surplus value diseconomies of scale scores, and higher levels
of three of the variables are linked to higher economic surplus diseconomies of scale
scores.
In terms of surplus value (NOS) and economic surplus production from 2000 to 2010,
Luxembourg and Switzerland consistently ranked the most efficient. They had scores of 1.0
for both economies of scale scores for each year. These two countries, whether individually
or jointly, were the benchmark countries to which the other countries were compared each
year. Most other countries exhibited either increasing returns to scale (Hungary and
Slovenia, and sometimes Finland) or decreasing/diseconomies returns to scale (the
remaining 11 to 12 countries) where more or less output could have been produced
according to the inputs used when compared to Luxembourg or Switzerland. Among the
countries on the list, Luxembourg and Switzerland had average unemployment rates during
this time period lower than the average for the other 14 countries and were usually in the
top 5 of the list each individual year for lowest unemployment rates. From 2000 to 2002,
Luxembourg had the lowest unemployment rate and was followed by Switzerland in second
place. These numbers would imply high levels of capacity utilization and less slack in their
economies when compared to the other countries. Again, slack and excess capacity would
be indicators of monopoly capital waste and inefficiency according to Baran and Sweezy
(1966, 237).
Additionally, Luxembourg had the highest GDP per capita for each year from 2000 to
2010 whereas Switzerland had the third highest level of GDP per capita for the years 2000
to 2007 after the United States and then was in second place from 2008 to 2010.
Luxembourg and Switzerland also are the lowest among the 16 when it comes to military
expenditures as a percentage of GDP (Luxembourg in last place 2000 to 2007, Switzerland
in last place 2008 to 2010) and are somewhere in the bottom third of R and D spending.
Luxembourg, along with the United States, had the highest values for portion of the
economy in nonproductive activities whereas Switzerland was somewhere in fifth to sixth
place. Luxembourg and Switzerland fall somewhere in the middle when it comes to social
welfare expenditures, which probably accounts for why this variable is not a good predictor
of the economies of scale variable, and the two countries are spread out in the bottom half
of the consumer expenditures portion list and finish in second or third place behind the
Czech Republic during the decade when it comes to surplus value (NOS) as a percentage
of GDP. Although Luxembourg had high rates of investment in fixed assets during the
decade (some years were over 10%), Switzerland had low rates of investment—less than
5% on average during the time period.
Conclusion
Although a relative comparison among these 16 capitalist countries, the analysis presented
in this paper supports the notions of capitalist concentration and inefficiency (diseconomies
surplus. Again this is due to the large presence of unproductive activities in their economies
such as military spending, nonproductive sectors of the economy, etc. As Wolff notes in the
concluding chapter of his book:
Unproductive activity thus appears as a contradiction of the advanced capitalist system. It threatens the reproduction of the system by reducing the rate of accumulation. Its one apparent virtue is that it absorbs part of the social product and thus alleviates the realization problem. But this product could also be absorbed by increased accumulation (or increased personal consumption). Moreover, unproductive activity is a feature of advanced capitalism that benefits neither workers nor capitalists. (1987, 178)
Although mostly writing about the US economy, Wolff also notes that as long as
unproductive labor growth and pursuits continue to grow at faster rates than productive
ones, economic growth and productivity growth will continue to slow. This slowdown will
make the rate of surplus accumulation slower, which in turn will lead to stagnation. In our
analysis, as the years progressed, those nations which showed either surplus value or
economic surplus economies of scale scores greater than one usually saw the scores
become larger—until the onset of the Great Recession.
An alternative path that could be followed would be one in which unproductive and
wasteful economic activity would be minimized or eliminated and where workers would get
a just and equitable share of surplus value and the economic surplus through productive
activities in which there would be no planned excess capacity or slack in an economy. Less
slack and less excess capacity would create greater employment, and more likely than not,
a shorter work week. Although capitalistic countries, Luxembourg and Switzerland with their
low unemployment rates, low levels of militarism, and high efficiency ratings give some
Some limitations to this research paper should be mentioned. The production function
used in the DEA calculations did not incorporate a value for technology, which was
assumed to be endogenous and already “embodied” in the values of total work hours and
total fixed assets. Also, DEA is a technique which develops a relative ranking of efficiency
based upon DMU inputs and outputs. It does not and cannot be used to develop absolute
measures of efficiency. Additionally, if data for more countries had existed, perhaps the
economies of scale scores for the countries in our panel would change slightly or
dramatically depending upon how the relative rankings would be re-configured.
Nonetheless, many of the hypotheses surrounding monopoly capital examined here
are supported. It will be interesting in a post Great Recession economic climate, where the
economies of most nations are still growing slowly at best, to see what new ways of surplus
absorption will be employed by the advanced capitalist nations. Whether there will be a
dramatic burst in the growth of current or new industries or a breakout of a new war(s)
References
Anderson, David R., Dennis J. Sweeny, Dennis and Thomas A. Williams. 1999. Contemporary Management Science with Spreadsheets, South-Western Publishing, Cincinnati, OH.
Baran, Paul A. and Paul M. Sweezy. 1966. Monopoly Capital: An Essay on the American Economic and Social Order. New York, NY: Monthly Review Press.
Bauer, Otto M. 1936. Between Two World Wars? Bratislava: Prager
Berle, Jr. Adolf A. and Gardiner C. Means. 1934. The Modern Corporation and Private Property. New York, NY: MacMillan Company.
Boussofiane, A., Dyson, R.G., and Thanassoulis, E. 1991. “Applied Data Envelopment Analysis.” European Journal of Operational Research 52: 1-15.
Bowles, Samuel, David M. Gordon, and Thomas E. Weisskopf. 1983. Beyond the Waste Land: A Democratic Alternative to Economic Decline. Garden City, NY: Anchor
Press/Doubleday Publishers.
Chamberlain, Edward. 1933. The Theory of Monopolistic Competition: A Re-orientation of the Theory of Value, Harvard University Press. 1965, 8th Edition.
Colander, David C. 1998. Microeconomics, 3rd Edition. New York, NY: Irwin-McGraw-Hill Publishers.
Charnes, A., Cooper, W.W., and Rhodes, E. 1978. “Measuring the efficiency of decision making units,” European Journal of Operational Research, 2 (6): 429-444.
Cooper, William W., Lawrence M. Seiford, and Kouru Tone. 2006. Introduction to Data Envelopment Analysis and Its Uses. New York, NY: Springer Publishers.
DEAFrontier Software 2007. 2007. http://www.deafrontier.net/software.html
Dumenil, Gerard and Dominique Levy. 2006. “Unproductive Labor as Profit Maximizing
Labor”, http://www.jourdan.ens.fr/levy/
Forbes Global 2000 List. 2006 to 2010. http://www.forbes.com/global2000/ . Forbes Magazine.
Foster, J. B., and F. Magdoff. 2009. The Great Financial Crisis: Causes and Consequences. New York, NY: Monthly Review Press.
Golany, Boaz and Sten Thore. 1997. “The Economic and Social Performance of Nations:
Greenberg, Edward S. 1974. Serving the Few: Corporate Capitalism and the Bias of Government Policy. New York, NY: John Wiley and Sons, Inc.
________________._1979. Understanding Modern Government: The Rise and Decline of the American Political Economy. New York, NY: John Wiley and Sons, Inc.
________________. 1977. The American Political System: A Radical Approach. Cambridge, MA: Winthrop Publishers, Inc.
Houston, David. 1997. “Productive-Unproductive Labor: Rest in Peace,” Review of Radical Political Economics, 29(1): 131-139.
Laibman, David. 1999. “Productive and Unproductive Labor: A Comment,” Review of Radical Political Economics, 31(2): 61-73.
Lambert, Thomas E. 2011. “The Relationships among Certain Political and
Socioeconomic Variables with Economic Efficiency: An Exploratory Article,” World Review of Political Economy, Vol. 2, No. 4, Fall 2011, pages 687-707.
Lambert, Thomas E. and Edward Kwon. “The Top 1 Percent and Exploitation Measures,” forthcoming, Review of Radical Political Economics.
Leibenstein, Harvey and Shlomo Maital. 1992. “Empirical Estimation and Partitioning of X
-Inefficiency: A Data Envelopment Approach,” American Economic Review, May 1992, 82(2): 428-433.
Lovell, C.A. Knox, Jesus T. Pastor, Judi A. Turner 1995. “Measuring macroeconomic
performance in the OECD: A comparison of European and non-European countries,” European Journal of Operational Research, 87, 507-518.
Maudos, Joaquin, Jose Manuel Pastor, and Lorenzo Serrano. 2000. “Convergence in
OECD countries: technical change, efficiency and productivity,” Applied Economics, 32(6), 757-765.
McDonald, John. 2009. Using Least Squares and Tobit in Second State DEA Efficiency
Analyses,” European Journal of Operational Research, 197 (2009): 792-798.
Mohun, Simon. 1994. “A Re(in)statement of the Labor Theory of Value,” Cambridge Journal of Economics, 18: 391-412.
____________. 1996. “Productive and Unproductive Labor in the Theory of Value”,
Review of Radical Political Economics, 28(4): 30-54.
___________. 2014. “Unproductive Labor in the U.S. Economy, 1964-2010,” Review of Radical Political Economics, 46(3): 355-379.
Moseley, Fred. 2013. “The U.S. Economic Crisis: From a Profitability Crisis to an
Overindebtedness Crisis,” Review of Radical Political Economics, Fall 2013, 45(4): 472-477.
Organization for Economic Cooperation and Development Statistics. Various years.
http://stats.oecd.org/Index.aspx?#
Patterson, Thomas. 2012. “Chapter 17, Foreign Policy: Protecting the American Way” in We the People, 10th Edition. New York, NY: McGraw-Hill Publishers.
Pryor, F. L. 2001. “New Trends in U.S. Industrial Concentration.” Review of Industrial Organization, 18: 301-326.
Robinson, Joan. 1933. The Economics of Imperfect Competition. London: Macmillan. 2d ed., 1969.
Romer, David. 2012. Advance Macroeconomics, Fourth Edition. New York, NY: McGraw-Hill/Irwin.
Shaikh, Anwar M. and E. Ahmet Tonak. 1994. Measuring the Wealth of Nations: The Political Economy of National Accounts. Cambridge, UK: Cambridge University Press.
Slavin, Stephen L. 2005. Economics, 7th Edition. Boston, MA: McGraw-Hill, Irwin.
Steindl, Josef. 1952 (1974). Maturity and Stagnation in American Capitalism. New York, NY: Monthly Review Press.
Strachey, John. 1956. Contemporary Capitalism. New York, NY: Random House Publishers.
Studenmund, A.H. 2005. Using Econometrics: A Practical Guide, 5th Edition. New York, NY: Pearson Publishers.
Sweezy, Paul M. 1942 (1970). The Theory of Capitalist Development: Principles of Marxian Political Economy. New York, NY: Modern Reader Paperbacks and Monthly Review Press.
United Nations Statistics Division. Various Years.
http://unstats.un.org/unsd/snaama/dnllist.asp
Table 1 Average of Output Oriented Economies of Scale Scores for
Surplus Value (NOS) and Economic Surplus, 2000-2010
Countries Economies of Scale Surplus Value
Economies of Scale Economic Surplus
Australia 10.332 5.909
Austria 6.850 5.151
Belgium 5.788 4.003
Canada 3.442 2.830
Czech Republic 2.519 1.784
Finland 1.199 0.955
France 34.789 23.320
Germany 48.811 32.432
Hungary 0.992 0.810
Korea 4.315 3.572
Luxembourg 1.000 1.000
Netherlands 13.141 10.537
Slovenia 0.263 0.246
Switzerland 1.000 1.000
United Kingdom 64.657 56.944
Table 2 Descriptive Statistics
Variables Means St. Deviation
NOS ($ millions) 424,240 884,241
Table 3 Correlation Coefficients
Econ of Scale Surplus Value
Econ of Scale Econ Surplus
Pct Sales ($bil)
Pct Profits ($bil)
Pct Assets ($bil)
Pct Mkt Value ($bil) Econ of Scale Surplus Value 1.000
Econ of Scale Econ Surplus 0.547 1.000
Pct Sales ($bil) 0.512 0.969 1.000
Pct Profits ($bil) 0.551 0.978 0.984 1.000
Pct Assets ($bil) 0.524 0.904 0.939 0.921 1.000
Table 4 Regression Analysis of Dependent Variable Surplus Value
(NOS) Scale Scores
1) Least Squares
Predictor b SE t-score p-value VIF
Constant
-324.420 26.110 -12.430 0.000
R & D Pct GDP -8.628 2.602 -3.320 0.001 1.492 Military Exp Pct GDP 43.053 2.717 15.850 0.000 2.053 Tot Pub Soc Welfare Exp Pct GDP 0.008 0.413 0.020 0.985 2.151 Nonprod Sector Share Pct GDP 2.780 0.216 12.900 0.000 1.758 Consumer Exp Pct GDP 1.294 0.322 4.010 0.000 2.006 Pct Chg Tot Fixed Assets 1.093 0.541 2.020 0.045 1.114 Net FDI Pct GDP -0.346 0.210 -1.650 0.101 1.135 NOS Pct GDP 1.826 0.364 5.010 0.000 1.433
S = 20.7047, R-Sq = 84.2%, R-Sq(adj) = 83.4%, n = 176 Durbin-Watson statistic = 2.78689
2) Linear Regression, Fixed Effects
Fixed-effects (within) regression Number of obs = 176 Group variable: nation Number of groups = 16
R-sq: within = 0.8425 Obs per group: min = 11.0 between = 0.8111 avg = 11.0 overall = 0.8383 max = 11.0
F(8,152) = 101.67
corr(u_i, Xb) = 0.0720 Prob > F = 0.0000
b SE t-score p-value
3) Linear Regression, Random Effects
Random-effects GLS regression Number of obs = 176 Group variable: nation Number of groups = 16
R-sq: within = 0.8420 Obs per group: min = 11.0 between = 0.8230 avg = 11.0 overall = 0.8391 max= 11.0
Wald chi2(8) = 874.70
corr(u_i, X) = 0 (assumed) Prob > chi2 = 0.0000
b SE t-score p-value
Constant -321.314 26.135 -12.290 0.000
R & D Pct GDP -7.348 2.566 -2.860 0.004 Military Exp Pct GDP 43.057 2.718 15.840 0.000 Tot Pub Soc Welfare Exp Pct GDP -0.039 0.415 -0.090 0.924 Nonprod Sector Share Pct GDP 2.754 0.219 12.570 0.000 Consumer Exp Pct GDP 1.216 0.318 3.820 0.000 Pct Chg Tot Fixed Assets 1.104 0.542 2.040 0.042 Net FDI Pct GDP -0.006 0.078 -0.080 0.935 NOS Pct GDP 1.856 0.367 5.060 0.000
sigma_u 3.2342917 sigma_e 20.648635
Table 5 Regression of Dependent Variable Economic Surplus Scale
Scores
Predictor b SE t-score p-value VIF
Constant -208.220 36.930 -5.640 0.000
R & D Pct GDP -3.496 3.680 -0.950 0.343 1.492 Military Exp Pct GDP 33.595 3.843 8.740 0.000 2.053 Tot Pub Soc Welfare Exp Pct GDP 0.563 0.584 0.970 0.336 2.151 Nonprod Sector Share Pct GDP 1.645 0.305 5.400 0.000 1.758 Consumer Exp Pct GDP 0.497 0.456 1.090 0.277 2.006 Pct Chg Tot Fixed Assets 0.205 0.766 0.270 0.789 1.114 Net FDI Pct GDP -0.094 0.296 -0.320 0.752 1.135 NOS Pct GDP 1.306 0.515 2.530 0.012 1.433
S = 29.2860, R-Sq = 55.5%, R-Sq(adj) = 53.4%, n = 176 Durbin-Watson statistic = 1.93286
2) Linear Regression, Fixed Effects
Fixed-effects (within) regression Number of obs = 176 Group variable: nation Number of groups = 16
R-sq: within = 0.5500 Obs per group: min = 11.0 between = 0.6095 avg = 11.0 overall = 0.5535 max = 11.0
F(8,152) = 23.22, corr(u_i, Xb) = 0.0435 Prob > F = 0.0000
b SE t-score p-value
Constant -207.016 38.844 -5.330 0.000
R & D Pct GDP -1.452 3.890 -0.370 0.709 Military Exp Pct GDP 32.443 4.017 8.080 0.000 Tot Pub Soc Welfare Exp Pct GDP 0.330 0.612 0.540 0.590 Nonprod Sector Share Pct GDP 1.588 0.329 4.820 0.000 Consumer Exp Pct GDP 0.573 0.471 1.220 0.226 Pct Chg Tot Fixed Assets 0.200 0.794 0.250 0.801 Net FDI Pct GDP 0.038 0.118 0.330 0.744 NOS Pct GDP 1.327 0.550 2.410 0.017
sigma_u 7.6328034, sigma_e 29.718215 rho .06188412 (fraction of variance due to u_i)
3) Linear Regression, Random Effects
Random-effects GLS regression Number of obs = 176 Group variable: nation Number of groups = 16
R-sq: within = 0.5485 Obs per group: min = 11.0 between = 0.6502 avg = 11.0 overall = 0.5551 max = 11.0
Wald chi2(8) = 208.40
corr(u_i, X) = 0 (assumed) Prob > chi2 = 0.0000
b SE t-score p-value
Constant -206.978 36.784 -5.630 0.000
R & D Pct GDP -3.262 3.598 -0.910 0.365 Military Exp Pct GDP 33.682 3.834 8.790 0.000 Tot Pub Soc Welfare Exp Pct GDP 0.553 0.585 0.940 0.345 Nonprod Sector Share Pct GDP 1.645 0.308 5.350 0.000 Consumer Exp Pct GDP 0.463 0.448 1.030 0.302 Pct Chg Tot Fixed Assets 0.204 0.766 0.270 0.790 Net FDI Pct GDP -0.010 0.110 -0.090 0.925 NOS Pct GDP 1.312 0.515 2.550 0.011
sigma_u 0 sigma_e 29.718215