© 2019, IRJET | Impact Factor value: 7.211 | ISO 9001:2008 Certified Journal
| Page 781
EFFICIENT RETRIEVAL OF INFORMATION USING
TALEND-DATA INTEGRATION
Ms.Monica G
1, Dhanushya V
2, Mythily R
3, Nancy R
4, Sasi Rekha S
51
Assistant Professor, Department of Computer Science and Engineering, Sri Eshwar College of Engineering,
Coimbatore, Tamilnadu-641202
2.3,4,5
UG Students, Department of Computer Science and Engineering, Sri Eshwar College of Engineering, Coimbatore,
Tamilnadu-641202
---***---ABSTRACT:-
In this competitive world, it becomesnecessary to capture and monitor the development of an individual. This paper describes the methodology of data warehouse used for analysis, generating reports and related tools for support of those technologies, which are used to generate reports. Employees and other stakeholders needs information about insight into the existing data, so as to analyze and retrieve data in an efficient manner without disturbing the daily activity of an Online Transaction Processing (OLTP) system. This is a complex problem during the decision-making process. To solve this problem, the information about the employee and other stakeholders are stored at a structured format in the data warehouse and the report is generated respectively.
Keywords: Data Warehouse, Talend DI, SQL, Database, OLTP, OLAP, Java
1. INTRODUCTION
The goal of our proposed system is to generate consolidated reports for data in the form of graphs that can be analyzed easily. This analysis can be used to understand the progress of employee performance every year. At present there are no system to analyze the employee information hence the Talend ETL tool is used to generate the analytical reports of the employee and their respective performance. Information is one of the most factors to an organization success that is needed during decision making. Organizations typically deal with large volumes of data containing valuable information about employee details, stakeholder details, administration details and others. But these data are stored in operational databases that are not useful for decision makers. In order to achieve this goal, data integration process is done by using efficient ETL mechanisms. In this new landscape, Talend tool acts as a consolidated repository to collect all the master data from sources and performs efficient ETL process.
2. DATABASE
A database is a base collection of data. The database is designed in such a way that the data can be easily retrieved. Some examples are phone books. The operations performed in the database are sorting, retrieving and transformation etc.
A Relational Database Management System (DBMS) – software that allows users to create, maintain, and query your data in the related tables.
The DBMS programs available are Access, Microsoft SQL Server, and Oracle etc. Structured Query Language (SQL) is used to access the data that is available in the MySQL database. The set of related information that are stored in the relational database management system are created and operated using Structured Query Language.
2.1 BENEFITS
1) Reduce the duplication of data
2) Allows sharing of data by several users
3) Data are accurate and consistent.
2.2 USE OF DATABASE IN TALEND
© 2019, IRJET | Impact Factor value: 7.211 | ISO 9001:2008 Certified Journal
| Page 782
3. ETL CONCEPTS
Extraction, Transformation and loading. ETL refers to the method involved in accessing and manipulating source data and loading it into target database. The First step: mapping the data between source and target database (data warehouse or data mart). Second step: cleansing of source data .Third Step: Transforming cleansed source data and then loading into data mart. ETL helps organization to make data driven decisions by transforming and interpreting huge amount of structured and unstructured data. The format of data can be structured or unstructured form .The examples of structured format are .csv files, .xls files, .data files, .xml files etc.
3.1 ETL PROCESS
ETL process involves the following tasks:
Fig-1: Process of ETL
3.1.1 EXTRACTING THE DATA FROM DIFFERENT
SOURCES
This is the first step in ETL process. The extraction process extracts the data from source data and allow it to do further processing. The objective is to retrieve all required data from source system. The design of the extraction step should not affect the source system. The data has been consolidated from the various source systems. Each separate source uses a different format. Common data-source formats include RDBMS, XML (like CSV, JSON).The extraction process convert the data into the suitable format for the transformation.
3.1.2 TRANSFORMING THE DATA
In this step, certain rules are applied on the extracted data. The data which is cleansed is loaded into the target database in a general format. (Depending on the organization’s requirement) Since the data is collected from heterogeneous sources each source will have unique standards.
For example if we have two different data sources A and B. In source A, date format is like dd/mm/yyyy, and in source B, it is yyyy-mm-dd. Here the data is converted into required format. The other things that are carried out in this step are:
Cleansing (e.g. “Male” to “M” and “Female” to “F” etc.)
Filtering (e.g. selecting only certain columns to load)
Enriching (e.g. Full name to First Name, Middle Name, Last Name)
Splitting a column into multiple columns and vice versa
Joining together data from multiple sources
3.1.3 LOADING
–
DATA
This is the final step in the ETL process. In this step, the target database is loaded with the extracted data and transformed data. It is important to index the database and disable constraints before loading the data for the efficient loading.
ETL process runs all the three steps in parallel. The second step of transformation process is executed simultaneously, because delay in the data extraction process. This prepares data for the third step of loading which enters into the Data Warehouse.
© 2019, IRJET | Impact Factor value: 7.211 | ISO 9001:2008 Certified Journal
| Page 783
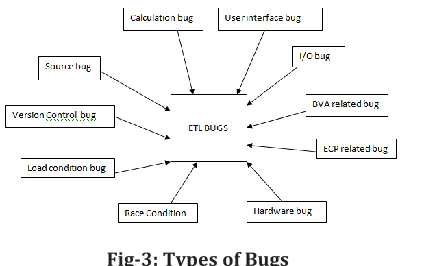
3.2 ETL TESTING
[image:3.612.63.278.161.294.2]ETL testing is used to check whether the data has been loaded from the source to the destination accurately. It verifies the data at various middle stages.
Fig-3: Types of Bugs
4.
DATA WAREHOUSE
A data warehouse is a system with its own database. It retrieves the data from the various heterogeneous sources and it is supported for query and analysis. To facilitate data retrieval for analytical processing, a data warehouses provides us generalized and consolidated data in multidimensional view. The data warehouses also provides an Online Analytical Processing (OLAP) tools. It helps in interactive and effective analysis of data in a multidimensional space. This analysis results in data generalization and data mining .we use a special database design technique called a star schema.
4.1 DATA WAREHOUSE APPLICATION
Financial service
Banking services
Consumer goods
Retail sectors
Controlled manufacturing
4.2 CONCEPTS OF DATA WAREHOUSING
1. Dimensional data model.2. Slowly changing dimension. 3. Conceptual data model. 4. Logical data model. 5. Physical data model.
4.3
BENEFITS
OF
DATA
WAREHOUSING
TECHNOLOGY
Stored data is processed using statistical analysis,
reporting, etc.
Production strategies can be fine-tuned using the data
warehouse information.
Customer buying preferences can be possible by
analyzing DWH information.
5. OLTP FEATURES
The OLTP (Online Transaction Processing) system is a source of original data and it provides the data to warehouse, the system relay on fast query processing and it maintains data integrity. The OLTP system make use of simple queries to return the records as requested by the user and it also maintain the current data that are stored in the form of schema in the entity model. The table in the OLTP systems are normalized in order to reduce the redundancy and to avoid the space constraint. It is used to do many small transaction with simple query, used for data entry, financial transaction, customer relationship management and retail sales. The database size of OLTP is 100 MB to 1 GB.
5.1 BENEFITS OF OLTP SYSTEM
1) It reduces the paper work.
2) It handles large data, complex calculation and higher peak loads.
3) It provides higher performance. The raw data’s are collected from various source and it is inserted into the database with the help of SQL queries. Queries like insert, update and create are used to store the data in the database and queries like select are used to retrieve the data from the database.
Table -1: Comparison of OLAP vs. OLTP Basis of
difference DWH (OLAP) OLTP
Data types Transactional
data Data from multiple
sources
Suitable for Basic business
© 2019, IRJET | Impact Factor value: 7.211 | ISO 9001:2008 Certified Journal
| Page 784
Storage size From 100 GB Up
to 1 TB 100 MB to 1 GB
Number of records accessed
Millions Fewer
Dimensional
view of data Multidimensional view Flat relational view.
6. SCHEMA
6.1 STAR SCHEMA
The main feature of a star schema is a table at the center,
called the fact table and the dimension tables which
allow browsing of specific categories, summarizing etc. The dimensional table in star schema is de-normalized.
6.2 SNOWFLAKE SCHEMA
The snowflake schema is the extension of star schema, where each point of the star explodes into more points. The dimensional table in snowflake schema is normalized.
6.3 DIMENSIONS TABLE
A Dimension Table is a table in a star schema of a data warehouse. Data warehouses are designed using dimensional data models. It consists of fact and dimension tables. Dimension tables are used to describe dimensions; they contain dimension keys, values and attributes. Dimension tables are de-normalized tables. The dimension can also contain one or more hierarchical relationships.
6.4 FACT TABLE
A Fact Table is the central table in a star schema. A fact table always stores a quantitative information for analysis. A fact table works with dimension tables and it holds the data to be analyzed and a dimension table stores data about the ways in which the data can be analyzed. The dimension tables are joined using foreign keys and the information contained in the dimension tables are analyzed.
7. WHY TALEND
Talend is the most powerful data integration
tool
It is available as both open source software
and integrated software
It is less expensive as it avails in open source.
It avails easy mapping of data from source to destination.
8. INTRODUCTION
Talend is the company which aims at making our data better, more trustworthy, and more available to drive business value. Talend was established in the year of 2005 and has its headquarters at Redwood City, California, United States.
In 2006, Talend open Studio for data integration was launched.
The first Talend Connect User Conference held in Paris in the year of 2008. Talend launched its Big Data and cloud in the year of 2012 and 2015 respectively.
9. TALEND OPEN STUDIO
In today’s Big Data and the cloud centric world, it becomes very important for the organizations to harness their enterprise information. It is mainly used for integration between operational systems, as well as for ETL for business intelligence and data warehousing, and for migration.
© 2019, IRJET | Impact Factor value: 7.211 | ISO 9001:2008 Certified Journal
| Page 785
9.1 PRODUCTS
It also provides the companies with various products such as Big Data, Data Integration, Data Preparation and Integration Cloud.
9.2 PLATFORMS
Talend Open Studio provides the users with various platforms namely
Big Data Platform
Real Time Big Data Platform
Data Preparation
MDM Platform
Data Management
Integration cloud
Data Services Platform
Meta Data Manager
9.3 TALEND
OPEN STUDIO FOR DATA
INTEGRATION
Talend open studio for data integration provides unified development and management tools to integrate and process all of your data efficiently. This software allows the user for various purposes such as analytics, business intelligence, report generation or loading into an application.
9.3.1 ADVANTAGES
Faster Designing
Early Cleansing
Efficient Management
Native Code
Easy Scalability
Real Time Statistics
Better Collaboration
Native Code
10. REQUIREMENTS OF TALEND
Table-2: MEMORY REQUIREMENTS
Memory usage 4GB minimum, 8GB recommended
Disk Space 30 GB
Table-3: SOFTWARE REQUIREMENTS Operating
system Version software
Microsoft Windows Professional
7 64-bit
Apple OS X El Capitan/10.11 64-bit Mavericks/10.9 64-bit
11. JAVA
Java is a general purpose programming language that is designed specifically to have few implementation dependencies as possible. It is class based, concurrent and object oriented. Talend Open Studio is fully developed on java. It is a drag and drop application where user can easily drag the components to the design workspace and the respective predefined java code will be generated in the background.
11.1 RESTRICTIONS:
In Talend Studio version 6.0 and onwards,
ODBC is not supported for accessing database connections due to the limitations of java 8. The only supported database driver type is JDBC.
In case of installing Java 8, the generic ODBC
or ODBC cannot be created to work with Talend Open Studio 6.0 and above.
12. DATABASE CONNECTIVITY IN TALEND
Talend Open Studio for Data Integration supports various databases such as:
MySQL
Oracle
Greenplum
MS Server
PostgreSQL
AS400
DB2
The proposed system uses Oracle Database connectivity for storing the information.
12.1 ORACLE DATABASE IN TALEND
© 2019, IRJET | Impact Factor value: 7.211 | ISO 9001:2008 Certified Journal
| Page 786
management system produced and marketed by OracleCorporation. It is a database commonly used for running online transaction processing (OLTP), data warehousing (DW) and mixed (OLTP and DW) database workloads.
13. COMPARISON STUDY OF ETL TOOLS
The comparison of Microsoft SSIS, CloverETL and Talend are made using various factors like efficiency, built in scheduling scheduling systems etc., The comparison chart is shown below:
Chart-1: Comparison of ETL tools
14. PROJECT OVERVIEW
The proposed system is used to transform the unstructured form of data to structured form of data. The transformation and integration of data is implemented using an ETL tool named Talend Open Studio for Data Integration. It reduces the processing time and improves efficiency.
14.1 GOALS AND MOTIVATIONS
Create an efficient mechanism for retrieving the
stakeholder’s information.
Retrieve the accurate information based on the
user queries.
Easy way of fetching information from data
warehouse.
Updating of data done dynamically.
14.2 WORKING
In the proposed system, the source can be of any format such as .txt files, .xlsx files, .pdf etc. The employee details are given as the source information in .txt files.
The information are extracted from the source and transformed into a structured format and stored in the staging table. The transformation logics and the business logics are implemented to the data in the staging table and then stored in the transformation table. Then the transformation table is loaded in the data warehouse. In this system, The employee details contains details like company name, employee id, designation, salary, data of birth, date of joining, first name, last name, phone number in the text format. The name of the text file is given in the format of “name of file_country name.txt”. It is converted into a staging table which contains all the information contained in the text document. The transformation logics and business logics are applied to the staging table and stored in the table called as transformation table. Some of the transformation logics applied are
Email id is generated by appending the first
character of last name with first name and their respective company name
Experience is calculated from the date of joining of
an employee
Commission is derived as 10% of the employee’s
salary
Age is given as the difference between the current
date and date of birth.
The Region code is generated from the phone
number and the region name is generated from the name of the file which is given for providing employee’s information
Fig-5: Transformation logics 0
0.51 1.52 2.53 3.54 4.55
Microsoft SSIS Talend
© 2019, IRJET | Impact Factor value: 7.211 | ISO 9001:2008 Certified Journal
| Page 787
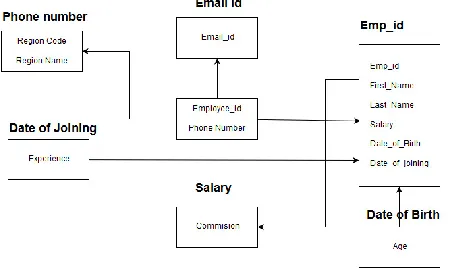
14.3 DETAILED DESIGN
The fact table consists of columns such as employee_id, phone number. From the employee id, the other columns such as emp_id, first name, last name, designation, salary, date of birth, date of joining. From the phone number, the region code and region name can be derived. As the transformation logics are used for email id, it can be generated from the first name, last name and their respective company name. The experience of an employee is calculated from the date of joining and the age of an employee is generated from the date of birth. The commission is also calculated from the salary of an employee. Using the incremental load, the slowly changing dimension (scd), tAddCRCRow are implemented. Finally, the transformation table is stored in the structured format and loaded in the data warehouse.
Fig-6: Schema Representation
14.4 PROCESS OF INCREMENTAL LOAD
14.4.1 SCD COMPONENT
tRowgenerator is used to generate the random records for the employee’s information. The incremental load is performed by scd component. The type 3 scd is used in the system, where the new columns will be added for the updated information of the employee. The new columns will be added if the employee has changed his/her number as old phone number and new phone number. If the designation of the employee has changed, the new columns can be added as old position and new position. The salary updation can be stated in the columns as old and updated salary.
14.4.2 ADDCRC ROW
The addcrc row component is used to generate the surrogate key for all the rows in the transformation table.
[image:7.612.344.552.164.289.2] [image:7.612.50.275.306.441.2]Every surrogate key will be a unique key so it can be used to identify the records distinctly in the transformation table and easy retrieval of information can be achieved. If the new rows are updated in the table, Surrogate key will be automatically generated.
Fig-7: tAddCRCRow implementation
14.4.3 TARGET LOOKUP
The final transformation table is termed as target lookup table. It is based on the incremental load model, if any new employee information is added or if there are any updation in the employee information, it will automatically get updated in the transformation table. The final transformation table contains all the employee information such as company name, employee id, first name, last name, designation- old position and new position if applicable, date of joining, experience, phone number-old and new phone number if applicable, date of birth, age, salary- old and new salary if applicable, region code, region name, email id, active(0/1)- if the employee is currently active, then the Boolean value 1 is shown and if the employee is not active then the Boolean value 0 is updated.
14.4.4 SQL FUNCTION
© 2019, IRJET | Impact Factor value: 7.211 | ISO 9001:2008 Certified Journal
| Page 788
Fig-8: outcome in structured format15. METHODOLOGY
The incremental model is a software development method where the product is designed, implemented and tested incrementally that is little more is added each time until the product is finished. This model combines the elements of the waterfall model with the iterative philosophy of prototyping.
The basic algorithm that will be implemented for working of this system is as follows:
Step 1: Get the raw data from various sources.
Step 2: The required data is extracted from the data set provided.
Step 3: The extracted data is transformed into the data warehouse format.
Step 4: Finally the transformed data is loaded into the data warehouse.
Step 5: During the process of staging, cleansing of data is done.
Step 6: When a user login, their performance is analyzed.
Fig-9: Methodology overview
16. CONCLUSION
The graphical representation of employee information and analysis report will help the organization to understand and measure the performance of each and every employee. This data integration project involves the data mining from various sources. It is difficult for an organization to store and update the information of an employee manually as it will consume more time and the data will be very large. Hence this project will be useful to analyze the reports of the employee for the betterment of the organization.
REFERENCES:
[1] M. Vijayakumar, V. P. Dharshini, and C. Selvan, "A New Key Management Paradigm for Fast Transmission in Remote Co-operative Groups," International Journal of Computer Science and Mobile Computing, 3, 2014, 197201.
[2] Saranya, S., Rajeshkumar, R., Shanthi, S.: A survey on anomaly detection for discovering emerging topics. Int. J. Comput. Sci. Mob. Comput. (IJCSMC) 3(10), 895–902 (2014)
[3] M. Lenzerini, "Data Integration: A Theoretical Perspective". PODS 2002. pp. 233–246
[4] [15] (2010) Data Integration Techniques. [Online]. Available:
http://it.toolbox.com/wiki/index.php/Data_integration_te chniques
[5] Shio Kumar Singh, Database System Concepts, Design and Application, Pearson Education, Second Edition, 2011.
[6] V. Arulkumar. "An Intelligent Technique for Uniquely Recognising Face and Finger Image Using Learning Vector Quantisation (LVQ)-based Template Key Generation." International Journal of Biomedical Engineering and Technology 26, no. 3/4 (February 2, 2018): 237-49. doi:10.1504/IJBET.2018.089951
[7] R. Arora, P. Pahwa, S. Bansal, "Alliance Rules of Data Warehouse Cleansing", IEEE International Conference on Signal Processing Systems Singapore, pp. 743-747, May 2009.
© 2019, IRJET | Impact Factor value: 7.211 | ISO 9001:2008 Certified Journal
| Page 789
[9] C.J.Date, A.Kannan and S.Swamynathan, an Introductionto Database Systems, Pearson Education, Eight Edition, 2009.
[10] Durai, K. N., and Baskaran, K. (2013, December), “Energy efficient random cast DSR protocol with mediation device in MANET”, In Advanced Computing and Communication Systems (ICACCS), 2013 International Conference on (pp. 1-5). IEEE.
[11] J. Bang, H. Noh, Y. Kim and G. G. Lee, "Example-based chat-oriented dialogue system with personalized longterm memory," 2015 International Conference on Big Data and Smart Computing (BIGCOMP), Jeju, 2015.
[12] J. Madhavan, P. A. Bernstein, and E. Rahm. "Generic schema matching with cupid," In Proceedings of the 27th International Conferences on Very Large Databases, 2001, pp. 49-58.
[13] E. Haller and T. Rebedea, "Designing a Chat-bot that Simulates an Historical Figure," 2013 19th International Conference on Control Systems and Computer Science, Bucharest, 2013.
[14] R. Bala Chandar, and M. S. Kavitha, A Proficient Model For High End Security in Cloud Computing, ICTACT Journal of Soft Computing, 04(02), 2014.
[15] Devipriya C., N. Saravanaselvam and Saradha S, “ACHIEVING INCREASED QOS, MAXIMIZED LIFETIME, BETTER ROUTING AND TARGET COVERA GE IN WIRELESS SENSOR NETWORKS” ARPN Journal of Engineering and Applied Sciences, VOL. 10, NO. 13, JULY 2015.
[16] A. Jeeva, Dr.C. Selvan, A. Anitha, “Secure Token Based Storage System to Preserve the Sensitive Data Using ProxyRe-Encryption Technique”, International Journal of Computer Science and Mobile Computing.
[17]https://help.talend.com/reader/wDRBNUuxk629sNcI 0dNYaA/3Lyn4CR4M5Q2uOD8FWmOwg