Computational Investigation of Ionic
Diffusion in Polymer Electrolytes for
Lithium-Ion Batteries
Thesis by
Daniel J. Brooks
In Partial Fulfillment of the Requirements for the degree of
Doctor of Philosophy
CALIFORNIA INSTITUTE OF TECHNOLOGY Pasadena, California
2018
2018 Daniel J. Brooks
ACKNOWLEDGEMENTS
I would like to thank my friends, colleagues, and family for their constant support and
encouragement during my time in graduate school.
I would like to thank my advisor, Prof. William A. Goddard III, for enabling me to explore
the field of quantum chemistry. I have learned many things from the projects that Bill
proposed, the suggestions that he made, the questions that he asked, and the resiliency that
he displays.
I would also like to thank the members of my thesis committee, Michael R. Hoffman, Mark
B. Wise, and Marco Bernardi, for providing valuable direction and advice.
I would like to thank my mentor, Boris V. Merinov, for his guidance, conversation, and
wisdom gained from many years of experience. I would like to thank Boris Kozinsky,
Jonathan Mailoa, and the rest of the Bosch chemistry group for funding much of this research
as well as providing valuable discussions and suggestions.
I would like to thank Asghar Aryanfar, A.J. Colussi, and the rest of the Hoffman group for
friendship and the opportunity to explore the dynamics of lithium dendrite growth.
I would also like to thank Saber Naserifar and Vaclav Cvcivek for being excellent colleagues,
excellent friends, and excellent mentors.
I would like to thank Frances Houle, Marielle Soniat, and the rest of JCAP for providing me
I would like to thank the many other members of the MSC group that I have had the pleasure
of interacting with, including Caitlin Scott, Tao Cheng, Wei-Guang Liu, Ross Fu, Hai Xiao,
Ho-Cheng Tsai, Yan Choi Lam, Andrea Kirkpatrick, Jason Crowley, Samantha Johnson,
Adam Griffith, Sijia Dong, Matthew Gethers, Yufeng Huang, Shane Flynn, Jin Qian, Yalu
Chen, Sergey Zybin, Si-Ping Han, Yoosung Jung, Robert “Smith” Nielsen, Hyeyoung Shin,
Jamil Tahir-Kheli, Darryl Willick, Ted Yu, Amir Mafi, Mamadou Diallo, Andres
Jaramillo-Botero, and any names that I may have missed. I would also like to thank my colleagues Ali
Kachmar and Francesco Faglioni. I have learned much from the group, both personally and
professionally.
I would also like to thank my former professors Bruce Kusse and Chris Xu for encouraging
me to apply to graduate school and guiding me through the process. I would also like to thank
Felicia Hunt and Christy Jenstad for their advice and advocacy.
I would like to thank my friends in the CCA program, applied physics class, Magic club,
Friday night dinner group, and greater Caltech community for your kindness and support and
bringing a smile to my face, even in difficult times.
Last but not least, I would like to thank my parents, Beth and Ian Brooks for their unwavering
support and kindness, my brother and sister, Andrew and Laura Brooks, for leading by
example, and my girlfriend, Angela Hebberd, for caring so deeply about me.
To the amazing people I have met in the past five and a half years, thank you. I could not
ABSTRACT
Energy storage is a critical problem in the 21st century and improvements in battery
technology are required for the next generation of electric cars and electronic devices. Solid
polymer electrolytes show promise as a material for use in long-lifetime, high energy density
lithium-ion batteries. Improvements in ionic conductivity, however, for the development of
commercially viable materials, and, to this end, a series of computational studies of ionic
diffusion were performed. First, pulsed charging is examined as a technique for inhibiting
the growth of potentially dangerous lithium dendrites. The effective timescale for pulse
lengths is determined as a function of cell geometry. Next, the atomistic diffusion mechanism
in the leading polymer electrolyte, PEO-LiTFSI, is characterized as a function of
temperature, molecular weight, and ionic concentration using molecular dynamics
simulations. A novel model for describing coordination of lithium to the polymer structure
is developed which describes two types of interchain motion “hops” and “shifts,” the former
of which is shown to contribute significantly to ionic diffusion. The methodology developed
in this study is then applied to a new problem – the adsorption of CO2 at the surface of
semi-permeable polymer membranes. Finally, a new method, PQEq, is developed, which provides
an improved description of electrostatic interactions with the inclusion of explicit
polarization, Gaussian shielding, and charge equilibration. The dipole interaction energies
obtained from PQEq are shown to be in excellent agreement with QM and a preliminary
application of PQEq to a polymer electrolyte suggest that it can provide an improved
description of ionic diffusion. Taken as a whole, these techniques show promise as tools to
PUBLISHED CONTENT AND CONTRIBUTIONS
A Aryanfar, DJ Brooks, BV Merinov, WA Goddard III, AJ Colussi, MR Hoffman. (2014). “Dynamics of lithium dendrite growth and inhibition: Pulsed charging
experiments and Monte Carlo calculations”. In: The journal of physical chemistry letters 5 (10), pp. 1721-1726. doi: 10.1021/jz500207a
DJ Brooks developed the Monte Carlo model, carried out the simulations, and prepared the modeling section
DJ Brooks, BV Merinov, WA Goddard III (2018). “Atomistic Description of Ionic Diffusion in PEO-LiTFSI : Effect of Temperature, Molecular Weight, and Ionic concentration”. In preparation (2018).
DJ Brooks carried out the simulations, performed the analysis, and wrote the manuscript.
M Soniat, M Tesfaye, DJ Brooks, BV Merinov, WA Goddard III, AZ Weber, FA Houle. (2018). “Predictive simulation of non-steady-state transport of gases through rubbery polymer membranes”. In: Polymer 134, pp.125-142. doi: 10.1016/j.polymer.2017.11.055
DJ Brooks carried out molecular dynamics simulations, described the gas/polymer interface and wrote the corresponding section of the manuscript.
S Naserifar, DJ Brooks, WA Goddard III, V Cvicek. (2017). “Polarizable charge equilibration model for predicting accurate electrostatic interactions in molecules and solids”. In: The journal of chemical physics 146 (12), pp. 124117. doi:
10.1063/1.4978891
TABLE OF CONTENTS
Acknowledgements………...iv
Abstract ………...….…vi
Published Content and Contributions………...vii
Table of Contents………viii
List of Illustrations and/or Tables……….…xi
Nomenclature………...…xi
Introduction ... 1
Chapter I: Inhibiting Dendrite Growth with Pulsed Charging ... 7
Chapter II: Ionic Diffusion in PEO-LiTFSI ... 23
Chapter III: Polarizable Charge Equilibration (PQEq) ... 46
Development of PQEq for PEO-LiTFSI ... 77
Appendix A: Supporting Information – Pulsed Charging ... 85
Appendix B: Study of CO2 adsorption on rubbery polymer membranes ... 93
Appendix C: Supporting Information – Ionic Diffusion in PEO-LiTFSI ... 102
Appendix D: Supporting Information – PQEq Method ... 136
Appendix E: Supporting Information – Testing PQEq Damping ... 154
LIST OF ILLUSTRATIONS AND/OR TABLES
Number Page
1. Cross sectional view of lithium coin cell ... 12
2. Effect of pulsed charging on dendrite length ... 12
3. Parameters used in Monte Carlo calculations ... 17
4. Dendrite morphologies for DC charging ... 20
5. Simulated dendrite morphologies for γ=3 ... 21
6. Simulated dendrite morphologies for γ=1 ... 21
7. Simulated dendrite tip and electric field ... 22
8. PEO-LiTFSI molecular dynamics structure ... 28
9. Lithium MSD at 480K ... 30
10. Lithium chain coordination schematic ... 31
11. Li-O radial distribution function ... 32
12. Local coordination site of lithium to PEO ... 33
13. Ionic diffusion as a function of chain length ... 34
14. Ionic diffusion as a function of molecular weight ... 36
15. Activation energies for ionic diffusion ... 36
16. Most diffusive lithium – 360K ... 37
17. Least diffusive lithium – 360K ... 38
18. Most diffusive lithium – 480K ... 39
19. Least diffusive lithium – 480K ... 40
20. Frequency of lithium coordination changes ... 41
21. Average lithium displacements as a function of coordination ... 43
22. Displacements of polymer backbone oxygen ... 44
23. PQEq model of atomic cores and shells ... 54
24. Dipole interaction energies in PQEq model for cyclohexane ... 64
25. Dipole interaction energies for additional structures ... 68
27. REAXFF simulation of RDF crystal ... 72
28. Comparison of charge methods ... 75
29. Polymer structure for periodic QM simulation ... 78
30. Polymer PQEq versus Mulliken charges ... 79
31. PQEq description of ionic diffusion ... 81
32. Observed dendrites ... 87
33. PDMS surface structure ... 97
34. Molecular dynamics description of adsorption ... 99
35. Table of adsorption outcomes ... 100
36. Charges used in fixed charge simulations ... 103
37. Comparison of experiment measurements of ionic diffusion ... 104
38. All MSD plots for fixed charge description of ionic diffusion ... 107
39. Mulliken charges as a function of basis set ... 144
40. Mulliken and ESP charges with the Dreiding Force Field ... 145
41. Parameter set for PQEq0 ... 146
42. Parameter set for PQEq1 ... 149
43. Absolute percentage change from PQEq0 to PQEq1 ... 149
44. Electric dipole scan over selected test set cases ... 150
45. Electrostatic interaction energies of fixed charge models ... 152
46. Effect of damping – QEq charges ... 154
NOMENCLATURE
PEO. Polyethylene oxide. A flexible polymer chain that has a C-C-O backbone.
TFSI. Bis(trifluoromethane)sulfominide. An anion with the structure N(SO2CH3)2-.
PDMS. Polydimethylsiloxane. A polymer chain with a SiO(CH3)2-O backbone.
QM.Quantum mechanics or a quantum-mechanics based method.
DFT.Density functional theory.
FF.Classical force field.
OPLS. Optimized Potential for Liquid Simulations, a non-reactive force field.
PQEq. Polarizable Charge Equilibration method featuring explicit polarization.
MPA.Mulliken population analysis charges
I n t r o d u c t i o n
LITHIUM-ION BATTERIES FOR ENERGY STORAGE
Energy storage is a critical problem in the 21st century. As the world population
grows, so too does the demand for energy and energy storage materials. The
development of the next generation of cars, personal electronics, and renewable
energy sources hinges on improvements in battery technology.
A battery, simply defined, consists of one or more electrochemical cells which
provide power to external devices.3 More generally, batteries allow for chemical
energy to be converted into electrical energy and vice versa.
All battery cells contain the same basic components. Each battery has an
electropositive cathode and an electronegative cathode. Charge-carrying ions
travel from one electrode to the other through an ion-conducting and electrically
insulating electrolyte material. The battery is charged by applying a positi ve
voltage to the cathode, driving the positive charge carriers to the anode. The
potential energy stored in the battery can be released by connecting it to a closed
circuit. The electromotive force (Ɛ), measured in volts, depends on the difference
in electronegativity between the anode and the cathode.
Battery performance depends on two metrics. First, the cell must have a high
specific energy, in units of Watt-hour/kg. This is particularly important for
fundamentally limited by the size of the battery cell. Second, the cell must be
safe, reliable, and long-lasting. In the ideal battery, each charge-discharge cycle
would be a completely reversible practice. In practical batteries, however, the
cycle is never completely reversible and there is a capacity loss over time4, 5.
Research aimed at developing better batteries typically focuses on selecting
better battery components: cations, anions, cathode materials, anode materials,
and electrolytes.
A number of materials, including lead5 and sodium6, can serve as a cation in the
battery cell. Lithium, however, remains the most widely used cation in
high-performance batteries, particularly for portable devices. As lithium is the lightest
metal, lithium-based batteries tend to achieve high specific energies7.
Depending on the chemistry of the battery, a number of anions maybe viable.
Smaller anions, such as fluoride8 have a tendency to clump with lithium and form
a precipitate. To a lesser extent, this is also true for mid -sized ions such as
tetrafluoroborate (BF4-) and hexafluorophosphate (PF6-)9. Larger ions, such as
bis(trifluoromethanesulfonyl)imide (TFSI-)1, 2 distribute their charge over a
larger molecule and are less likely to coordinate strongly to lithium.
The selection of electrode material depends on the use case of the battery.
Lithium-metal10 anodes boast a high specific energy, but degrade after a single
charging cycle. For rechargeable lithium batteries, graphite11 most commonly
materials as well, such as lithium cobalt oxide (LiCoO2)12 and lithium nickel
manganese cobalt oxide (LiNiMnCoO2)13. Nanostructured electrode materials are
also a topic of active research14.
A number of electrolytes are in use in batteries today. Generally, there is a
tradeoff between conductivity and chemical stability in electrolyte materials: the
greater the conductivity, the shorter the lifetime. Liquid electrolytes, such as
propylene carbonate, have high ionic conductivities15, but irreversible chemical
processes16-18 can limit the cycling lifespan of such cells. Additionally, liquid
electrolytes are prone to the formation of lithium dendrites19, 20, which can short
circuit and overheat the battery. Many current cells today use a separator21 to
mitigate this problem.
Polymer electrolytes are a promising electrolyte material. A polymer matrix,
most commonly poly(ethylene-oxide)22-24, is placed between the anode and
cathode, providing sites for lithium to diffuse while blocking dendrite growth.
The primary limitation to polymer electrolytes is the relatively low di ffusion
coefficient25. Discovering ways of increasing ionic diffusion within a polymer is
currently a question of great interest. A number of novel mechanisms have been
proposed for increasing diffusion in polymer electrolytes, including
crosslinkers26 and plasticizers27. Recent experiments have focused on
characterizing diffusion in polymer electrolytes as a function of molecular
For a fixed battery chemistry, improvements in battery performance can be
realized by optimizing other operating conditions, such as temperature1 or
voltage29. For example, studies have suggested that charging a battery with a
square wave voltage pulse at the appropriate frequency inhibits lithium dendrite
growth19, 29, 30.
Since the chemistry of the battery electrolyte can be complex, some assumptions
must be made in order to describe ionic migration. The primary assumption is
that changes in ion motion is driven by diffusion, i.e.,
∇2𝑐
𝑖𝑜𝑛 = −
𝜕𝑐𝑖𝑜𝑛
𝜕𝑡 . (1)
For a particular ion, the expected displacement is given by the
Einstein-Smoluchowski equation31,
〈|𝑟⃗𝑖𝑜𝑛(𝑡)|〉 = √2𝑑𝐷𝑡 (2)
where 𝑟⃗𝑖𝑜𝑛(𝑡) is the displacement of the ion, D is the diffusion coefficient, 𝑡 is time of
diffusion and 𝑑 is the dimension of the space. For d=3, this reduces to:
〈|𝑟⃗𝑖𝑜𝑛(𝑡)|〉 = √6𝐷𝑡 (3)
The square of equation (3) relates the mean-squared-displacement (MSD) of a
MSD(𝑡) = 〈|𝑟⃗𝑖𝑜𝑛(𝑡)|2〉 = 6𝐷𝑡 (4)
Note that the diffusion assumption in equation (1) holds for ionic motion in
sufficiently long trajectories, as over short periods of time, an ion might oscillate
back and forth in a local site. These oscillations correspond to a sublinear
dependence of MSD(t) on t in loglog space. When equation (4) is used to
estimate ionic diffusion coefficients from simulation, care has to be taken to
consider simulations long enough to reach the Fickian regime.
The method of modeling diffusion is simply the integration of equation (2). The
accuracy of this expression can be improved by including the effect of the
electromigration due to the electric field. Note that, due to ionic shielding, this
field is largest near the electrode32, 33. A complete description of ionic diffusion
requires a force-field description of bonds, angles, torsions, and non-bonds.
Although useful, traditional force fields make a rather large assumption: that
charges are fixed and non-polarizable34. Limited work has been done on the
development of polarizable force fields for polymer electrolytes34, 35.
This thesis contains a number of studies aimed at understanding the ionic
diffusion in lithium-ion battery materials. In Chapter I, lithium dendrite growth
is analyzed using a simple Monte Carlo model with electromigration term. The
study shows that pulsed charging over intervals of ~1ms inhibits dendrite growth
due to the relaxation of concentration gradients. In Chapter II, a force field
concentration, molecular weight and temperature. The relative diffusion
coefficients are shown to be in good agreement with experiment. The most and
least diffusive lithium atoms are analyzed and a novel model for characterizing
chain hopping suggests that both the motion of the polymer backbone and
interchain hopping contribute to ionic diffusion. The methodology developed in
chapter II was also applied to a description of the CO2 adsorption process in
semi-permeable polymer membranes, as described in Appendix B. In Chapter
III, a polarizable charge equilibration scheme (PQEq) is developed. The model,
which describes atomic charges as polarizable Gaussian shells, is shown to
produce charges in good agreement with QM methods. Furthermore, PQEq
interaction energies are shown to be significantly closer to QM than fixed charge
methods over a cyclohexane-based training set. Initial PQEq simulations of ionic
diffusion in PEO-LiTFSI look promise, but additional study in needed. These
results serve as a platform for future studies of ionic diffusion in lithium-ion
C h a p t e r I
DYNAMICS OF LITHIUM DENDRITE GROWTH AND INHIBITION:
PULSED CHARGING EXPERIMENTS AND MONTE CARLO
CALCULATIONS
With contributions from Asghar Aryanfar, Boris V. Merinov, William A. Goddard III, Agustin J. Colussi, and Michael R. Hoffman
Acknowledgement: The main part of this chapter is published in the Journal of Physical Chemistry Letters, 2014, 5(10), pp1721-1726.
Abstract
Short-circuiting via dendrites compromises the reliability of Li-metal batteries. Dendrites
ensue from instabilities inherent to electrodeposition that should be amenable to dynamic
control. Here, we report that by charging a scaled coin-cell prototype with 1ms pulses
followed by 3ms rest periods, the average dendrite length is shortened ~2.5 times relative to
those grown under continuous charging. Monte Carlo simulations dealing with Li+ diffusion
and electromigration reveal that experiments involving 20ms pulses were ineffective because
Li+ migration in the strong electric fields converging to dendrite tips generates extended
depleted layers that cannot be replenished by diffusion during rest periods. Because the
application of pulse much shorter than the characteristic time τc~O(~1ms) for polarizing
electric double layers in our system would approach DC charging, we suggest that dendrite
propagation can be inhibited, albeit not suppressed, by pulse charging within appropriate
Introduction
The specific high energy and power capacities of lithium metal (Li0) batteries are ideally
suited to portable devices and are valuable as storage units for intermittent renewable energy
sources36-42. Li0, the lightest and most electropositive metal, would be the optimal anode
material for rechargeable batteries if it were not for the fact that such devices fail
unexpectedly by short-circuiting via the dendrites that grow across electrodes upon
recharging19, 43. This phenomenon poses a major safety issue because it triggers a series of
adverse events that start with overheating, which is potentially followed by the thermal
decomposition and ultimately the ignition of the organic solvents used in such devices44-46.
Li0 dendrites have been imaged, probed, and monitored with a wide array of techniques39,
40, 47. Moreover, their formation has been analyzed33, 48 and simulated at various levels of
realism19, 49, 50. Numerous empirical and semiempirical strategies have been employed for
mitigating the formation of Li0 dendrites that were mostly based on modifications of
electrode materials and morphologies and variations of operational conditions37. Thus,
reports can be found on the effects of current density51-53, electrode surface
morphology44, solvent and electrolyte composition54-57, electrolyte
concentration51, evolution time58, the use of powder electrodes20, and adhesive lamellar
block copolymer barriers59 on dendrite growth. We suggest that further progress in this
field should accrue from the deeper insights into the mechanism of dendrite propagation
that could be gained by increasingly realistic and properly designed experiments and
modeling calculations56, 60. We considered that Li0 dendrite nucleation and propagation are
48. Furthermore, in contrast with purely diffusive crystal growth, that Li-ion (Li+)
electromigration is an essential feature of electrolytic dendrite growth61. More specifically,
we envisioned that runaway dendrite propagation could be arrested by the relaxation of the
steep Li+ concentration gradients that develop around dendrite tips during charging. This
is not a new strategy62, but to our knowledge the quantitative statistical impact of pulses of
variable duration on dendrite length has not been reported before. Herein, we report
experiments focusing on dendrite growth in a scaled coin cell prototype fitted with
Li0 electrodes charged with rectangular cathodic pulses of variable frequencies in the
kilohertz range. We preserve the geometry and aspect ratio of commercial coin cells in our
prototype, the dimensions of which facilitate the visual observation of dendrites. The
effects of pulsing on stochastic phenomena such as dendrite nucleation and growth are
quantified for the first time on the basis of statistical averages of observed dendrite length
distributions. We also present novel coarse-grained Monte Carlo model calculations that,
by dealing explicitly with Li+ migration in time-dependent nonuniform electric fields,
provide valuable insights into the underlying phenomena. We believe our findings could
motivate the design of safer charging protocols for commercial batteries. Current efforts in
our laboratory aim at such a goal.
Methods
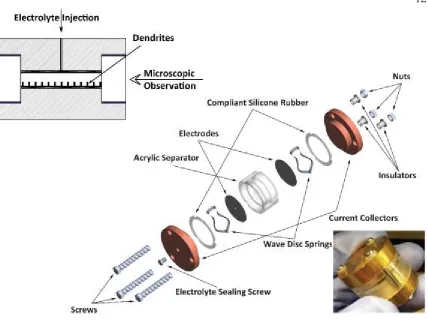
We performed our experiments in a manually fabricated electrolytic cell that provides for
in situ observation of the dendrites grown on the perimeter of the electrodes at any stage
(Figure 1). The cell consists of two Li0 foil disc electrodes (1.59cm diameter) separated
propylene carbonate (PC) as electrolyte. We conducted all operations in an argon-filled
(H2O, O2<0.5 ppm) glovebox. Arrays of multiple such cells were simultaneously
electrolyzed with trains of 2mAcm–2 pulses of variable t
ON durations and γ = tOFF/tON idle
ratios generated by a programmable multichannel charger. After the passage of 48mAh
(173 Coulombs) through the cells, we measured the lengths of 45 equidistant dendrites
grown on the cells perimeters by means of Leica M205FA optical microscope through the
acrylic separator. Because dendrites propagate unimpeded in our device—that is, in the
absence of a porous separator—our experiments are conducted under conditions for
controlling dendrite propagation that are more adverse than those in actual commercial
cells. Further details can be found in Experimental Details in Appendix A.
Results
The lengths and multiplicities [λi, pi] of the 45 dendrites measured in series of experiments
performed at tON = 1 and 20ms, γ = 0 (DC), 1, 2, and 3, are shown as histograms in
Appendix A. Dendrite lengths typically spanned the 200 μm–3000 μm range. Their average
length α defined by equation 1
=
∫ 𝑝
𝑖𝜆
𝑖∫ 𝑝
𝑖(2)
represents a figure of merit more appropriate than the length of a single dendrite chosen
arbitrarily for appraising the effect of pulsing on the outcome of stochastic processes. The
resulting α values, normalized to the largest α in each set of experiments, are shown as blue
the application of [tON=1ms; tOFF=3ms] pulse trains reduces average dendrite lengths by
Figure 1: Top down: cross-sectional view, expanded view, and outer photograph of the cell
Basic arguments help clarify the physical meaning of the tON∼ 1 ms time scale. The mean
diffusive (MSD) displacement of Li+ ions, MSD = (2 D
+ t)1/2 (where D+ is the experimental
diffusion coefficient of Li+ in PC), defines the average thickness of the depletion layers
created (via Faradaic reduction of Li+ at the cathode) that could be replenished by diffusion
during t rest periods33. Notice that MSD is a function of time1/2 and depends on a property of
the system (D+), that is, it is independent of operating conditions such as current density.
From the Einstein relationship, D+ = μ+ (RT/F)63 (μ+ is the mobility of Li+ in PC), the electric
fields |E|c at which Li+ electromigration displacements, EMD = μ+ |E|c t, that would match
MSD are given by equation 3:
|𝐸|𝑐 = √
2𝑅𝑇 𝐹 ∗
1
√µ+𝑡 (3)
Thus, with (2 RT/F) = 50mV at 300K, μ+ = 1 × 10⁻⁴ cm2V–1s–1, and t = 1ms, we obtain
|E|c = 707 V cm–1, which is considerably stronger than the initial field between the flat
parallel electrodes: |E|0∼ V0/L = 9.4Vcm–1. Cathode flatness and field homogeneity,
however, are destroyed upon the inception of dendrites, whose sharp (i.e., large radii of
curvature) tips induce strong local fields33, 64. Under such conditions, Li+ will preferentially
migrate to the tips of advancing dendrites rather than to flat or concave sectors of the
cathode surface33, 48, 65-67. Because the stochastic nature of dendrite propagation necessarily
generates a distribution of tip curvatures, the mean field condition EMD ≤ MSD at
dendrites the inequality EMD > MSD will apply at the end of tON pulses. Thus, larger
|E|c values would extend the EMD ≤ MSD conditions to dendrites possessing sharper tips,
that is, to a larger set of dendrites that could be controlled by pulsing. Note the weak |E|c∝
μ+–1/2∝ η–1/2 dependence on solvent viscosity η.
From this perspective, because |E|c∝ t–1/2, the application of longer charging pulses will
increase the width of the depletion layers over a larger subset of dendrites to such an extent
that such layers could not be replenished during rest periods. The preceding analysis clearly
suggests that shorter tON periods could be increasingly beneficial. Could tON be shortened
indefinitely? No, because charging at sufficiently high frequencies will approach DC
conditions. The transition from pulsed to DC charging will take place
whenever tON becomes shorter than the characteristic times τc of the transients associated
with the capacitive polarization of electrochemical double layers. This is so because
under tON pulses shorter than τc most of the initial current will be capacitive, that is,
polarization will significantly precede the onset of Faradaic interfacial electron transfer. A
rule-of-thumb for estimating τc on “blocking” electrodes via eq 332, 68-71
𝜏
𝐶=
𝜆
𝐷𝐿
𝐷
+ (4)leads to τc∼3.3ms. In eq 3, λD=(ε(kBT/2)z2e2C0)1/2 is the Debye screening length, L the
interelectrode gap, and D+ the Li+ diffusion coefficient. In our system, with C
0 = 1M
Li+ solutions in PC (ε=65), D
+=2.58×10⁻⁶cm2s–1, at 298 K, λD=0.27. Because the double
is apparent that the decreasing amplitude of polarization oscillations under trains
of tON pulses much shorter than ∼ τc will gradually converge to DC charging.
In summary, shorter tON pulses are beneficial for inhibiting dendrite propagation but are
bound by the condition tON ≥ τc. The underlying reason is that shorter tON pulses inhibit
dendrite at earlier propagation stages where the curvatures of most dendrite tips have not
reached the magnitude at which local electric fields would lead to the EMD > MSD
runaway condition. Notice that the stage at which dendrite propagation can be controlled
by pulsing relates to the curvature of tip dendrites, which is a morphological condition
independent of current density. Higher current densities, however, will shorten the
induction periods preceding dendrite nucleation66.
These ideas were cast and tested in a coarse-grain Monte Carlo model that, in accord with
the preceding arguments, deals explicitly with ion diffusion, electromigration, and
deposition. It should be emphasized that our model is more realistic than those previously
reported19 because it takes into account the important fact that dendritic growth is critically
dependent on the strong electric fields that develop about the dendrites tips upon
charging72. The key role of electromigration in dendrite propagation has been dramatically
demonstrated by the smooth Li0 cathode surfaces produced in the presence of low
concentrations of nonreducible cations, such as Cs+ that, by preferentially accumulating on
dendrite tips, neutralize local electric fields and deflect Li+ toward the flat cathode
regions38. Given the typically small overpotentials for metal ion reduction on metallic
electrodes63, we consider that the effect of the applied external voltage on dendrite growth
other words, the population of electroactive Li+ species within the partially depleted
double layers surrounding the cathode should be established by the competition of ion
diffusion versus electromigration rather than Li+ deposition. Note furthermore that in our
model dendrite nucleation is a purely statistical phenomenon, that is, nucleation occurs
spontaneously because there is a finite probability that two or more Li+ ions are
successively reduced at a given spot on the cathode surface. Once a dendrite appears, a
powerful positive feedback mechanism sets in. The enhanced electric field at the tip of the
sharp dendrites draws in Li+ ions faster, thereby accelerating dendrite growth/propagation
and depleting the solution of Li+ in its vicinity. The concentration gradients observed
nearby growing dendrites are therefore deemed a consequence of the onset of dendrites. In
our view, simultaneity does not imply causality73, 74, that is, we consider that Li+ depletion
around dendrites is more of an effect rather than the cause of dendrite nucleation. Note,
however, that experimentally indistinguishable mechanisms of dendrite nucleation are
compatible with our interpretation that the effects of pulsing on dendrite propagation arise
from the competition between ion diffusion and electromigration. Because of the
computational cost of atomistic modeling, we simulate processes in a 2D domain that is
smaller than the section of the actual cell. We chose its dimensions (L* × L* = 16.7 nm ×
16.7 nm, Table 1) to exceed the depth of actual depletion boundary layers at the cathode.
Because our calculations aim at reproducing the frequency response of our experiments,
simulation time was set to real time. Therefore, to constrain within our domain the
diffusional displacements occurring in real time, we used an appropriately scaled diffusion
∼ 0.3 L* after 1ms. The Einstein’s relationship above ensures that this choice sets the scaled mobility at μ+* = D+* (F/RT) = 5.6 × 10⁻⁹ cm2/(V s). Then, in order to have EMD*
= μ+* |E|* t ∼ MSD*, the scaled electric field must be |E|* = (Vanode – Vcathode)*/MSD* =
|E|0/5.6 × 10–5 = 1.7 × 10⁵Vcm–1, from which we obtain (Vanode – Vcathode)* = MSD*·1.7 ×
105 V cm–1 = 85mV. The two-dimensional Monte Carlo algorithm implemented on this
basis calculates the trajectories of individual Li+ ions via random diffusion and
[image:28.612.170.444.316.452.2]electromigration under time and position-dependent electric fields.
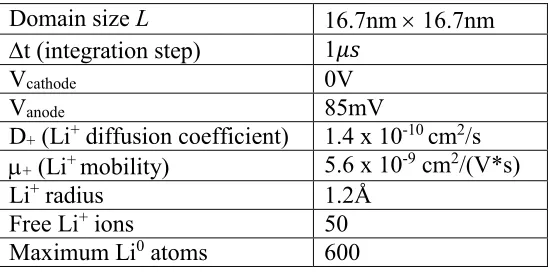
Table 1: Parameters Used in the Monte Carlo Calculations
Domain size L 16.7nm 16.7nm
t (integration step) 1𝜇𝑠
Vcathode 0V
Vanode 85mV
D+ (Li+ diffusion coefficient) 1.4 x 10⁻¹⁰ cm2/s
+ (Li+ mobility) 5.6 x 10⁻⁹ cm2/(V*s)
Li+ radius 1.2Å
Free Li+ ions 50
Maximum Li0 atoms 600
By assuming that Li+ ions reach stationary velocities instantaneously, their mean
displacements are given by
𝑟
𝑖⃗⃗⃗(𝑡 + ∆𝑡) − 𝑟
⃗⃗⃗(𝑡) = √2𝐷
𝑖 +∆𝑡𝑔̂ + µ
+𝐸⃗⃗∆𝑡
(5)The first and second terms on the right hand size of eq 3 are the mean displacements due to
ionic diffusion and electromigration, respectively.
𝑔̂
is a normalized 2D vector representingvector. By normalizing displacements relative to the interelectrode separation, L,
eq 4 transforms into eq 5
ξ
⃗(𝑡 + ∆𝑡) =
ξ
⃗(𝑡) + 𝜃𝑔̂ + 𝜂⃗.
(6)Dendrite lengths λi were evaluated as their height αi(t) above the surface of the electrode:
𝜆
𝑖(𝑡) = 𝑚𝑎𝑥
𝑘=1:𝑛
𝜉⃗
𝑘(𝑡) ∗ 𝒋.
(7)where j is the unit vector normal to the surface of the electrode and n is the total number of
lithium atoms incorporated into the dendrite.
By using the Einstein relationship above, the equation of motion becomes
𝑟⃗(𝑡 + ∆𝑡) − 𝑟⃗(𝑡) = √2𝐷
+∆𝑡𝑔̂ +
𝐹𝑅𝑇
𝐷
+∆𝑡𝐸⃗⃗,
(8)a function of D+Δt.
By neglecting electrostatic ion–ion interactions, given that they are effectively screened
because λD = 0.27 nm is smaller than the average interionic separation Ri,j = 1.2 nm, is
computed using Laplace’s equation:
𝛻
2𝜙 =
𝜕
2
𝜙
𝜕𝑥
2+
𝜕
2𝜙
It is obvious that this approximation prevents our model to account for charge
polarization, that is, the partial segregation of anions from cations under applied fields.
Thus, in our calculations the electric field is instantaneously determined by the evolving
geometry of the equipotential dendritic cathode. Note that the concentration gradients that
develop in actual depleted boundary layers would lead to even greater electric field
enhancements than reported herein. We were forced to adopt the approximation implicit in
eq 8 because the inclusion of ion–ion interactions and charge imbalances would be
forbiddingly onerous in calculations based on Monte Carlo algorithms. We consider,
however, that the inclusion of a variable electric field represents a significant advance over
previous models19.
Calculated dendrite heights were quantified by dividing the x axis (parallel to the surface
of the cathode) in four sectors. Here, “dendrite height” in each sector is the height of the
Li0 atoms furthest from the electrode. To ensure good statistics, each simulation was run
100 times, for a total of 400 measurements per data point. The key experimental result, that
is, that longer tOFF rest periods are significantly more effective in reducing α after tON=1ms
than tON=20ms charging pulses, is clearly confirmed by calculations
(Figure 2 and Appendix A). Figure 3 displays the results of sample simulations. Metallic
dendrites grow with random morphologies into equipotential structures held at V = 0V,
thereby perturbing the uniform electric field prevailing at the beginning of the experiments.
The high-curvature dendrite tips act as powerful attractors for the electric vector field,
which by accelerating Li+ toward their surfaces depletes the electrolyte and self-enhances
engulfed by dendrites because, by being surrounded with equipotential surfaces, Gauss’s
theorem ensures that the electric fields will nearly vanish therein63. It should be emphasized
that the key feature is that ion displacements from electromigration are proportional to τON,
whereas diffusive ones increase as τON1/2. Above some critical τON value, the depth of the
deplete layers will increase to the point at which they could not be replenished during the
ensuing rest periods of any duration.
These phenomena are visualized from the computational results shown in Figures 3–6.
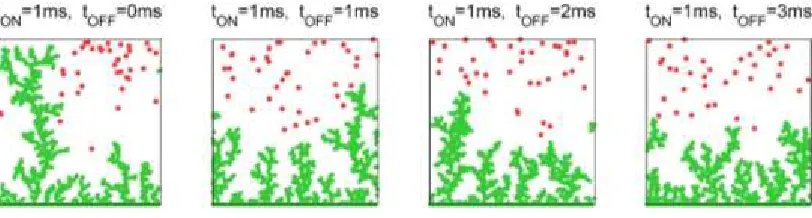
Figure 4 displays the dendrite morphologies created by pulsing at various γ’s. Calculations
for longer tOFF values show marginal improvements because ∂[Li+]/∂y gradients remain
largely unaffected in simulations for γ > 3. Figure 5 shows typical morphologies of
[image:31.612.127.533.418.527.2]dendrites consisting of a given number of deposited Li0.
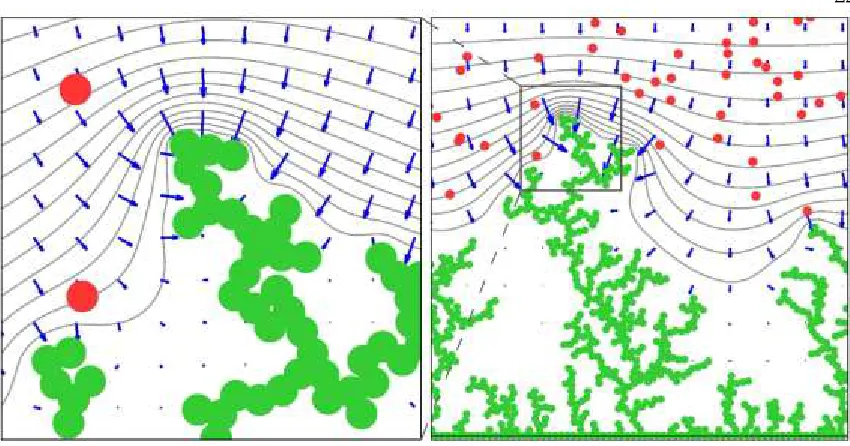
Figure 3: Left to right: dendrite morphologies for DC charging, charging with tON=1ms pulses at γ=tOFF/tON = 1, 2 and 3. Green dots: Li0. Red dots:
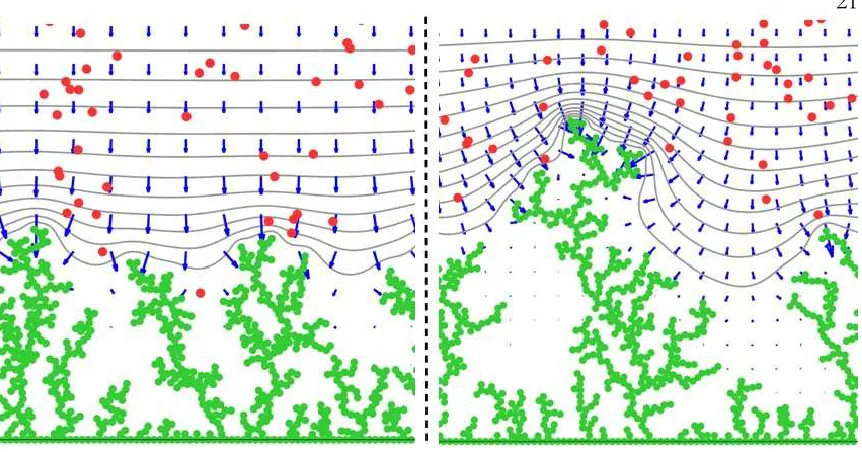
Figure 4: Simulations for charging with tON = 1 ms (left) and tON = 20 ms
(right) at = tOFF/tON = 3. Green dots: Li0. Red dots: Li+. Gray lines:
equipotential contours. Blue vectors: the electric field.
Figure 5: Simulations for charging with tON = 1 ms, = 1 pulses. Left: after
a charging pulse. Right: at the end of the successive rest period (right). Green dots: Li0. Red dots: Li+. Gray lines: equipotential contours. Blue
[image:32.612.108.533.393.613.2]Figure 6: Zooming in the tip of the leading dendrite produced by charging with tON=20ms, =tOFF/tON=3 pulses at 243ms, i.e., at the end of simulation
time. Green dots: Li0. Red dots: Li+. Gray lines: equipotential contours.
Blue vectors: the electric field.
Conclusions
In conclusion, we have demonstrated (1) that by charging our lithium metal cell with tON = 1
ms, γ = tOFF/tON = 3 pulse trains, the average dendrite length α is significantly reduced (by
∼70%) relative to DC charging and (2) that such pulses are nearly optimal for dendrite inhibition because they are commensurate with the relaxation time τc∼3 ms for the diffusive
charging of the electrochemical double layers in our system. Monte Carlo simulations
dealing explicitly with lithium ion diffusion, electromigration in time-dependent electric
fields, and deposition at the cathode are able to reproduce the experimental trends of tON on
C h a p t e r I I
ATOMISTIC DESCRIPTION OF IONIC DIFFUSION IN PEO-LITFSI:
EFFECT OF TEMPERATURE, MOLECULAR WEIGHT, AND IONIC
CONCENTRATION
With contributions from Boris V. Merinov and William A. Goddard III
Acknowledgement: Manuscript under preparation (2018).
Abstract
Understanding the ionic diffusion mechanism in polymer electrolytes is critical to the
development of better lithium-ion batteries. A molecular dynamics-based characterization
of diffusion in PEO/LiTFSI is presented across a range of temperatures, molecular weights
and ion concentrations, with relative diffusion coefficients shown to be in good agreement
with experimental measurements. To determine the atomistic diffusion mechanism, the
chain coordination of lithium atoms is then analyzed across a range of temperatures. The
most diffusive lithium atoms are shown to exhibit frequent interchain hopping, whereas the
least diffusive lithium atoms frequently oscillate or “shift” coordination between two or
more chains. Interestingly, these interchain shifts are shown to contribute little to overall
diffusion mechanism and may actually reduce the segmental motion of the polymer, which
is shown to contribute significantly to lithium diffusion. These results suggest that novel
polymer materials with both a flexible backbone and a low barrier for interchain diffusion
Introduction
Solid polymer electrolytes are promising materials in the development of high lifetime and
energy density lithium-ion batteries24. Originally designed for use in portable electronic
devices75, lithium-ion batteries now show promise as energy storage devices for renewable
energy sources such as solar and wind power, which produce intermittent power, as well
as electric vehicles. Recently, the availability of lithium-ion batteries for residential use has
increased with the release of home batteries like the Tesla Powerwall.
The typical, commercially available, lithium-ion battery consists of an organic liquid
electrolyte paired with a graphite anode and intercalated transition-metal-oxide cathode76.
Although high ionic conductivities can be obtained from liquid electrolytes, a high rate of
reactions77 limits both the lifespan and safety of these systems. Specifically, the formation
of dead lithium crystals78 can lead to capacity loss over repeated cycling, and the
propagation of lithium dendrites30, 44, 54 can lead to short circuits and, potentially,
combustion of the battery cell.
Solid polymer electrolytes mitigate the effects of these problematic reactions by guiding
lithium diffusion along a series of coordination sites along the polymer chains, slowing
side-reactions and greatly increasing the potential lifespan and range of safe operating
conditions of the battery cell79. Although a range of polymer backbones have been studied,
poly(ethylene oxide) (PEO)-based structures are currently the leading candidates for use in
lithium-ion batteries due to the flexibility of the polymer chains and presence of strong
widespread application of solid polymer electrolytes. Thus, a large research effort is
underway to improve the ionic conductivity of PEO-based polymers while maintaining the
mechanical strength1, 2, 24 of the PEO backbone.
The properties PEO-based structures depend strongly on the molecular weight of each
chain. Lower molecular weight structures tend to be more flexible and enable larger ionic
diffusion coefficients, albeit with reduced mechanical stability. To address this, a number
of modifications to the PEO structure have attempted to improve the stability of the
backbone, including the creation of block copolymers80, 81, comb-like82, 83 and
crosslinked84, 85 polymer structures. For sufficiently large molecular weights, the diffusion
coefficient and diffusion mechanism is independent of chain length, as well as the nature
of polymer end groups22.
The crystallization of lithium salts in polymer electrolytes can limit the effective number
of charge carriers, and thus the conductivity, within polymer electrolytes. Although a
number of anions, such as LiPF686, LiClO487, 88, and LiBF489, 90 have been studied,
bis(trifluoromethy-sulfonyl-imide) (TFSI) remains the leading anion candidate, in part, due
to its diffuse charge distribution and resistance to clumping24.
An early description of the diffusion dynamics in polymer electrolytes was provided by the
Dynamic Bond Percolation (DBP) model developed by Ratner91, 92, which can be used to
describe diffusion of through a disordered medium that contains a series of coordination
sites. The key assumption of the model is the presence of a renewal time, 𝜏𝑅, over which
model demonstrates that ionic motion is always diffusive for timescales longer than the
renewal time (t >> 𝜏𝑅).
A Rouse-based model for ionic diffusion was developed by Maitra93 and later extended by
Borodin and Diddens94, 95. This model builds upon the description of renewal events in
DBP by introducing a timescale τ1 associated with intrachain motion along a chain, τ2
which describes the relaxation time of the polymer chain for segmental motion, and τ3 as
the waiting time between interchain hops. The overall ionic diffusion rate can be expressed
as a combination of these three events93.
A growing body of experiments are being run on PEO-LiTFSI-based polymer systems.
Recently, Balsara23 measured Li+ and TFSI- conductivities across a range of molecular
weights (Mw=0.6-100 kg/mol) and ionic concentrations (r=0.02-0.08) using pulsed field
gradient nuclear magnetic resonance (NMR). Pożyczka28 recently studied the bulk ionic
conductivity as the well as the transference number, t+, of PEO-LiTFSI across a range of
ionic concentrations using impedance spectroscopy. Although, this range of molecular
weights and ionic concentrations is of great practical interest, limited molecular dynamics
simulations have been carried out across this regime.
In this work, a comprehensive study of ionic diffusion is performed across the range of
molecular weights, ion concentrations, and temperatures is performed and the relative
diffusion coefficients are shown to be in good agreement with experiment23. An analysis
of chain coordination reveals that polymer backbone, intrachain, and interchain motion
backbone motion suggests that the presence of lithium reduces segmental chain motion,
particularly when the lithium is coordinated to multiple chains. The implication of this
finding on the development of new polymer materials is discussed.
Methods
Force field parameters were assigned using the Desmond96 system builder with the
OPLS2005FF97. A timestep of 1fs was used for short range interactions and a timestep of
3fs was used for long range interactions, with the Desmond u-series method used to account
long range Coulomb interactions after a cutoff of 9Å. In agreement with charges from the
QM-based electrostatic potential (ESP) method, ionic charges of ±0.7 were used. A
Berendsen thermostat with a time constant of τ=1ps was used for NVT diffusion
simulations.
A series of polymer structures were created in an amorphous builder and each structure
was equilibrated with a series of minimization, NVT, NPT, and scaled-effective solvent
(SES)98 equilibration steps in order to fully relax the polymer chains. Full details of the
equilibration procedure are available in Appendix C. Structures were generated over a
range of ionic concentrations (r=0.02, 0.04, 0.06, 0.08 Li:EO). For the r=0.02 case,
structures were also constructed across a range of chain lengths (N=23, 45, 100, 450). To
maintain a near-constant (N=1000) number of monomers in the simulations, the cells were
constructed with m=43, 22, 10 and 2 chains, respectively. Simulations for these structures
were performed over a range of temperatures (360K, 400K, 440K, and 480K). Although
there is some difference in diffusion for the methyl-terminated chains in our simulations
higher molecular weights N>5022. The simulations at 400K, 440K, and 480K were run
for 115ns, while the simulations at 360K were run for 400ns to reach a regime characterized
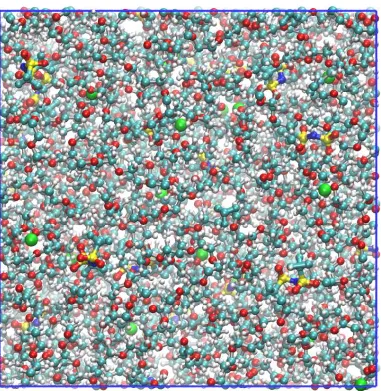
by Fickian diffusion. The polymer structure for r=0.02, N=100 at the end of the 400ns
[image:39.612.132.513.209.600.2]diffusion simulation is shown in figure 1.
teal. The PEO chain is identified with bonds shown in grey, oxygen in red, carbon in teal, and hydrogen are shown in white.
The ionic diffusion coefficient, Dion, was derived from the ionic mean-squared
displacement (MSD) curve using the 3D diffusion relation:
𝑀𝑆𝐷𝑖𝑜𝑛(𝑡) ≡ 𝑟(𝑡)⃗⃗⃗⃗⃗⃗⃗⃗⃗𝑖𝑜𝑛2 = 6𝐷
𝑖𝑜𝑛𝑡. (1)
Since this relation only holds for Fickian diffusion, care was taken to identify the Fickian
regime of the MSD curve. The largest domain, t, where the loglog slope is nearly unity
(within a tolerance of ±0.1) is selected as the fitting region, with a minimum width of one
tenth of the total simulation time to ensure good statistics. An example fit is shown in
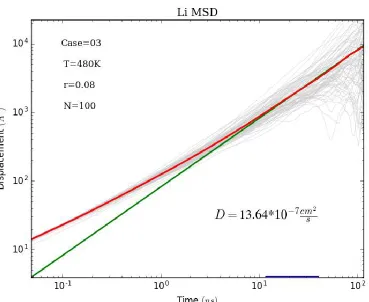
Figure 2: Mean-squared-displacement (MSD) plot of lithium ions diffusing through a PEO polymer matrix with a chain length of N=100 monomers over a 115ns simulation. To ensure a description of true, Fickian, diffusion, the diffusion coefficient is obtained by fitting the MSD curve (red) to a line, 6Dt (green), over the region where the loglog MSD slope is closest to 1. A complete listing of MSD plots can be found in figure S4 of Appendix C.
In order to obtain insight into the atomistic nature of diffusion, a model for lithium
coordination is developed. An individual lithium atom is described as coordinated to an
oxygen if it is within 2.5Å, roughly the outer width of the first Li-O coordination shell2. A
lithium atom’s position along a chain is tracked by assigning an index to polymer oxygen
1-100, as shown in Figure 3, and defining a lithium position along a chain as the mean
the chain with the greatest number of coordinated oxygen. In the event of a tie, the chain
with the smallest lithium-oxygen distance is considered to be the most coordinated chain.
Figure 3: A schematic summarizing the three outcomes of lithium motion: interchain “hops”, interchain “shifts”, and intrachain motion, represented by sites a, b, and c, respectively. A “hop” occurs when a lithium atom changes chain coordination and fully coordinates to a single new chain. A “shift” occurs when a lithium atom changes chain coordination, but remains “stuck” and coordinated to multiple chains. Intrachain motion occurs when lithium’s most coordinated chain remains constant and is characterized by a shift, ∆n, of the mean lithium-oxygen coordination site. Note that the typical lithium atom is coordinated to 4-5 oxygens, so the shift in coordination can be fractional.
Changes in coordination are tracked over 0.25ns intervals and characterized as intrachain
motion, interchain hopping or interchain shifting. For intrachain diffusion, when a lithium
atom remained coordinated to the same chain, we measured whether a lithium atom
remained fixed ∆n=0, shifted up to one oxygen site ∆n≤1, shifted up to two oxygen sites
∆n≤2, or shifted more than two oxygen sites ∆n>2. For interchain diffusion, when a lithium
where lithium was only coordinated to a single chain at the end, or a interchain shift,
where lithium remained coordinated to at least two chains.
Results
To understand the nature of local sites in the polymer structure, the coordination of lithium
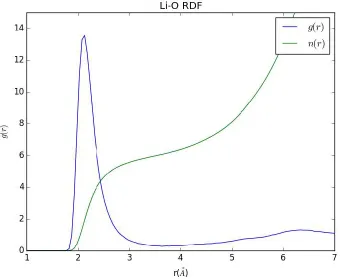
is analyzed. A plot of the lithium-oxygen radial distribution function is shown in figure 4.
The peak in coordination is observed at 2.12Å, in good agreement the 2.1Å peak observed
in a neutron scattering study1. The integrated radial distribution function shows that lithium
coordinates to an average 4-5 oxygen within a distance of 2.5Å.An example of a lithium
coordination site is shown in figure 5.
[image:43.612.137.477.363.642.2]measurements made with neutron scattering2. Additionally, the density of
the structure, 1.125 𝑔
𝑐𝑚3 is shown to be in the experimental range
1, 22, 23.
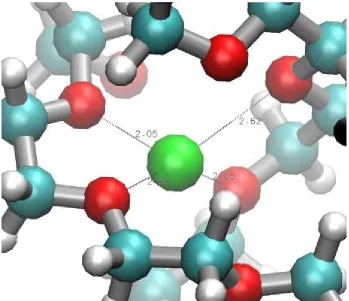
The local site of a lithium atom in the r=0.02/N=100 structure at 360K is shown in Figure
5. The lithium atom coordinates strongly (r<2.5Å) to 3 polymer oxygen, less than the
average of 3-4. Interestingly, these oxygen atoms belong to two separate polymer chains,
making this a relatively rare “shift” coordination in the context of the coordination model.
[image:44.612.150.499.304.605.2]A full discussion of lithium coordination is provided later in the text.
Next, the diffusion coefficients for lithium and TFSI are analyzed as a function of
temperature, molecular weight, and chain length. First, the computed diffusion coefficients
for lithium and TFSI as a function of chain length for N=23, 48, 100, 450 monomers are
shown in Figure 6. In both experiment and theory, the ionic diffusion coefficient is shown to
drop with increasing chain length, with a sharp drop between 23 and 100 monomers and a
plateau between 100 and 450 monomers, likely due to increased polymer motion of flexible
chain length. An analysis of polymer oxygen motion in table 1 confirms this description.
Although there is excellent agreement between the relative diffusion coefficients obtained
from theory and experiment, the theoretical values are systematically smaller than NMR data
by a factor of 3. This systematic shift is observed in a number of diffusion studies and could
be due to ionic charges99 or nature of the NMR measurement. Ionic diffusion coefficients
obtained from more recent experiments by Pożyczka are a factor of 5 lower than NMR,
which put the computed diffusion coefficients in the experimental range. A full discussion
Figure 6: Li and TFSI diffusion coefficients as a function of chain length N. Diffusion coefficients obtained from 400ns simulations at 360K are shown in red, and diffusion coefficients from 400K, 440K, and 480K simulations are shown in blue, green, and black respectively. Diffusion coefficients obtained from NMR measurements at 363K are shown in orange. Shorter chain lengths are shown to lead to larger ionic diffusion coefficients, with a particularly large increase occurring between chain lengths of N=23 and N=100 monomers.
The ionic diffusion coefficients for lithium and TFSI as a function of ionic concentration
are shown in Figure 7. The ionic diffusion coefficients drop slightly from r=0.02 to 0.08.
In the literature, this drop decrease has been attributed partially as an increase in the number
of salt clusters28. An analysis of oxygen and polymer displacements, in Figure 14 and Table
1, suggest that the presence of lithium ions may slow the segmental motion of the polymer
chains and thus the process of lithium diffusion.
In both experiment and theory, the diffusion coefficient slightly drops with increasing r,
but interestingly, a peak is observed at r=0.04. Although the reported experiments by
Balsara23 do not have a peak at this concentration, a recent set of IS measurements28
indicate such a peak, recent measurements by Pożyczka28 suggest a peak in ionic
Figure 7: Li and TFSI diffusion coefficients over a range of concentrations, r=0.02, 0.04, 0.06, and 0.08 (Li:EO). Diffusion coefficients obtained from molecular dynamics simulations at 360K, 400K, 440K, and 480K are shown in red, blue, green, and black, respectively. Diffusion coefficients obtained from NMR experiments at 363K are shown in orange and IS experiments at 373K are shown in purple. The overall diffusion coefficient is shown to decrease slightly with ionic concentration. The computed diffusion coefficients lie within the experimental range.
The activation energies for lithium and TFSI diffusion are shown in figure 8 as a function of chain length and ionic concentration. These values are in the range reported by Gorecki1, and
Figure 8: Li and TFSI activation energies over a range of chain lengths, N=23, 45, 100, 450, and concentrations r=0.02, 0.04, 0.06 and 0.08 Li:EO. The computed activation energy depends weakly on chain length and concentration within this regime, in agreement with experimental measurements1.
To understand the atomistic nature of diffusion, the coordination model is then used to
analyze the atoms with the largest and smallest mean-squared-displacements (MSD) over
the simulation time. These atoms are denoted as the most and least diffusive lithium. The
chain coordination of the most diffusive lithium atom in the r=0.02 Li:EO, N=100
simulation at 360K is plotted as a function of time in Figure 9. The structure on the right
shows the real space position of this single lithium atom evolving over time, over 0.25ns
intervals. The lithium resides on the 8th chain for around 30ns before hopping to the 9th
chain, then the 5th. Overall, the most diffusive lithium moves 59.3Å in 400ns and
coordinates to a total of seven chains.
Figure 9: Examines the coordination and displacement behavior of the single most diffusive lithium atom in the 360K/20LiTFSI/N=100 simulation as a function of time. The plot on the left shows the most coordinated chain as a function of time throughout the 400ns simulation.
The structure on the right displays the real positions of the lithium at points spaced every 1ns in the trajectory. Over the duration of the simulation, this lithium atom diffuses a total of 59.3Å and coordinates to a total of 7 chains.
For comparison, the coordination behavior of the least diffusive lithium atom in this
simulation is shown in figure 10. This lithium atom only diffuses a total of 12.2Å and
coordinates to the 8th chain for most of the simulation, occasionally shifting between
chains.
These results suggest that there is considerable variability in the diffusional behavior of
individual ions. The more diffusive lithium in this case more frequently hopped between
chains, whereas the less diffusive lithium atom only temporarily shifted between chains. A
complete analysis of diffusion as a function of coordination change is shown in figure 13.
Figure 10: Examines the coordination and displacement behavior of the single least diffusive lithium atom in the r=0.02Li:EO, N=100 simulation at 360K as a function of time. The plot on the left shows the most coordinated chain as a function of time throughout the 400ns simulation. The structure on the right displays the real positions of the lithium at points spaced every 1ns in the trajectory. Over the duration of the simulation, this lithium atom
diffuses a total of 12.2Å and remains primarily coordinated to chain #8 for the majority of the simulation.
This analysis was repeated for the most and least diffusive lithium atoms for the r=0.02
Li:EO, N=100 simulation at 480K and the results are shown in figures 11 and 12. At this
temperature, numerous interchain hops are observed over the 115ns trajectory and the total
displacements of the lithium are 115.4Å and 45.5Å, respectively. These results suggest a
change in the mechanism for diffusion at higher temperatures, as lithium are more able to
overcome the barriers for interchain diffusion. This mechanism is analyzed in terms of the
hopping model, shown in figure 3, in the discussion section.
Figure 11: Examines the coordination and displacement behavior of the single most diffusive lithium atom in the 480K/20LiTFSI/N=100 simulation as a function of time. The plot on the left shows the most coordinated chain as a function of time throughout the 115ns simulation. The structure on the right displays the real positions of the lithium at points spaced every 1ns in the trajectory. Over the duration of the simulation, this lithium atom diffuses a total of diffuses a total of 115.4Å with frequent hops between all 10 PEO chains.
Figure 12: Examines the coordination and displacement behavior of the single least diffusive lithium atom in the r=0.02, N=100 simulation at 480K as a function of time. The plot on the left shows the most coordinated chain as a function of time throughout the 115ns simulation. The structure on the right displays the real positions of the lithium at points spaced every 0.25ns in the trajectory. Over the duration of the simulation, this lithium atom diffuses a total of diffuses a total of 45.5Å with frequent hopping between all 10 PEO chains.
Discussion
The changes in chain coordination of the most and least diffusive lithium atoms suggest a
connection between chain coordination and total lithium displacement. In order to examine
this, changes in lithium coordination are tracked every ∆t=0.25ns in the trajectory. The
hopping model, shown in figure 3, describes lithium motion as intrachain diffusion,
interchain “hops” between chains, and interchain “shifts” when lithum remains coordinated
to multiple chains.
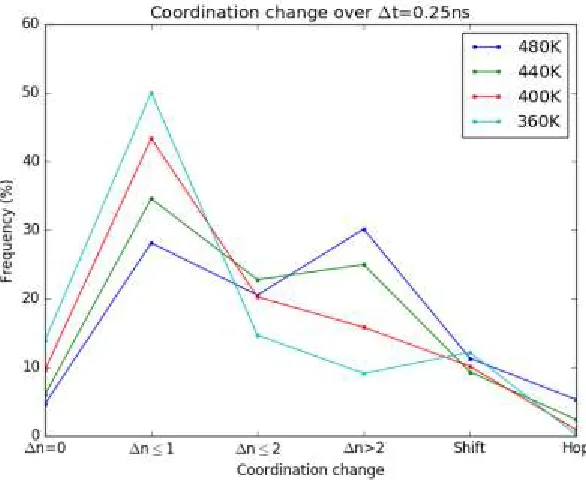
An analysis of the lithium coordination frequency is shown as a function of temperature in
figure 13. A small number of lithium atoms undergo no change in coordination, ∆n=0.
Small intrachain hops, ∆n≤1, correspond to slight changes in the lithium-oxygen
coordination shell and are the frequent transition at lower temperatures T=360K, 400K,
440K. Increases in temperature are correlated with an increased frequency of large
intrachain hops, ∆n>2 and interchain hops, which suggests that an activation barrier is
associated with these processes. Interestingly, the frequency of shifts is seen to be
independent of temperature, suggesting that this coordination pattern is geometric in nature
rather than energy-mediated. The lithium displacements corresponding to these processes
are shown in figure 14.
[image:52.612.173.466.332.572.2]rather than energy-mediated. The lithium displacements corresponding to these processes are shown in figure 14.
The displacements associated with each of these diffusion processes are shown in figure
14. For no change in coordination, the lithium displacements, ∆n=0 caused by the
segmental motion of the polymer chains. This segmental motion is shown to be the
dominant contributor to ionic diffusion over short timescales. Intrachain changes in
coordination along a chain (∆n>0) contribute to the overall lithium diffusion, but intrachain
hops alone are not enough to reach the Fickian diffusion limit. Interchain hops, on the other
hand are correlated with the largest increases in lithium motion and contribute significantly
to the diffusion process. Taken together, these results suggest that the atomistic nature of
lithium diffusion is consistent with the Rouse93 model formulation – the segmental motion
intrachain hops and infrequent interchain hops contribute to the overall diffusion
process.
Figure 14: Average lithium displacements associated with coordination change. The ∆n=0 displacement is associated with the vehicular motion of the polymer backbone. The increase in average displacements for ∆n>0 is associated with intrachain diffusion along a chain. Interchain hopping is associated with significantly increased diffusion.
In order to examine the nature of segmental motion of the polymer chain, the displacement
of individual oxygen atoms are analyzed. As polymer displacements can differ as a function
of chain position, the two extreme cases are considered – oxygen atoms located at the center
of the chain (n=50, 51) and oxygen atoms located at the edge of the chain (n=1, 100). The
results of this analysis are shown in table 1. Across all temperatures, it is shown that the
[image:54.612.174.480.128.380.2]