warwick.ac.uk/lib-publications
Manuscript version: Author’s Accepted Manuscript
The version presented in WRAP is the author’s accepted manuscript and may differ from the
published version or Version of Record.
Persistent WRAP URL:
http://wrap.warwick.ac.uk/111223
How to cite:
Please refer to published version for the most recent bibliographic citation information.
If a published version is known of, the repository item page linked to above, will contain
details on accessing it.
Copyright and reuse:
The Warwick Research Archive Portal (WRAP) makes this work by researchers of the
University of Warwick available open access under the following conditions.
Copyright © and all moral rights to the version of the paper presented here belong to the
individual author(s) and/or other copyright owners. To the extent reasonable and
practicable the material made available in WRAP has been checked for eligibility before
being made available.
Copies of full items can be used for personal research or study, educational, or not-for-profit
purposes without prior permission or charge. Provided that the authors, title and full
bibliographic details are credited, a hyperlink and/or URL is given for the original metadata
page and the content is not changed in any way.
Publisher’s statement:
Please refer to the repository item page, publisher’s statement section, for further
information.
Calibration of source-code similarity detection
tools for objective comparisons
M. Novak
*, D. Kermek
*and M. Joy
*** University of Zagreb/Faculty of Organization and Informatics, Varaždin, Croatia ** University of Warwick/Department of Computer Science, Coventry, United Kingdom
e-mail: [email protected]
Abstract - Today there are many source-code similarity detection tools. These tools are used for many purposes and one of them is plagiarism detection, in which context this paper is written. Every time a new tool is developed authors want to show that it is better than existing ones, and so they perform comparisons. Often these comparisons tend to be unfair towards the existing tools, for which there can be multiple reasons, such as the lack of calibration of existing tools. Almost all tools have configuration parameters, but often they are not calibrated before the comparison. The paper presents a way of calibrating the tools to keep the comparison more objective.
Keywords - source-code, plagiarsim, similarity detection, calibration
I. INTRODUCTION
Similarity detection is a process of finding similarities in a set of documents. These documents can be pure text, source-code, binary files, etc. There are different reasons for using similarity detection, and the process, techniques, and similarities differ depending on the contexts. But whatever the context, to speed up the detection similarity detection tools (short: tools) are built to analyse the files and generate a report.
For each context, multiple tools exist, which then lead to many comparisons. Researchers compare the tools to find out which exhibit improved performance focusing on a single property of the tool, such as speed of execution, allocation of memory, precision of task execution, or some combination of two of more of those properties, depending on the tools and the context.
For comparisons to be valid and useful they need to be objective and not biased. One factor that influences the comparisons is the configuration of the tools being compared. Similarity detection tools mostly have some kind of configuration parameters (short: parameters), which enable the user to modify the different aspects of the detection to get better results.
Sometimes the best configuration for a particular context is known, but often it is not. To have an objective comparison the tools need to be used with their best configuration, and this raises a question: “Is it possible to have an objective comparison of similarity detection tools when there is no knowledge of the best configuration for a tool involved?”
In this article a method is proposed that enables a more objective comparison when the best configuration is now
known for one or more tools involved. Although the tools are built for a specific purpose and all perform similarity detection, they may be quite different, and so only tools in the same context can be compared.
To demonstrate the method we need to set up the context in which similarity detection is used, and in this article we focus on source-code plagiarism detection in student programming assignments.
The rest of the article is structured as follows. Section 2 describes the related work. Section 3 and Section 4 describe the tool calibration method and the metric needed to do it. Section 5 demonstrates the use of the method on real examples with two tools, and Section 6 discusses the result of the example. Section 7 describes possible future work and Section 8 concludes.
II. RELATED WORK
Source-code plagiarism detection is not new. Already in 1981 Donaldson et al. [1] built a plagiarism detection system which could be used for programs written in FORTRAN, COBOL or Basic. Since then over 100 similarity detection tools have been built mainly for the purpose of plagiarism detection, examples of which include MOSS [2], JPlag [3], YAP3 [4], Sherlock [5], SIM [6].
Most of these tools were built for specific programming languages so when deciding which tool to use it is important to know if the chosen tool supports the target programming language. Also not all tools can be used offline, and not all tools are free. For help one can consult review articles like [7], [8] which compare the tools by their features and list such information for selected tools.
Every time a new tool is developed it is usually compared by the authors. Sometimes authors make feature comparisons [9] and sometimes they use experiments [10], but comparisons are also performed by others (like [11], [12]) not just the authors who have developed a tool.
When the configuration is not specified one can assume that the tool was then used with the default parameter configuration (if there is one), but cannot know for sure. Also, since the datasets and/or tools are not often available, it is impossible to repeat the experiment to identify the parameters.
The problems for not publishing the configuration parameters are obvious: authors could have manipulated them so that a tool appears better, the data used in different studies cannot be compared, and future users do not know how to set up the tool for best performance.
Sometimes it is also a problem if two tools have the same name. For example there is Sherlock from the University of Warwick [5] and Sherlock from the University of Sydney [16], or SIM from Grune [6] and SIM from Gitchell and Tran [17]. In such cases it may happen that a comparison is accidentally made to the wrong tool, or worse, authors cite one tool and use the other.
Another problem is that even if published research states the parameters, one could ask what the best configuration is. Ragkhitwetsagul et al. [11] tried to solve this by searching for the optimal configurations for 30 tools, among which are four plagiarism detection tools. The results of this research can now be used when comparing tool, but one then needs to be careful that the results depend on the datasets used during the comparisons. It could be that for a different dataset a different configuration would be better, and thus it is preferable to refer to an “optimal” configuration rather than a “best” configuration.
III. TOOL CALIBRATION METHOD
From [11] we now know the optimal parameters for some tools, but many tools are not covered in [11] and in some instances the parameters may not yield satisfactory results for the current dataset. How can two tools in such circumstances be compared objectively?
We propose calibrating the tools, for which there are two approaches. The first approach is to take a dataset for which the similarities between files are known, and to try various combinations of parameters and find the most suitable. With this approach one could – in principle – find the optimal parameter configurations.
The problem with this approach is that the similarities need to be known for each pair and this is not really possible unless it is an exact copy. One could ask experts to evaluate the source-code and quantify the similarity – this may be possible with programs with (say) ten lines but infeasible for programs with 100 or more lines, for which it would be unreasonable to expect to get an accurate number from an expert. Also, we would then need to establish how many experts would be needed, who
[image:3.595.318.528.102.162.2]the experts should be, and whether sufficiently many of them can be found. Also, this approach with experts is used when we just want to evaluate whether something is or is not a plagiarism [15], rather than quantifying precisely the degree of similarity for each pair.
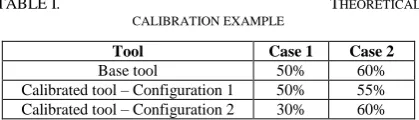
TABLE I. THEORETICAL
CALIBRATION EXAMPLE
Tool Case 1 Case 2
Base tool 50% 60%
Calibrated tool – Configuration 1 50% 55% Calibrated tool – Configuration 2 30% 60%
The second approach is a calibration method, performed using the tools themselves to calibrate each other. There is no need to know the similarities in advance, instead one tool (the base tool) is used to calculate the similarities, and other tool (the calibrated
tool) is used to get as close as possible on the same dataset (the calibration dataset – CD). The base tool should ideally be a tool for which the optimal parameter configuration is already known, and is similar to the jury concept [18].This approach has a potential problem, illustrated by the following example. Suppose there are two cases (ci) in the calibration dataset, where a case is a set of two files which are compared. Formula 1 defines CD as a set of n cases of pairs. Let say that similarity calculated using the base tool is 50% similarity for the first case and 60% similarity for the second case. A tool that needs to be calibrated is run and the results are the following. For the first case with 50% similarity, one configuration is optimal, but for the second case with 60% similarity a totally different configuration is optimal.
This problem we have solved by using a metric that we called Calibration Difference Sum (CDS).
IV. CALIBRATION DIFFERENCE SUM
Calibration Difference Sum (CDS) is a metric invented to solve the problem of the second approach. The idea is to sum up the differences for each case with each configuration and then see which parameter configuration comes closest for both cases. Formula 2 defines a difference of case (ci) as absolute difference of similarity for tool A with parameter a ( ) and similarity for tool B and with parameter b ( ), where “a” and “b” are sets of allowed parameter values in tools which have only one configuration parameter.
In Table I a theoretical calibration example is given (using the two cases introduced above). The two cases prefer different configurations but configuration 1 misses case 2 only for 5% while configuration 2 misses case 1 for 20%, and therefore configuration 1 is better.
tool B with parameter b as a sum of differenced for all cases.
The benefit of using CDS is that it can be used with two or more base tools. In the above scenario of two base tools, the CDS values for the first base tool are calculated, the CDS values for the second base tool are calculated, and then the CDS values for the same configuration are summed (we called that Total CDS). Finally, a configuration with the lowest Total CDS value is selected.
Another possibility is when there are multiple tools that need to be calibrated. In this scenario the suggestion is to calibrate the tools one by one, and then use each calibrated tool as a base tool to calibrate the next. For example, there are three tools where first is the base tool and others need to be calibrated. The second tool is calibrated with the first tool, and the third tool is calibrated with the first tool and the second tool.
All scenarios require a base tool, but what if there is no base tool, for example when the optimal parameters are not known for any of the tools involved? The answer is
mutual calibration. The idea this time is to set one tool as base tool, set one configuration (one parameter value), and then calibrate the other tool and calculate CDS (Formula 3).
The configuration (parameter value) of the base tool is then changed, and the other tool re-calibrated and a new CDS values calculated (Formula 3), and this process repeated that for as many configurations as necessary. To be able to terminate the process one should experiment with the parameters to find out what range of values give meaningful results. Often above some parameter value tool marks most cases in the dataset with equal values for similarity, for example everything is marked close to 100% similarity or 0% similarity.
The roles are then switched (the base tool becomes the calibrated tool, and vice versa) and the whole process repeated. Formula 4 defines CDS value for tool B with parameter b calibrating tool A with parameter a as a sum of differences for all cases.
Once all CDS values are known the minimum CDS in both iterations can be found. If the minimal CDS values are achieved with the same parameters we are getting the so called optimal CDS (CDSopt) as defined in Formula 5.
To better explain the last scenario and to demonstrate the calibration approach, in the next Section two tools will be calibrated this way: SIM (from Dick Grune) and JPlag. These tools were selected since both tools have been evaluated in [11] and give us the possibility to compare how different our results will be from the optimal parameter values reported in [11].
V. MUTUAL CALIBRATION OF SIM AND JPLAG
To demonstrate tool calibration, SIM and JPlag are used. The programming assignments used are all written in Java since both tools can work with the Java programming language. Both tools enable textual comparison and Java comparison. The main difference between the comparison approaches is that Java comparison uses tokens instead of the original text. Tokens are created so that instead of using a real value for some variable, the value is replaced by a name (such as “value”) or the real type (such as “int” or “float”) is just replaced by a name (such as “type”). In this way modifications like variable renaming have no influence on finding similarities.
Since Java comparisons are specific for programs written in Java it is natural to use the Java version, and this is assumed for the rest of this paper.
Both SIM and JPlag have one parameter to influence the comparison mechanism. SIM has the parameter
minimum run length (r) and JPlag has the parameter
minimum token match (t). In both cases the lower the value the more sensitive the tool is to similarities, which means it is more probable that a false similarity is reported.
In [11] it is reported that the optimal values for SIM are r=22 and for JPlag t=3, which differ from the default values for JPlag, which is t=9, and for SIM, which has default value r=24. This already confirms that default configuration is not always optimal. These values will serve us as guides and help us see how different the calibration will be from the reported values and from the default values.
A. Calibration dataset
The programming assignments we have used are written in Java, and the dataset contains a total of 18 cases. One case contains one pair of files which are compared to each other. Two kinds of cases are present, the first are manually created, and the second are cases created from the SOurce COde Reuse (SOCO) PAN track from the FIRE competition dataset. A detailed description of the SOCO dataset can be found in [15].
The eight manually created cases were made in three versions. The first two cases contain two files where the similarity should be 0%. They are different as much as possible, although similarities can occur in a programming language just because of the syntax. The next three manual cases contain two files which are direct copies, but different changes (so called obfuscation) are made on two out of three cases. The obfuscations are simple replacements and insertion of dummy lines with the idea to confuse the detectors. The two modified cases have different obfuscations. The last three cases are cases which have around 50% similarity. Again two out of each three statements have been modified with different obfuscations.
Of course, for none of the 18 cases we actually do not know the exact similarity, but for the manually created cases we at least know approximately what can be expected, for example for the 100% cases it is not expected to get a similarity of 10%.
B. Test of the optimal calibration
Before the actual experiment a simple test was performed with the optimal values for each tool reported in [11]. The idea was to find out how JPlag and SIM differ in similarities on individual cases.
For all manually created cases both tools gave quite similar results, the maximum difference being 11%. In SOCO cases they reported more different similarities. For example, in one case JPlag reported 50% and SIM reported 0% similarity, and an analysis has established that JPlag was wrong since the two source files are completely different. The full reason for the 50% similarity reported by JPlag is beyond the scope of this article, but a simple answer is that the t value is too small and therefore JPlag was too sensitive and reported parts as similar which are not semantically similar but because of the syntax they were found similar.
It is of no surprise that SIM performed better since in [11] it was ranked much higher than JPlag. In the next section we shall see if calibration will generate more similar results.
C. Calibration of SIM using JPlag
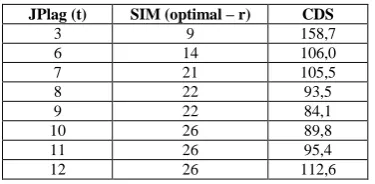
[image:5.595.80.268.653.745.2]As a first step of mutual calibration, SIM is calibrated using JPlag. In the simplest case one can use t=3 which we know is optimal [11] and find out which value of r will give the lowest CDS. The lowest CDS in this case was with r=9.
TABLE II. CALIBRATION RESULTS OF SIM(BASE TOOL JPLAG)
JPlag (t) SIM (optimal – r) CDS
3 9 158,7
6 14 106,0
7 21 105,5
8 22 93,5
9 22 84,1
10 26 89,8
11 26 95,4
12 26 112,6
TABLE III. CALIBRATION RESULTS OF JPLAG (BASE TOOL SIM)
SIM (r) JPlag (optimal – t) CDS
8 3 159,0
19 9 106,5
20 9 102,1
21 9 94,6
22 9 84,1
23 9 86,4
24 9 86,4
25 9 86,4
However, in order to find out whether a lesser CDS is possible, t was set to 1 and then the optimal parameter value for SIM was calculated. SIM’s parameter r was tested in the range [1-30], and for every r value the CDS metric was calculated. The r value which caused the lowest CDS is taken and it is presented in Table II. This is repeated for every t value in the range of [1-30]. In Table II all the optimal values of r (with the lowest CDS value) for different parameter values of t are presented and only the most interesting parameter values of t that were used to calibrate SIM are presented. It is evident from Table II that the lowest CDS was with t=9 and r=22.
D. Calibration of JPlag using SIM
We could stop with the calibration if JPlag would be our base tool. But in our case we do not want to use JPlag or SIM as the base tool so the next step is to calibrate JPlag using SIM.
The test was exactly the same as it was when SIM was calibrated. The only difference is that now for every value of SIM’s parameter r in the range of [1-30] the lowest CDS for JPlag’s t value was searched. The tested t values for every r value were again in the range of [1-30].
Table III presents the results. Again the most interesting r values used to calibrate JPlag with the lowest CDS are presented, and it is evident that the lowest CDS value is for t=9 and r=22.
VI. DISCUSSION OF THE RESULTS
From Table II and Table III one can see that the optimal results reported in [11] are equal for SIM but different for JPlag.
In this mutual calibration a “perfect” result has been achieved since calibrations in both directions have produced the same result. In such a case one can trust the results. The result of this calibration (that the parameter value r of SIM is 22) is the same as reported elsewhere, and this fact gives us extra confidence that the chosen configuration is as optimal as possible.
than JPlag. Another reasoning that one could chose is that JPlag is much more used than SIM so it would be acceptable to use JPlag as base tool. Also, there is maybe a possibility to use a third tool to arbitrate.
Even though calibration is not perfect, it is still more objective than simply using default values. From our demonstration, if one would use the default values for SIM (r=24) and JPlag (t=9), the result would not be as optimal as with r=22 and t=9 (although – at least for SIM and JPlag – the difference would not be substantial). However in the case presented in [11] the difference from the defaults would be much greater.
The execution time in the cases of SIM and JPlag, and with a dataset of 18 cases, was around 3 minutes. But the execution time depends on the tool used and on the dataset used. The impact of the dataset is twofold. First there is the number of cases in the dataset and the length of each file. In the 18 cases used in the experiment there were files that contained from 50 up to 750 lines of code.
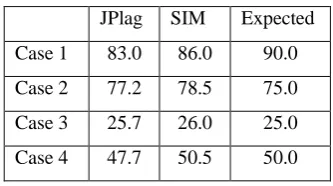
One could argue how the parameter values gotten from the calibration are valid to be used for real detection. We have done some simple validation (Table IV) on four cases which came from real student assignments where we knew what the approximate similarity was. The cases consist of files from 1200 up to 2500 lines of code.
It is impossible to know the exact similarity as a percentage since it depends on an expert (a teacher for example) to confirm it. In our case we performed a similarity check using a tool Sherlock [5] and a process described in [12] in 2016. The cases were analysed by teachers on the course. The first two cases were plagiarized and the students were accused of plagiarism and admitted doing it. The second two were cases which were not plagiarized.
[image:6.595.89.256.589.682.2]The last case is the most interesting one, since it has 50 percent similarity but it is not a plagiarized case. This happened because template code was used and a lot of code was generated by the NetBeans IDE for web services and Object Relational Mappings, ORM. Actually, in all four cases some similarity comes from using template code and using some generation functions of the NetBeans IDE but this was not relevant for calibration.
TABLE IV. VALIDATION OF CALIBRATED PARAMETERS
JPlag SIM Expected
Case 1 83.0 86.0 90.0
Case 2 77.2 78.5 75.0
Case 3 25.7 26.0 25.0
Case 4 47.7 50.5 50.0
From Table IV one can conclude that the similarities calculated using the calibrated parameters are good for SIM and JPlag. There are some differences, such as for case 1, but similarities gotten from both tools are very close to each other and also to the expected result.
However, it needs to be noted that both tools are known to be very good tools for plagiarism detection, so good results were expected. Suppose that a very bad tool were to be calibrated and which gives a combination of bad results. In such situation, the calibration would not improve the bad results, but the results would be more comparable than in a case where the calibration is not used. Also, if a bad tool is calibrated with a very good tool than the calibrated parameters for the bad tool would probably be the best parameters that one can get when comparing such a tool to the very good tool. The similarity calculated by the tools is then not relevant because the important thing is the equality for comparison.
At this point, it is useful to remind the reader that the intention of the calibration technique presented in this article is to put two or more tools in a more equal position for comparisons. It is not the intention of the calibration to find the best parameters for one tool, and it is possible that with different parameters some other tool would perform better.
VII. FUTURE WORK
One could spent a large amount of time calibrating tools and using a variety of datasets, and this would be valuable research helping us understand the detailed performance issues for the individual tools and the algorithms they use.
But the goal is often different, and calibrating (synchronizing) tools may be a precursor to performing an experiment, and be sufficient to ensure objectivity of the real experiment (insofar this is feasible).
Both SIM and JPlag had one parameter for configuration. Another problem arises when a tool has multiple configuration parameters (such as Sherlock, from the University of Warwick, which has 8 parameters). In such cases one needs to learn how the different parameters affect the results, and how to limit the number of combinations of the parameters. The limitation is needed to be able to finish the calibration in a practical amount of time. In future work we plan to experiment with Sherlock and other tools that have multiple configuration parameters.
VIII. CONCLUSION
The research question stated at the beginning was: “Is it possible to have an objective comparison of similarity detection tools when there is no knowledge of the best configuration for a tool involved?”
To be able to perform the tool calibration method, a metric is needed which enables comparison of parameter results on multiple calibration cases. For this reason we have created the metric called Calibration Difference Sum (CDS), which we seek to minimize.
It is possible that the parameter configuration differs for different datasets, and that in some cases there is no best parameter configuration. For that reason we justify our comment in the Introduction that we should refer to a calibration giving an optimal configuration rather than a best configuration.
In situations when there is knowledge of the optimal configurations for some similarity detection tool that was used in a published experiment, one should question if the parameter configuration is also optimal for some new experiment. In case of doubt, if the configuration for one tool can then be fixed, a calibration can then be performed and can yield insights into the problem. The calibration method gives an easy way of checking the applicably of parameters from existing research in new experiments.
The new calibration method described in this article is a new way of ensuring more objective comparisons by using a simple CDS metric. Besides the textual description, formulas are given as the formal presentation of the method.
REFERENCES
[1] J. L. Donaldson, A.-M. Lancaster, and P. H. Sposato, “A plagiarism detection system,” ACM SIGCSE Bull., vol. 13, no. 1, pp. 21–25, Feb. 1981.
[2] S. Schleimer, D. S. Wilkerson, and A. Aiken, “Winnowing: local algorithms for document fingerprinting,” in Proceedings of the 2003 ACM SIGMOD international conference on on
Management of data, 2003, pp. 76–85.
[3] L. Prechelt, G. Malpohl, and M. Philippsen, “Finding plagiarisms among a set of programs with JPlag,” J. Univers.
Comput. Sci., vol. 8, no. 11, pp. 1016–1038, 2002.
[4] M. J. Wise, “YAP3: improved detection of similarities in computer program and other texts,” in Proceedings of the twenty-seventh SIGCSE technical symposium on Computer
science education, 1996, vol. 28, no. 1, pp. 130–134.
[5] M. Joy and M. Luck, “Plagiarism in programming assignments,” IEEE Trans. Educ., vol. 42, no. 2, pp. 129–133, May 1999.
[6] D. Grune and M. Huntjens, “Het detecteren van kopieen bij informatica-practica,” Informatie, vol. 31, no. 11, pp. 864– 867, 1989.
[7] M. Novak, “Review of source-code plagiarism detection in academia,” in 39th International Convention on Information
and Communication Technology, Electronics and
Microelectronics, 2016, pp. 796–801.
[8] V. T. Martins, D. Fonte, P. R. Henriques, and D. Da Cruz, “Plagiarism detection: A tool survey and comparison,” in 3rd
Symposium on Languages, Applications and Technologies,
2014, vol. 38, pp. 143–158.
[9] S. Sharma, C. S. Sharma, and V. Tyagi, “Plagiarism detection
tool ‘Parikshak,’” in 2015 International Conference on Communication, Information & Computing Technology
(ICCICT), 2015, pp. 1–7.
[10] Z. Đurić and D. Gašević, “A Source Code Similarity System for Plagiarism Detection,” Comput. J., vol. 56, no. 1, pp. 70– 86, Jan. 2013.
[11] C. Ragkhitwetsagul, J. Krinke, and D. Clark, “Similarity of Source Code in the Presence of Pervasive Modifications,” in
2016 IEEE 16th International Working Conference on Source
Code Analysis and Manipulation (SCAM), 2016, pp. 117–126.
[12] D. Kermek and M. Novak, “Process Model Improvement for Source Code Plagiarism Detection in Student Programming Assignments,” Informatics Educ., vol. 15, no. 1, pp. 103–126, May 2016.
[13] D. Chuda and P. Navrat, “Support for checking plagiarism in e-learning,” Procedia - Soc. Behav. Sci., vol. 2, no. 2, pp. 3140–3144, 2010.
[14] C. Domin, H. Pohl, and M. Krause, “Improving Plagiarism Detection in Coding Assignments by Dynamic Removal of Common Ground,” in Proceedings of the 2016 CHI Conference Extended Abstracts on Human Factors in
Computing Systems, 2016, pp. 1173–1179.
[15] E. Flores, P. Rosso, L. Moreno, and E. Villatoro-Tello, “On the Detection of SOurce COde Re-use,” in Proceedings of the
Forum for Information Retrieval Evaluation, 2015, pp. 21–30.
[16] University of Sydney, “The Sherlock Plagiarism Detector.”
[Online]. Available:
http://sydney.edu.au/engineering/it/~scilect/sherlock/. [Accessed: 26-Jan-2016].
[17] D. Gitchell and N. Tran, “Sim: A utility for detecting similarity in computer programs,” in The proceedings of the thirtieth SIGCSE technical symposium on Computer science
education, 1999, vol. 31, no. 1, pp. 266–270.
[18] M. Mozgovoy, K. Fredriksson, D. White, M. Joy, and E. Sutinen, “Fast Plagiarism Detection System,” in Lecture
Notes in Computer Science, vol. 3772 LNCS, Berlin,