warwick.ac.uk/lib-publications
Original citation:
Putnick, Diane L., Bornstein, Marc H., Eryigit-Madzwamuse, Suna and Wolke, Dieter. (2016) Long-term stability of language performance in very preterm, moderate-late preterm, and term children. The Journal of Pediatrics . doi: 10.1016/j.jpeds.2016.09.006
Permanent WRAP URL:
http://wrap.warwick.ac.uk/82198
Copyright and reuse:
The Warwick Research Archive Portal (WRAP) makes this work by researchers of the University of Warwick available open access under the following conditions. Copyright © and all moral rights to the version of the paper presented here belong to the individual author(s) and/or other copyright owners. To the extent reasonable and practicable the material made available in WRAP has been checked for eligibility before being made available.
Copies of full items can be used for personal research or study, educational, or not-for-profit purposes without prior permission or charge. Provided that the authors, title and full bibliographic details are credited, a hyperlink and/or URL is given for the original metadata page and the content is not changed in any way.
Publisher’s statement:
© 2016, Elsevier. Licensed under the Creative Commons Attribution-NonCommercial-NoDerivatives 4.0 International http://creativecommons.org/licenses/by-nc-nd/4.0/
A note on versions:
The version presented here may differ from the published version or, version of record, if you wish to cite this item you are advised to consult the publisher’s version. Please see the ‘permanent WRAP url’ above for details on accessing the published version and note that access may require a subscription.
Long-Term Stability of Language Performance in Very Preterm, Moderate-Late Preterm, and Term Children
Diane L. Putnick1, PhD, Marc H. Bornstein1, PhD, Suna Eryigit-Madzwamuse2, PhD, Dieter Wolke3, PhD
Affiliations:
1Eunice Kennedy Shriver National Institute of Child Health and Human Development
2Centre for Health Research, University of Brighton
3Department of Psychology, and Division of Mental Health and Wellbeing, Warwick Medical
School, University of Warwick, Coventry, United Kingdom
Corresponding Author: Diane L Putnick, 6705 Rockledge Drive, Suite 8030, Bethesda, MD 20892, 301-496-6291, [email protected]
Financial Disclosure: The authors have no financial relationships relevant to this article to disclose.
Funding Source: DLP and MHB were supported by the intramural program of the NIH, NICHD. The study sponsor had no role in the study design, collection, analysis, and
interpretation of data, writing of the report, or decision to submit the manuscript for publication. Data acquisition was supported by grants PKE24, JUG14, 01EP9504 and
01ER0801 from the German Federal Ministry of Education and Science (BMBF) (DW, SEM).
Potential Conflicts of Interest: The authors have no conflicts of interest relevant to this article to disclose.
Abstract
Objective. Very preterm children are at risk for language delays. Individual differences in
language performance are stable from early development in healthy children born at term. This
study investigates whether children born very preterm, moderate-late preterm, and term differ in
their average level and individual-difference stability in language performance over time.
Study Design. Language in 204 very preterm (< 32 weeks gestation), 276 moderate-late preterm
(32-36 weeks gestation), and 268 term (37-41 weeks gestation) children from the Bavarian
Longitudinal Study was assessed at 5 and 20 months, and 4, 6, and 8 years of age.
Results. Very preterm children consistently performed worse than term-born children, and
moderate-late preterm children scored in between. Language performance was stable from 5
months through 8 years in all gestation groups combined, and stability increased between each
succeeding wave. Stability was stronger between 5 months and 4 years in very preterm than
moderate-late preterm and term groups, but this differential stability attenuated when covariates
(child nonverbal intelligence and family socioeconomic status) were controlled.
Conclusions. Preterm children, even moderate-late preterm, are at risk for poorer language
performance than term-born children. Because individual differences in language performance
are increasingly stable from 20 months to 8 years in all gestation groups, pediatricians who
attend to preterm children and observe language delays should refer them to language
Introduction
Preterm birth accounts for more than 15 million yearly births worldwide.1 Very preterm
children are at increased risk for delays and deficits in various aspects of language.2-5 As survival
rates following a preterm birth have risen due to improvements in obstetrics and neonatology,6
preterm birth has emerged as a risk factor for poor development in an increasing proportion of
the population.
According to the World Health Organization’s guidelines,7 preterm birth can be
subdivided into very preterm, births before 32 weeks gestation, moderate preterm, births at 32
and 33 weeks gestation, and late preterm, births between 34 and 36 weeks. Language skills are
impaired in children born very preterm.8 However, findings regarding mean differences in
language are less consistent for moderate-late preterm compared to term-born children.4,9-11 In
addition to mean differences, developmental stability of language (consistency in relative
standing over time)12 needs to be investigated because it is prognostic of future ability. There is
emerging evidence that individual differences in language are stable from toddlerhood in
term-born children,13-16 but it is unclear whether language is less or more stable across childhood in
very or moderate-late preterm children;17-19 i.e., whether stability differs in children born across
the full gestation spectrum. Because pediatricians are generally the first professionals to evaluate
language in young children, it is critical to understand how early in development individual
differences are predictive of later language performance (or deficits) in children born term and
preterm. Therefore, the current study aims to investigate the mean differences and stability of
language performance, using multiple age-appropriate measures, in children from 5 months to 8
years of age following a very preterm, moderate-late preterm, or healthy term birth within a
population based cohort.
Patients
Data were drawn from the prospective Bavarian Longitudinal Study (BLS).20 Participants
were children born alive in a geographically defined area of Southern Bavaria (Germany) over a
14-month period who required admission to children’s hospitals within the first 10 days after
birth (N=7,505; 10.6% of all live births). Healthy infants who were born in the same obstetric
hospitals (most born at term), cared for on normal postnatal wards, and discharged with their
mothers were recruited as controls (N=916). Ethical approval was granted by the Ethical Review
Board of the University of Munich Children’s Hospital and the Bavarian Health Council in
accordance with The Code of Ethics of the World Medical Association (Declaration of Helsinki).
Parents provided informed consent within 48 hours of their child’s birth.
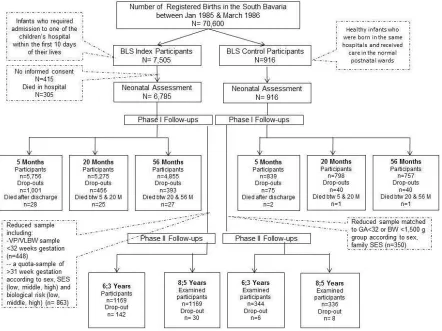
Figure 1 describes the BLS participant flow. The full sample was assessed at birth, 5
months, 20 months, and 4 years 8 months of age (hereafter called 4 years); the sample was then
reduced (N = 1543) prior to 6-year and 8-year assessments. All very preterm children were
included in the reduced sample. A random sample of children born at >31 weeks gestation was
drawn according to the following stratification variables: sex, family socioeconomic status (low,
moderate, high), and degree of neonatal risk (very low, low, moderate, high21).
For this study we removed 17 children who were not German speakers, 142 who were
born in multiples (twins or higher-order birth; excluded because they have unique reasons for
being preterm and have been found to have different language development than singletons22), 6
who had language data at only one or no assessments, and 78 with physical or developmental
disabilities or unknown status (i.e., blindness, deafness, or cerebral palsy levels 3-4 (unable to
move unaided)).23,24 As the focus of this report is to compare children who were born preterm
hospitalized at birth because they had early medical problems that might cloud the findings, and
12 children in the healthy control sample who were born preterm but cared for on normal
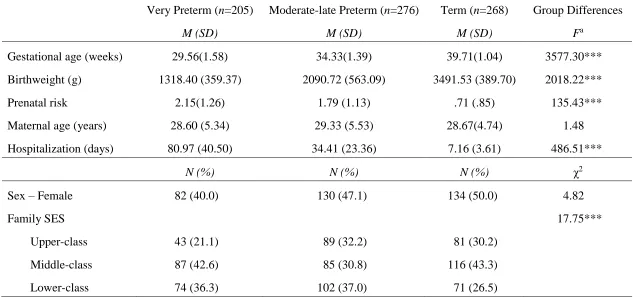
obstetric wards. Table 1 (online) gives the descriptives of the sample used (n=749) by gestation
group. We divided the sample into three groups based on gestational age: N=205 very preterm,
N=276 moderate-late preterm, and N=268 full-term.25
Procedures
Assessments at 5 and 20 months were carried out at term-corrected ages26 by
pediatricians, and at 4, 6, and 8 years at chronological ages by post-graduate clinical
psychologists.27 German versions of assessments were used.
Language assessments. At 5 and 20 months, the Griffiths Mental Development Scales28
hearing and speech subscale was used to evaluate children’s age-appropriate receptive and
expressive communication. Scores were standardized to M=100, SD=15.
At 4 years, the Active Vocabulary Test (AWST)29 and the Language Comprehension
Test (LSVT)30 were used. The AWST is a reliable and valid vocabulary assessment of expressive
language ability of children from ages 3 to 6 years.31 The LSVT was developed for children aged
4 to 8 years to assess language comprehension. Standardized scores with M=100 and SD=15
were used for both the AWST and the LSVT.32
At 6 years, four subscales of the Heidelberger Sprachenwicklungstest (HSET),33 were
administered to measure (1) grammatical rules (plural-singular rules), (2) language production
(sentence production), (3) grammatical structure (understanding of grammatical structures), and
(4) language comprehension (correction of semantically inconsistent sentences). T-scores were
used for each subtest with M=50 and SD=10.27 Next, experimenters observed the quality of
at the end of the day using consensus ratings based on the Diagnosis of Speech and Language
(DSL).27 Finally, pre-reading skills, including recognition of rhymes, sounds, and knowledge of
numbers and letters, were assessed using four pre-reading tasks adapted from the School
Maturity Assessment.27,34
At 8 years, experimenters administered the HSET,33 observed the DSL,27 and
administered the Zurich Reading Test35,36 to assess reading speed and number of reading errors
and a Pseudoword Reading Test37 to measure children’s word decoding skills by asking them to
read words which have no meaning.
Covariates. Family socioeconomic status (SES), computed as a weighted composite
score of parents’ education and occupation and grouped as low, middle, and high38, was used as
a general covariate. To control for child nonverbal intelligence, we standardized and averaged
multiple measures at each age. At 5 and 20 months, we used the eye-hand and performance
subscales of the Griffiths Mental Development Scales.28 At 4 years, we used the Beery
Visual-Motor Integration test39 and Columbia Mental Maturity Scale.40,41 At 6 and 8 years, we used the
Beery Visual-Motor Integration test39 and the nonverbal index of the Kaufman Assessment
Battery for Children.42,43 These covariates were used as controls for language performance at
each age, and residualized language scores were employed in a covariate controlled model.
Results
A full analytic plan, details about measurement models, and additional statistical details
appear in an online Appendix.
Full Sample Language Stability Model
We used latent variables to model the shared variance among language measures. This
from the latent factor, leaving a more precise and reliable estimate of language ability at each
age.44 Furthermore, using latent variables allows for developmentally appropriate changes in the
measurement of language as children age. Measurement models supported a single language
factor at 4 years and second-order factor models with first-order factors for each of the major
tests given at 6 and 8 years (see online Appendix for additional details). Using these factors,
stability of individual differences was modelled from 5- and 20-month language scales to 4-, 6-,
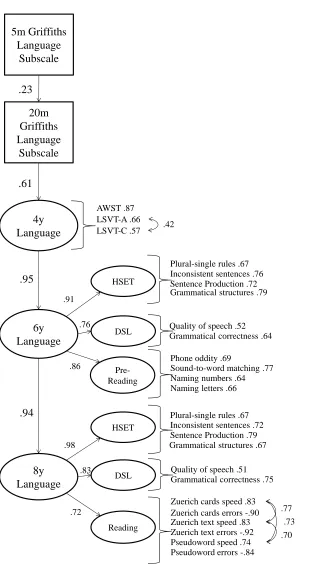
and 8-year language factors. The model of language stability from 5 months to 8 years (Figure 2)
had excellent fit. There was small-to-medium stability between 5 months and 20 months and
large stabilities between all later time points. The standardized indirect effect from 5-month to
8-year language performance was .13, p<.001, and the standardized indirect effect from 20-month
to 8-year language performance was .55, p<.001. From 5 months to 8 years, stability increased
significantly between each succeeding time point, Δχ2(1)=19.32-167.17, ps<.001,
ΔCFI=.002-.016.
Comparison of Stability Coefficients in the Three Gestational Groups
To determine whether stability coefficients were similar in the very preterm,
moderate-late preterm, and term-born groups, following establishment of partial metric and scalar
invariance (see online Appendix), two multiple group models were compared. The fit of the
model with constrained stability coefficients was significantly worse than the fit of the model
with no constraints, Δχ2(8)=41.53, p<.001, ΔCFI=.004, indicating that one or more stabilities
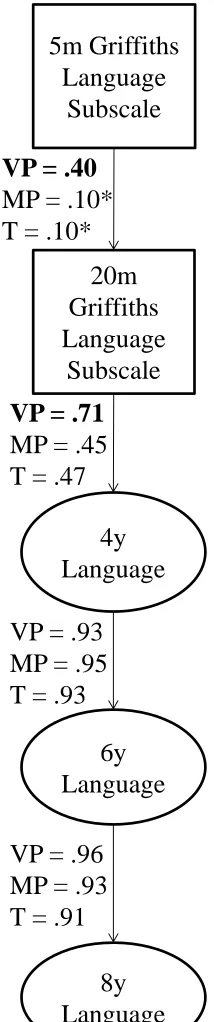
was different in one or more groups. Modification indices indicated that the language stabilities
between 5 and 20 months, and 20 months and 4 years were higher for the very preterm group
than the moderate-late preterm and term groups (Figure 3). With these two paths released for the
ΔCFI=.001. The standardized paths between 5- and 20-month and 20-month and 4-year language
performance were significant for all groups, but larger for the very preterm group than the
moderate-late preterm and term groups (Figure 3). Stability coefficients were similar across girls
and boys.
Tests of Mean Differences across Groups
The higher stability coefficient in the very preterm group at the early ages is a special
concern if language performance of very preterms is at a lower mean level than the other groups.
The combination of low mean level and high stability would indicate that very preterm children
are unlikely to improve their skills or “catch up” as they age. Saved factor scores from the
constrained scalar invariance model were used to test group differences in language performance
at the factor level across time. To have variables on a scale that could be compared across age,
we standardized (M=0, SD=1) each variable/factor within age, resulting in mean-deviated scores
for each age. Therefore, the main effect of child age should be near 0 and is ignored. However,
this method allowed us to test the interaction between child age and gestation group because the
effect of being preterm may not be uniform across child age.
A 5 Child age X 3 Gestation group repeated-measures analysis of variance revealed an
interaction between Child age and Gestation group, Greenhouse-Geisser F(3.83,
1387.24)=16.75, p<.001, η2p=.044, as well as a main effect of gestation group, F(2, 725)=66.96,
p<.001, η2p=.156. To understand the interaction, we explored gestation group differences on the
language measure or factor at each age. The three groups differed at all time points: 5 months,
Brown-Forsythe robust F(2,555.59)=4.79, p=.009, η2p=.014; 20 months, Brown-Forsythe robust
F(2,594.05)=36.70, p<.001, η2
p=.095; 4 years, Brown-Forsythe robust F(2,542.11)=69.53,
years, Brown-Forsythe robust F(2,549.11)=49.08, p<.001, η2p=.123. Tukey HSD post-hoc tests
indicated that at 5 months the very preterm group scored lower than the term group but the
moderate-late preterm group did not differ from either. At age 8, the very preterm group scored
lower than the moderate-late preterm and term groups, which did not differ from one another. At
20 months, 4 years, and 6 years, there were differences across the three gestation groups where
the very preterm group scored lowest and the term group scored highest. To be sure that the
standardization process did not bias these tests, we recomputed these analyses on the
unstandardized variables; all statistical decisions were the same.
Covariate Controlled Models
To test whether the stability found was explained by non-language factors, we repeated
the stability analysis controlling for child nonverbal intelligence and family SES. This covariate
controlled model fit the data adequately, χ2(334)=734.01, p<.001, CFI=.94, TLI=.93,
RMSEA=.040 (90%CI=.036-.044), SRMR=.049. However, the stability coefficients all
attenuated. Standardized stability from 5 to 20 months attenuated from .23 to .05
(nonsignificant), stability from 20 months to 4 years attenuated from .61 to .35, stability from 4
to 6 years attenuated from .95 to .77, and stability from 6 to 8 years attenuated from .96 to .74.
The standardized indirect effect from 5-month to 8-year language performance was no longer
significant at .01, and the standardized indirect effect from 20-month to 8-year language
performance attenuated from .55 to .20, p<.001.
When multiple group models by gestation group were refit using the covariate-controlled
model, the differential stability for the preterm group in the uncontrolled models (Figure 3) was
not significant: fit of the model with constrained stability coefficients across groups was not
ΔCFI=.000.
Discussion
At all 5 time points across early development, very preterm children had lower language
performance than term-born children. At 3 of the 5 ages, moderate-late preterm children also
scored lower than term-born children (and better than very preterm children).4,9-11 This study’s
novel contribution to the literature is its analysis of the stability of individual differences in the
language of preterm children. From very early in development, very preterm, moderate-late
preterm, and term children’s language abilities were stable.13-16 Although stability of individual
differences was observed from the age of 5 months in the full sample, stability between 5 and 20
months was largely carried by the very preterm children, for whom language performance was
more stable than moderate-late preterm and term children. However, once child nonverbal
intelligence and family socioeconomic status were controlled, differences in early stability for
the very preterm group compared to the moderate-late preterm and term groups attenuated. The
stronger stability in the very preterm group was more likely a result of general cognitive
difficulties and less likely specific to language performance. This conclusion is consistent with
the literature indicating high stability of general cognitive performance from infancy,45 and low
socioeconomic status at birth is a crucial risk factor for child development.46
In Bavaria in the 1980s, it was customary for children under 3 to be cared for at home,
and 90% of the sample was cared for by parents and/or other relatives in the home at age 2. Most
children (78%) in the 3- to 5-year age range attended kindergarten in mixed-age classrooms.
Children start school after their 6th birthday in Germany; thus, the tests administered at age 6
were shortly before school entry. However, some children (13%) deemed too immature for
start formal schooling until age 7.47 Children who were assessed as language delayed were
referred to speech therapy, and, if the language delay was severe and accompanied by other
cognitive deficits, children (7%) were matriculated into a special school to address their delays at
diagnosis. It is possible that these early interventions disrupted stability (e.g., improved speech
more than expected by development alone) in a small number of children in the sample. Still,
stability was large from under 2 to 8 years, and largest for the children with the poorest language
skills (i.e., very preterm children), suggesting that these interventions did not affect the overall
pattern of stability.
This study has several strengths, including its relatively large samples of 3 gestation
levels, prospective long-term longitudinal design, multiple observed language measures at 4, 6,
and 8 years, and availability of controls for child nonverbal intelligence and family
socioeconomic status. Language manifests differently at different ages. Using latent variables
allows for the measurement of language to vary (appropriately) across time (as the construct does
– children move from communicative gestures to speaking words to reading), but maintains
comparability of the construct across time. This study also has limitations. At 5 and 20 months,
only a single language measure was collected; more varied early language measures would
strengthen the study. Furthermore, the generalizability of these results is limited to preterm and
term children born under similar conditions (e.g., preterm children who required medical care
beyond traditional prenatal care, and term children who did not). Furthermore, these data were
collected beginning in the mid-1980s, and treatment of preterm children has changed. However,
there is evidence that improved care has also led to improved survival of premature infants, and
consequently more very preterm children are in the community, while the rate of cognitive
cohorts.49 Nevertheless, these longitudinal findings should be replicated in contemporary
cohorts.
Conclusions
This study’s findings have several implications for pediatricians, parents, and researchers.
First, very preterm children have the lowest language skills, followed by moderate-late preterm
and full term children, and these differences are consistent from 20 months to 8 years.
Pediatricians and parents should be made aware that preterm-born children, even those born
moderate-late preterm, are at risk for delayed language compared to term children. Second, by 20
months of age (preterm adjusted), children who are performing poorly relative to their peers are
likely to continue to perform poorly at later ages, suggesting that standard follow-up assessment
of language at the end of the second year of life is highly predictive and may indicate the need
for intervention. Third, stability in language performance appears to strengthen over time. From
age 4 to age 8, about 90% of the variance in children’s later language performance was explained
by their earlier language performance, suggesting that early intervention (well before school
entry) may be critical because language may be less changeable later. In fact, intervention before
preterm infants leave the hospital has been shown to improve language outcomes.50 Through
regular checkups in toddlerhood, pediatricians have the opportunity to connect children who
References
1. March of Dimes, PMNCH, Save the Children, WHO. Born Too Soon: The Global Action
Report on Preterm Birth. Geneva: World Health Organization; 2012.
2. Bhutta AT, Cleves MA, Casey PH, Cradock MM, Anand KJ. Cognitive and behavioral
outcomes of school-aged children who were born preterm: a meta-analysis. JAMA.
2002;288:728-37.
3. Jaekel J, Baumann N, Wolke D. Effects of gestational age at birth on cognitive performance:
A function of cognitive workload demands. PLoS ONE. 2013;8:e65219.
4. Quigley MA, Poulsen G, Boyle E, Wolke D, Field D, Alfirevic Z, et al. Early term and late
preterm birth are associated with poorer school performance at age 5 years: A cohort study.
Archives of Disease in Childhood-Fetal and Neonatal Edition. 2012;97:F167-73.
5. Wolke D, Strauss VY-C, Johnson S, Gilmore C, Marlow N, Jaekel J. Universal gestational
age effects on cognitive and basic mathematic processing: 2 Cohorts in 2 countries. The
Journal of Pediatrics. 2015;166:1410-6.
6. Saigal S, Doyle LW. An overview of mortality and sequelae of preterm birth from infancy to
adulthood. The Lancet. 2008;371:261-9.
7. Blencowe H, Cousens S, Oestergaard MZ, Chou D, Moller AB, Narwal R, et al. National,
regional, and worldwide estimates of preterm birth rates in the year 2010 with time trends
since 1990 for selected countries: a systematic analysis and implications. The Lancet.
2012;379:2162-72.
8. Barre N, Morgan A, Doyle LW, Anderson PJ. Language abilities in children who were very
preterm and/or very low birth weight: a meta-analysis. The Journal of Pediatrics.
9. Baron IS, Erickson K, Ahronovich MD, Coulehan K, Baker R, Litman FR. Visuospatial and
verbal fluency relative deficits in ‘complicated’ late-preterm preschool children. Early
Human Development. 2009;85:751-4.
10.Lipkind HS, Slopen ME, Pfeiffer MR, McVeigh KH. School-age outcomes of late preterm
infants in New York City. American Journal of Obstetrics and Gynecology.
2012;206:222.e1-6.
11.Nepomnyaschy L, Hegyi T, Ostfeld BM, Reichman NE. Developmental outcomes of
late-preterm infants at 2 and 4 years. Maternal and Child Health Journal. 2012;16:1612-24.
12.Bornstein MH, Bornstein L. Psychological stability. In Darity WA Jr., ed. International
Encyclopedia of Social Sciences. 2nd ed. Vol. 8. Detroit, MI: Macmillan Reference;
2008:74-5.
13.Bornstein MH, Hahn C-S, Haynes OM. Specific and general language performance across
early childhood: Stability and gender considerations. First Language. 2004;24:267-304.
14.Bornstein MH, Hahn C-S, Putnick DL. Stability of core language skill across the first decade
of life in children at biological and social risk. Journal of Child Psychology and Psychiatry.
Forthcoming 2016.
15.Bornstein MH, Hahn C-S, Putnick DL, Suwalsky JTD. Stability of core language skill from
early childhood to adolescence: A latent variable approach. Child Development.
2014;85:1346-56.
16.Bornstein MH, Putnick DL. Stability of language in childhood: A multiage, multidomain,
multimeasure, and multisource study. Developmental Psychology. 2012;48:477-91.
17.Ribeiro LA, Zachrisson HD, Schjolberg S, Aase H, Rohrer-Baumgartner N, Magnus P.
Cross-lagged relations from 18 to 36 months. BMC Pediatrics. 2011;11:59.
18.Sansavini A, Guarini A, Savini S, Broccoli S, Justice L, Alessandroni R, et al. Longitudinal
trajectories of gestural and linguistic abilities in very preterm infants in the second year of
life. Neuropsychologia. 2011;49:3677-88.
19.Stolt S, Haataja L, Lapinleimu H, Lehtonen L. The early lexical development and its
predictive value to language skills at 2 years in very-low-birth-weight children. Journal of
Communication Disorders. 2009;42:107-23.
20.Wolke D, Schmid G, Schreier A, Meyer R. Crying and feeding problems in infancy and
cognitive outcome in preschool children born at risk: A prospective population study.
Journal of Developmental and Behavioral Pediatrics. 2009;30:226-38.
21.Jaekel J, Baumann N, Wolke D. Effects of gestational age at birth on cognitive performance:
A function of cognitive workload demands. PLoS ONE. 2013;8:e65219
22.Thorpe K. Twin children's language development. Early Human Development.
2006;82:387-95.
23.Hagberg B, Hagberg G, Olow I. The changing panorama of cerebral palsy in Sweden. VI.
Prevalence and origin during the birth year period 1983-1986. Acta Paediatrica.
1993;82:387-93.
24.Wolke D, Chernova J, Eryigit-Madzwamuse S, Samara M, Zwierzynska K, Petrou S. Self
and parent perspectives on health-related quality of life of adolescents born very preterm.
Journal of Pediatrics. 2013;163:1020-6
25.Wolke D. Preterm and low birth weight babies. In Howlin P, Charman T, Ghaziuddin M, eds.
The SAGE handbook of developmental disorders. London, UK: Sage; 2011:497-527.
27.Wolke D, Meyer R. Cognitive status, language attainment and pre-reading skills of 6
year-old very preterm children and their peers: the Bavarian Longitudinal Study. Developmental
Medicine and Child Neurology. 1999;41:94-109.
28.Brandt I. Griffiths Entwicklungsskalen (GES zur Beurteilung der Entwicklung in den ersten
beiden Lebensjahren) [The Griffiths Baby Scales (Griffiths Scales for assessing development
in the first two years of life)]. Weinheim, Germany: Beltz; 1983.
29.Kiese C, Kozielski PM. Aktiver Wortschatztest fur drei- bissechsja hrige Kinder [Active
Vocabulary Test for 3–6 year olds. AWST 3-6.]. Weinheim, Germany: Beltz; 1979.
30.Wettstein P. LSVT: Logopädischer Sprachverständnis-Test [LSVT: Language
Comprehension Test]. Zurich, Switzerland: Heilpädagogisches Seminar; 1983.
31.Kiese-Himmel C. AWST-R: Aktiver Wortschatztest fur 3-5-jahrige Kinder [AWST-R: Active
Vocabulary Test for 3 5 year olds]. Gottingen, Germany: Hogrefe; 2005.
32.Gutbrod T, Wolke D, Söhne B, Ohrt B, Riegel K. The effects of gestation and birthweight on
the growth and development of very low birthweight small for gestational age infants: A
matched group comparison. Archives of Disease in Childhood Fetal and Neonatal Edition.
2000;82:F208-14.
33.Grimm H, Schöler H. Der Heidelberger Sprachentwicklungstest H-S-E-T (2. verbesserte
Auflage) [Heidelberger Language Development Test H-S-E-T]. 2nd ed. Göttingen, Germany:
Hogrefe; 1991.
34.Skowronek H, Marx H. Die Bielefelder langsschnittstudie zur fruherkennung von risiken der
lese-rechtschribschwache: Theoretischer hintergrund und erste befunde. [The Bielefeld
longitudinal study for early detection of risks associated with the reading delay: Theoretical
35.Linder M, Grissemann H. Zürcher Lesetest [Zurich Reading Test]. 4th ed. Bern, Switzerland:
Verlag Hans Huber; 1980.
36.Linder M, Grissemann H. Zürcher Lesetest [Zurich Reading Test]. 6th ed. Bern, Switzerland:
Verlag Hans Huber; 2000. http://testzentrale.de
37.Leon-Villagra J, Wolke D. Pseudoword reading test. Munich: Unpublished Manuscript;
1993.
38.Bauer A. Ein Verfahren zur Messung des für das Bildungsverhalten relevanten Status
(BRSS) [A method of measuring relevant for the formation of behavior status]. Frankfurt:
Deutsches Institut für Internationale Pädagogische Forschung; 1988.
39.Beery KE. Revised Administration, Scoring, and Teaching Manual for the Developmental
Test of Visual-Motor Integration. Toronto, Canada: Modern Curriculum Press; 1982.
40.Burgemeister BB, Blum LH, Lorge I. The Columbia Mental Maturity Scale (Manual). New
York: Yonkers-on-Hudson; 1954.
41.Eggert D. Die Columbia Mental Maturity Scale als individualtest für normalentwickelte
Kinder im alter von 3–10 jahren. [The Columbia Mental Maturity Scales as an individual test
for normally developing children aged 3–10 years.] In Eggert D, ed. Zur Diagnose der
Minderbegabung. Weinheim, Germany: Beltz; 1972.
42.Kaufman AS, Kaufman N. Kaufman Assessment Battery for Children. Circle Pines, MN:
American Guidance Service; 1983.
43.Melchers P, Preuss U. Kaufman battery for children: Deutschsprachige fassung. Frankfurt am
Main, Germany: Swets & Zeitlinger; 1991.
44.Kline RB. Principles and practice of structural equation modelling (4th ed.). New York:
45.Breeman LD, Jaekel J, Baumann N, Bartmann P, Wolke D. Preterm cognitive function into
adulthood. Pediatrics. 2015;136:415-23.
46.Eryigit Madzwamuse S, Baumann N, Jaekel J, Bartmann P, Wolke D. Neuro-cognitive
performance of very preterm or very low birth weight adults at 26 years. Journal of Child
Psychology and Psychiatry. 2015;56:857-64.
47.Jaekel J, Strauss VY, Johnson S, Gilmore C, Wolke D. Delayed school entry and academic
performance: A natural experiment. Developmental Medicine & Child Neurology.
2015;57:652-9
48.Moore T, Hennessy EM, Myles J, Johnson SJ, Draper ES, Costeloe KL, et al. Neurological
and developmental outcome in extremely preterm children born in England in 1995 and
2006: the EPICure studies. BMJ, 2012;345:e7961.
49.Wolke D, Strauss VY-C, Johnson S, Gilmore C, Marlow N, Jaekel J. Universal gestational
age effects on cognitive and basic mathematic processing: 2 cohorts in 2 countries. The
Journal of Pediatrics. 2015;166:1410-6.e2.
50.Caskey M, Stephens B, Tucker R, Vohr B. Adult talk in the NICU with preterm infants and
Figure 2. Model of language stability from age 5 months to 8 years in the full sample. 20m Griffiths Language Subscale 5m Griffiths Language Subscale .23 4y Language .61 .42 AWST .87 LSVT-C .57 LSVT-A .66 6y Language 8y Language .95 .94
Pre-Reading Naming numbers .64 Phone oddity .69
Sound-to-word matching .77
Naming letters .66
.70 .73 .77 Zuerich cards speed .83
Zuerich cards errors -.90 Zuerich text speed .83 Zuerich text errors -.92 Pseudoword speed .74 Pseudoword errors -.84 Reading
Quality of speech .51 Grammatical correctness .75 DSL
HSET
Plural-single rules .67
Sentence Production .79 Grammatical structures .67 Inconsistent sentences .72 HSET
Plural-single rules .67
Sentence Production .72 Grammatical structures .79 Inconsistent sentences .76
DSL Quality of speech .52 Grammatical correctness .64 .91 .76 .86 .98 .83 .72
Note. Standardized coefficients are presented. All coefficients were significant at p<.001.
loadings. Model fit: χ2(312)=747.88, p<.001, CFI=.96, TLI=.96, RMSEA=.043
(90%CI=.039-.047), SRMR=.043. AWST = Active Vocabulary Test. LSVT-A = Language Comprehension
Test - Part A. LVST-C = Language Comprehension Test – Part C. HSET = Heidelberger
Figure 3. Model of language stability from age 5 months to 8 years by gestation group.
20m Griffiths Language
Subscale 5m Griffiths
Language Subscale
4y Language
6y Language
8y Language VP = .40
MP = .10* T = .10*
VP = .71 MP = .45 T = .47
VP = .93 MP = .95 T = .93
VP = .96 MP = .93 T = .91
Note. VP=very preterm. MP=moderate-late preterm. T=term. Bolded coefficients were
significantly different from other gestation groups. All coefficients were significant at p<.001
Appendix
Method
Analytic Plan
Prior to analysis, all variables were examined for outliers and deviations from univariate
normality.1 Standard transformations were applied as needed for variables to approximate a
normal distribution.
Previous studies of language development in preterm children have explored individual
aspects or measures of language. However, evidence from term children suggests that different
aspects of language (e.g., vocabulary comprehension, production, grammar, reading) form single
latent variables that assess core language ability from early in development. Consequently, when
multiple language measures were available, we explored measurement models to determine
whether the different language measures at 4, 6, and 8 years formed a single latent variables
(factor) that indicated language performance at that age. If model fit of a single-factor model was
not supported, alternative structures (method factors, correlated residual terms) were explored as
guided by theory and modification indices. Stability of child language across age was examined
via structural equation modelling as implemented in Mplus version 7.2.2 In all models, full
information maximum likelihood (FIML)3 within Mplus was used to account for missing data
(6.92% of the data points were missing). A model was considered to have good fit if the 2 test
was nonsignificant (p > .05), the Comparative Fit Index (CFI) and Tucker-Lewis Index (TLI) >
.95,4,5 the Root Mean Sqaure Error of Approximation (RMSEA) < .06, and the Standardized
Root Mean Square Residual (SRMR) < .08,4 but we gave greater weight to the incremental fit
indices than to the significance of the 2 because the χ2 value is known to be sensitive to sample
to 1 and are presented in text and figures. Standardized path coefficients were interpreted with
respect to Cohen’s8 estimates of small (.10), medium (.30), and large (.50) effects. Following a
test of the stability of language performance in the full sample, we established at least partial
metric and scalar invariance (i.e., constraining the loadings of observed variables on factors and
first-order factors on second-order factors, and constraining intercepts of observed and latent
first-order factors across groups)9,10 to make sure the factors had the same meaning in the very
preterm moderate-late preterm and term groups. Then we computed two additional
multiple-group models, constraining the structural paths to be equal across the three gestation multiple-groups in
the first model and releasing these paths in the second model to determine whether the stability
model fit equally well for very preterm, moderate-late preterm, and term children. Following
Cheung and Rensvold6, if the differences in 2 values for the two nested models were
nonsignificant, and the change in CFI < .01, we could be reasonably certain that the structural
paths were similar for the three gestation groups. If the change in model fit indicated poor fit,
structural paths were incrementally released to determine which group(s) had differential
stability across age.
Because stability has different implications for low- and high-performing children (e.g.,
high stability is good if the child performs well, but bad if the child performs poorly), we saved
latent variable scores from the main model of language stability and tested mean differences
across gestation groups by child age. We also computed a covariate controlled language stability
model and multiple group models that accounted for nonverbal intelligence at each age and
family SES. Observed language variables at each age were computed removing the variance
associated with nonverbal intelligence (i.e., residual scores), and the model was refit using these
stability coefficients were compared to the uncontrolled models.
Results
Measurement Models
At 4 years, the 3 variables from the Active Vocabulary Test and Language
Comprehension Test loaded on a single factor of 4-year language performance. A measurement
model indicated that there was additional variance shared by the two Language Comprehension
Test indicators (method variance) that was not accounted for by the latent variable.
Consequently, a covariance was added between the residual terms for these two indicators. At 6
and 8 years, the best fitting and most parsimonious measurement models were second-order
factor models with first-order factors for each of the major tests given, and a single second-order
factor for total language performance. (We also tested models with only a single factor for 6- and
8-year language performance and models with the three first-order factors with covariances
among them. The higher-order models were a better fit to the data.) At 8 years, the three reading
speed variables from the Zuerich Reading Test shared additional variance (method variance, or
processing speed variance) that was not accounted for by the reading factor. Hence, covariances
were added between the residual terms for these three indicators.
Metric and Scalar Invariance across Gestation Groups
To ensure measurement equivalence of the language latent variables across groups, we
tested metric invariance of the first- and second-order factor loadings and scalar invariance of the
observed and first-order intercepts. A baseline configural invariance model with no constraints
fit the data, χ2(936)=1401.31, p<.001, CFI=.95, TLI=.95, RMSEA=.045 (90%CI=.040-.049),
SRMR=.058. Full metric invariance of the observed variable loadings was not supported,
speed on the reading factor in the term group and 8-year Zuerich cards errors on the reading
factor in very preterm group), the model fit was acceptable, Δχ2(34)=40.95, p = .192,
ΔCFI=.000. Full metric invariance of the second-order factor loadings was not supported,
Δχ2(8)=51.92, p<.001, ΔCFI=.002, but once 3 loadings were released (the loadings on the 6-year
and 8-year DSL on the 6- and 8-year language factors for the term group, and the loading of the
6-year HSET on the 6-year language factor for the very preterm group), the model fit was
acceptable, Δχ2(5)=10.46, p = .063, ΔCFI=.001. Full scalar invariance of the observed variables
was not supported, Δχ2(36)=118.23, p<.001, ΔCFI=.008, but once 5 intercepts were released
(6-year plural-single rules and 8-(6-year Zuerich cards errors in the very preterm group, and 4-(6-year
LSVT-C, 6-year inconsistent sentences, and 8-year Zuerich text speed in the term group), the
model fit was acceptable, Δχ2(31)=42.76, p = .078, ΔCFI=.001. Finally, full scalar invariance of
the first-order factors was not supported, Δχ2(8)=74.61, p<.001, ΔCFI=.007, but once 3
intercepts were released (6-year and 8-year DSL in the term group and 6-year HSET for the very
preterm group), model fit was acceptable, Δχ2(5)=6.32, p = .276, ΔCFI=.000. These findings
suggest that partial metric and scalar invariance were supported across the 3 gestation groups and
References
51.Tabachnick BG, Fidell LS. Using multivariate statistics. 6th ed. Boston: Allyn & Bacon;
2013.
52.Muthén LK, Muthén BO. Mplus® statistical analysis with latent variables: User’s guide. 5th
ed. Los Angeles, CA: Muthén & Muthén; 2009.
53.Arbuckle JL. Full information estimation in the presence of incomplete data. In Marcoulides
GA, Schumacker RE. eds. Advanced structural equation modeling: Issues and techniques.
Mahwah, NJ: Erlbaum; 1996: 243-77.
54.Hu LT, Bentler PM. Cut-off criteria for fit indexes in covariance structure analysis:
Conventional criteria versus new alternatives. Structural Equation Modeling. 1999;6:1-55.
55.Marsh HW, Balla JR, Hau K-T. An evaluation of incremental fit indices: A clarification of
mathematical and empirical properties. In Marcoulides GA, Schumacker RE. eds. Advanced
structural equation modeling: Issues and techniques. Mahwah, NJ: Erlbaum; 1996: 315-53.
56.Cheung GW, Rensvold RB. Evaluating goodness-of-fit indexes for testing measurement
invariance. Structural Equation Modeling. 2002;9:233-55.
57.Miles J, Shevlin M. A time and a place for incremental fit indices. Personality and Individual
Differences. 2007;42:869-74.
58.Cohen J. Statistical power analysis for the behavioral sciences. 2nd ed. Mahwah, NJ:
Erlbaum;1988.
59.Vandenberg RJ, Lance CE. A review and synthesis of the measurement invariance literature:
Suggestions, practices, and recommendations for organizational research. Organizational
Research Methods. 2000;3:4-70.
the art and future directions for psychological research. Developmental Review. Forthcoming
2016.
61.Byrne BM, Shavelson RJ, Muthén B. Testing for the equivalence of factor covariance and
mean structures: The issue of partial measurement invariance. Psychological Bulletin.
Table 1. Sample descriptives
Very Preterm (n=205) Moderate-late Preterm (n=276) Term (n=268) Group Differences
M (SD) M (SD) M (SD) Fa
Gestational age (weeks) 29.56(1.58) 34.33(1.39) 39.71(1.04) 3577.30***
Birthweight (g) 1318.40 (359.37) 2090.72 (563.09) 3491.53 (389.70) 2018.22***
Prenatal risk 2.15(1.26) 1.79 (1.13) .71 (.85) 135.43***
Maternal age (years) 28.60 (5.34) 29.33 (5.53) 28.67(4.74) 1.48
Hospitalization (days) 80.97 (40.50) 34.41 (23.36) 7.16 (3.61) 486.51***
N (%) N (%) N (%) χ2
Sex – Female 82 (40.0) 130 (47.1) 134 (50.0) 4.82
Family SES 17.75***
Upper-class 43 (21.1) 89 (32.2) 81 (30.2)
Middle-class 87 (42.6) 85 (30.8) 116 (43.3)
Lower-class 74 (36.3) 102 (37.0) 71 (26.5)
Note. Prenatal risk represents the total number of pregnancy complications, such as preeclampsia, bleeding, pathological CTG, and is
expected to be higher in the very preterm samples compared to children who were born later in gestation. For variables with
significant F tests, all group means significantly differed in Games-Howell post-hoc tests that correct for inequality of variance across
groups. Very preterm children were born between 25 and 31 weeks gestation, moderate-late preterm children were born between 32
and 36 weeks gestation, and term children were worn between 37 and 41 week gestation.