Visualising Linguistic Evolution in Academic Discourse
Verena Lyding
European Academy of Bolzano-Bozen
Ekaterina Lapshinova-Koltunski
Saarland University
Stefania Degaetano-Ortlieb
Saarland University
Henrik Dittmann
European Academy of Bolzano-Bozen
Christopher Culy
The University of T¨ubingen
Abstract
The present paper describes procedures to visualise diachronic language changes in academic discourse to support analysis. These changes are reflected in the distri-bution of different lexico-grammatical fea-tures according to register. Findings about register differences are relevant for both lin-guistic applications (e.g., discourse analysis and translation studies) and NLP tasks (no-tably automatic text classification).
1 Introduction
The present paper describes procedures to visu-alise diachronic language changes in academic discourse with the aim to facilitate analysis and interpretation of complex data. Diachronic changes are reflected by linguistic features of reg-isters under analysis. Regreg-isters are patterns of lan-guage according to use in context, cf. (Halliday and Hasan, 1989).
To analyse register change, we extract lexico-grammatical features from a diachronic corpus of academic English, and visualise our extraction re-sults withStructured Parallel Coordinates(SPC), a tool for the visualisation of structured multidi-mensional data, cf. (Culyet al., 2011).
Our approach is based on the inspection and comparison of how different features change over time and registers. The major aim is to deter-mine and describe tendencies of features, which might become rarer, more frequent or cluster in new ways. The amount and complexity of the in-terrelated data, which is obtained for nine disci-plines in two time periods (see section 2) makes the analysis more difficult.
Structured Parallel Coordinates provide a tool for the compact visual presentation of complex data. The visualisation of statistical values for different linguistic features laid out over time and register supports data analysis as tendencies be-come apparent. Furthermore, interactive features allow for taking different views on the data and focussing on interesting aspects.
2 Data to Analyse
2.1 Features and theoretical background
When defining lexico-grammatical features, we refer to Systemic Functional Linguistics (SFL) and register theory, e.g., (Quirk, 1985), (Halliday and Hasan, 1989) and (Biber, 1995), which are concerned with linguistic variation according to contexts of use, typically distinguishing the three contextual variables of field, tenor and mode of discourse. Particular settings of these variables are associated with the co-occurrences of certain lexico-grammatical features, creating distinctive registers (e.g., the language of linguistics in aca-demic discourse). We also consider investiga-tions of recent language change, observed, e.g., by (Mair, 2006), who analyses changes in prefer-ences of lexico-grammatical selection in English in the 1960s vs. the 1990s.
As a case study, we show an analysis of modal verbs (falling into the contextual variable of tenor), which we group according to (Biber, 1999) into three categories of meaning that rep-resent three features: obligation, permissionand volition(see Table 1).
2.2 Resources
The selected features are extracted from SciTex, cf. (Degaetano et al., 2012) and (Teich and
categories of meanings (feature) realisation obligation/necessity (obligaton) can, could, may, etc.
permission/possibility/ability (permission) must, should, etc.
volition/prediction (volition) will, would, shall, etc.
Table 1: Categories of modal meanings for feature extraction
Fankhauser, 2010), an English corpus which con-tains full English scientific journal articles from nine disciplines (see Figure 1). The corpus covers two time periods: the 1970/early 1980s (SaSci-Tex) and the early 2000s (DaSci(SaSci-Tex), and in-cludes ca. 34 million tokens. Our focus is espe-cially on the subcorpora representing contact reg-isters, i.e. registers emerged out of register con-tact, in our case with computer science: computa-tional linguistics (B1), bioinformatics (B2), digi-tal construction (B3), and microelectronics (B4).
COMPUTER SCIENCE (A) LINGUISTICS (C1) CO MP
[image:2.595.92.271.316.485.2]UTA TIO NA L LIN GU IST ICS (B1) BIOLOGY (C2) B IO -IN FO RM AT IC S (B 2) ELECTRICAL ENGINEERING (C4) M IC RO -EL EC TR ON IC S (B 4) MECHANICAL ENGINEERING (C3) DIG ITA L CO NST RU CT ION (B3)
Figure 1: Scientific disciplines in the SciTex corpus
SciTex is annotated1 with information on to-ken, lemma, part-of-speech and sentence ary, as well as further information on text bound-ary, register information, etc., and can be queried in form of regular expressions by the Corpus Query Processor (CQP), cf. (Evert, 2005).
2.3 Feature Extraction and Analysis
To extract the above described features for the two time slices (1970/80s and 2000s) and for all nine registers of SciTex, we elaborate queries, which include both lexical (based on token and lemma information) and grammatical (based on part-of-speech or sentence boundary information) con-straints.
1
Annotations were obtained by means of a dedicated pro-cessing pipeline (Kermes, 2011).
Annotations on the register information allow us to sort the extracted material according to spe-cific subcorpora. This enables the analysis of fea-tures possibly involved in creating distinctive reg-isters. Comparing differences and/or common-alities in the distribution of features for A-B-C triples of subcorpora (e.g., A-computer science, B1-computational linguistics, C1-linguistics, cf. Figure 1), we analyse whether the contact disci-plines (B-subcorpora) are more similar to com-puter science (A-subcorpus), the discipline of ori-gin (C-subcorpus) or distinct from both (A and C). The two time periods in SciTex (70/80s vs. 2000s) enable a diachronic analysis. A more fine-grained diachronic analysis is also possible with the infor-mation on the publication year annotated in the corpus.
3 Analysing language changes with SPC
3.1 SPC visualisation
Structured Parallel Coordinates(Culyet al., 2011) are a specialisation of the Parallel Coordinates visualisation (cf. (d’Ocagne, 1885), (Inselberg, 1985), (Inselberg, 2009)) for representing mul-tidimensional data using a two-dimensional dis-play. Parallel Coordinates place data on vertical axes, with the axes lined up horizontally. Each axis represents a separate data dimension and can hold either categorical or numerical data. Data points on different axes are related which is indi-cated by colored lines connecting all data items belonging to one record.
Targeted to the application to language data, SPC additionally provide for ordered characteris-tics of data within and across data dimensions. In then-grams with frequencies/KWIC2 implemen-tations of SPC, ordered axes represent the linear ordering of words in text.
In our analysis of language change based on linguistic features, we are interested in two di-rections of changes across data sets that can be represented by ordering: changes over time and
changes across registers, e.g., from linguistics and computer science to computational linguistics.
3.2 Adjustments to SPC
For the analysis of linguistic features with SPC, we start off with then-grams with frequencies im-plementation. In analyzing just two time dimen-sions the ordered aspect of SPC is not as crucial and a similar analysis could have been done with Parallel Coordinates. However, the setup of n-grams with frequenciesconveniently provides us with the combination of categorical and numerical data dimensions in one display but separated visu-ally. For our diachronic register analysis, we cre-ate asubcorpus comparisonapplication where the feature under analysis as well as some of the cor-pus data are placed on the unordered categorical axes, and frequencies for the two time periods are placed on ordered axes with numerical scales. As shown in Figure 2 below, unordered dimensions are followed by ordered dimensions, the inverse situation to n-grams with frequencies. To visu-ally support the categorical nature of data on the first three axes, SPC was adjusted to display the connecting lines in discrete colors instead of the default color scale shading from red to blue. To improve the comparability of values on numerical axes, a function for switching between compara-ble and individual scales was added that applies to all axes right of the separating red line. Figure 2 and 3 present numerical values as percentages on comparable scales scaled to 100.
3.3 Interactive features for analysis
SPC provide a number of interactive features that support data analysis. To highlight and accentuate selected parts of the data, an axis can be put into focus and parts of axes can be selected. Lines are colored according to the axis under focus, and fil-ters apply to the selected portions of axes, with the other data rendered in gray. Users can switch be-tween discrete colors and scaled coloring of con-necting lines. The scales of numerical axes can be adjusted interactively, as described above. Hover-ing over a determined connectHover-ing line brHover-ings it out as a slightly wider line and gives a written sum-mary of the values of that record.
4 Interpreting Visualisation Results
Visualised structures provided by SPC supply us with information on development tendencies, and
thus, deliver valuable material for further interpre-tation of language variation across registers and time.
To analyse the frequencies of modal meanings (see Table 1) for A-B-C triples of subcorpora, we use thesubcorpus comparisonoption of SPC. The interactive functionality of SPC allows us to focus on different aspects and provides us with dynam-ically updated versions of the visualisation.
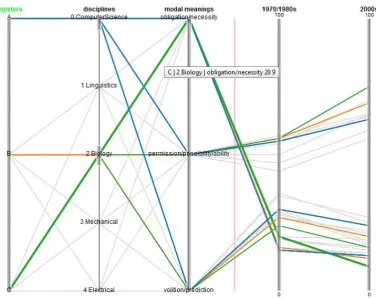
First, by setting focus on the axis of modal meanings, the visualisation in Figure 2 shows di-achronic changes of the modal meanings from the 1970/80s to the early 2000s. In both time periods thepermission(blue) meaning is most prominent and has considerably increased over time. The volition(green) andobligation(orange) meanings are less prominent and we can observe a decrease ofvolition and a very slight decrease of obliga-tion.
Second, by setting the axis of the registers into focus and selecting the disciplines one by one, we can explore whether there are changes in the use of modal meanings between the A register, the contact registers (B), and the respective C regis-ters. In Figure 3, for example, computer science and biology have been selected (gray shaded) on the ’disciplines’ axis. For this selection, the struc-tures starting from the ’registers’ axis represent (1) computer science (blue) being the A regis-ter, (2) biology (green) from the C registers, and (3) bioinformatics (orange) from the B registers as the corresponding contact register. In terms of register changes, Figure 3 shows that bioin-formatics differs in the development tendencies (a) ofpermissionfrom biology and computer sci-ence (less increase than the former, more increase than the latter) and (b) ofobligationfrom biology (decrease for biology, whereas nearly stable for bioinformatics and computer science).
5 Conclusion and Future Work
The results described above show thatStructured Parallel Coordinatesprovides us with a means for the interactive inspection of complex data sets fa-cilitating our diachronic register analysis. The vi-sualisation allows to gain an overview and detect tendencies by accomodating a complex set of data in one display (nine registers over two time peri-ods for three meanings).
fo-Figure 2: Modal meanings in SciTex in the 1970/80s and 2000s
[image:4.595.110.487.415.714.2]cus, and thus to successively zoom into specific subsets of the data for detailed analyses. In this way, we can determine general tendencies (e.g., increase ofpermissionover time) or provide de-tailed analyses for certain linguistic features and registers by selecting subparts of the data and by highlighting different data dimensions (e.g., com-paring changes between different registers).
Future work comprises to use the data obtained from the corpus to feed several different SPC vi-sualisations. For example, the data presented in Figure 2 can also be layed out to place values for registers instead of values for time periods on the numerical axes.
Future analyses will focus on inspecting fur-ther tendencies in the feature development for the three contextual variables mentioned in 2.1, e.g., verb valency patterns for fieldor conjunctive re-lations expressing cohesion for mode. We also aim at analysing several linguistic features at the same time to possibly detect feature sets involved in register variation of contact registers. Addition-ally, a more fine-grained diachronic analysis ac-cording to the publication years, which are anno-tated in the corpus, might also prove to be useful. From a technical point of view, the issue with fully overlapping lines being displayed in one color only will be tackled by experimenting with semi-transparent or stacked lines. Furthermore, SPC should in the future be expanded by a func-tion for restructuring the underlying data to cre-ate different layouts. This could also include the merging of axes with categorical values (e.g., axes registersanddisciplinesin Figure 2 above). Fur-thermore on each data dimension a ’summary’ category could be introduced that would repre-sent the sum of all individual values, and would provide an extra point of reference for the analy-sis. For interactive data analysis, support could be provided to select data items based on crossings or declination of their connecting lines.
References
Douglas Biber. 1995. Dimensions of Register
Varia-tion. A Cross-linguistic Comparison. Cambridge:
Cambridge University Press.
Douglas Biber. 1999. Longman Grammar of Spoken
and Written English. Harlow: Pearson ESL.
Chris Culy, Verena Lyding, and Henrik Dittmann. 2011. Structured Parallel Coordinates: a visualiza-tion for analyzing structured language data. In
Pro-ceedings of the 3rd International Conference on Corpus Linguistics, CILC-11, April 6-9, 2011, Va-lencia, Spain, 485–493.
Stefania Degaetano-Ortlieb, Hannah Kermes, Ekate-rina Lapshinova-Koltunski and Elke Teich. 2012. SciTex – A Diachronic Corpus for Analyzing the Development of Scientific Registers. In: Paul Ben-nett, Martin Durrell, Silke Scheible & Richard J. Whitt (eds.), New Methods in Historical Corpus Linguistics. CLIP, Vol. 2, Narr: T¨ubingen.
Stefan Evert. 2005. The CQP Query Language Tuto-rial. IMS, Universit¨at Stuttgart.
M.A.K. Halliday and Ruqaiya Hasan. 1989. Language, context and text: Aspects of language in a social semiotic perspective. OUP.
Alfred Inselberg. 2009.Parallel Coordinates: VISUAL
Multidimensional Geometry and its Applications.
New York: Springer.
Alfred Inselberg. 1985. The plane with parallel coor-dinates.The Visual Computer1(2), pp. 69–91. Hannah Kermes. 2011. Automatic corpus creation.
Manual. Institute of Applied Linguistics, Transla-tion and Interpreting, Universit¨at des Saarlandes, Saarbr¨ucken.
Christian Mair. 2006.Twentieth-Century English:
His-tory, Variation and Standardization. Cambridge:
Cambridge University Press.
Maurice d’Ocagne. 1885.Coordonn´ees Parall`eles et Axiales: M´ethode de transformation g´eom´etrique et proc´ed´e nouveau de calcul graphique d´eduits de la consid´eration des coordonn´ees parall`elles. Paris: Gauthier-Villars.
Randolph Quirk, Sidney Greenbaum, Geoffrey Leech and Jan Svartvik. 1985.A comprehensive grammar
of the English language. Harlow: Longman
Elke Teich and Peter Fankhauser. 2010. Exploring a corpus of scientific texts using data mining. In: Gries S., S. Wulff and M. Davies (eds), Corpus-linguistic applications - Current studies, new
direc-tions. Rodopi, Amsterdam and New York, pp. 233–