Traceability: Availability and Efficiency among Food
Industries in Ghana
Patricia Foriwaa Ababio, Doreen Dedo Adi, Vida Commey
Technology Department, University of Education Winneba, Kumasi, Winneba. Email: [email protected]
Received November 21st, 2012; revised December 27th, 2012; accepted January 4th, 2013
ABSTRACT
Food traceability systems availability and efficiency was investigated using 74 food businesses along the food chain in Ghana. Questionnaire with closed and open ended questions were given to purposefully sampled staff in key positions in the food businesses to answer on qualification of technical personnel, availability of documentation procedure and how these businesses were controlling traceability systems. Most food businesses were using Higher National Diploma graduates in the technical/supervisory positions. Documentation was poor and although there was awareness on trace- ability across the food businesses, implementation and maintenance was not effective. Only 23.8% manufactur- ing/processing units, 20% hospitals, 16.7% hotels and 14.8% schools could complete traceability test within 4 hours. It was recommended that more short training programmes on quality and safety be designed for workers in the food in- dustry by appropriate institutions while science students from the Senior High Schools are encouraged to enroll on food science and food manufacturing technology programs to improve on the current situation.
Keywords: Food; Traceability; Legislation; Quality Assurance
1. Introduction
Food accessibility worldwide has improved over the de- cade but with increased complexity. The chain that food passes through include agricultural production and har- vesting, holding and storing of raw materials, food ma- nufacturing, transportation and distribution, retailing, food service and food preparation in various homes [1]. Quality assurance and safety control systems are neces-sary throughout the chain [2,3] and food manufactures and processors including those in the service industry are required by law to have the necessary information from their supplier that indicates compliance [4] and safety status of the raw materials being supplied and after pro- duction produce distributed are equally to be recorded so as to be able to follow the product a “step up” [5,6].
Traceability is a system implemented as part of man- agement plan in ensuring a food operation has the capa- bility to trace product externally and internally as appli- cable [7]. It is a system designed to keep record on prod- ucts or product attributes through the supply chain [2]. Establishing traceability system by food and feed opera- tors is to meet legislative requirements in most countries including European Union, United states and Japan and also existing Quality Management systems like BRC, ISO 22000, HACCP, GMP, SQF, FSSC 22000, IFIS, Global GAP [2,8]. This goes to prove that operators can
identity and trace their raw materials received, have the ability to identity and trace what, when and how the raw material was handled, identify and trace where the fin- ished product was sent and have the available and effi- cient document and record on this.
Traceability is a legislative requirement internationally and it shows that there are measures in place to streng- then consumer protection against both safety and quality errors including allergen contamination and genetically modified food products. There is advancement in tech- nologies internationally to automatically detect devia- tions and non conformances for effective alerting meth- ods towards preventing the risk of recalls and losses re- lated with customer complaints, identified internal non conformances and regulatory problems along the food chain. Thus reducing the unlimited food destroyed during food borne disease outbreaks, allowing uncontaminated food to be marketed and also the manual entries and re- cords used by many [2,9].
customers (manufacturers and processers, retailers and other food services) can ascertain the quality and safety of their raw materials and can also ensure effective recall to avoid identified food hazards from causing harm after products have been dispatched. The Ghana Govern- ment’s Trade Policy for January 2006-December 2010 included the need to develop measures with clear and sufficient rules on consumer protection of which food safety systems with traceability could not be left out. A preliminary study by Ababio and Adi showed that most food handlers depended on the open market for sourcing of their raw materials for food preparation [11]. Raw material purchasing was essentially based on visual ac- ceptability and cost. Food processing companies are re- ported to be overlooking self inspection, documentation and record keeping [12]. There is also currently limited publication on traceability management availability and its effectiveness along the food chain. Sefa-Dede, re- ported during Go-Global conference in Accra of the lack of traceability in the food supply chain [13,14]. The re- searchers set out to evaluate traceability availability and effectiveness along the food chain in Ghana.
2. Methodology
One hundred and fifty (150) questionnaires with closed and open ended questions were designed for the manu- facturing and service industries in 3 cities in the Country. From Figure 1, areas selected were Accra of the Greater
Accra Region, Kumasi in Ashanti Region and Ho in Volta Region. Questions were put into three categories Section A for information about the set ups including kind of set up, ownership, number of years in operation among others. Section B consisted of management com- mitment requirements in terms of available quality man- agement systems and qualification of persons responsible. Section C was on management commitment to auditing and traceability and how it is maintained.
[image:2.595.121.222.565.717.2]The sampling plan used was purposive as only the
Figure 1. Map of Ghana showing regions [15].
food setups alone could furnish the researcher with the relevant information needed and snow balled as most food managers were not willing to give out information and the researcher in some cases had to use people who knew each other in the industry as a means of connecting to various set ups. Some manufacturers requested for formal introductory letter from the researcher’s univer- sity which was received and given to personnel on re- quest. This took about three months to retrieve as most respondents preferred completing the questionnaire at their own pace. Out of the 150 questionnaires dispatched 49% was available for use as some were not returned, others were not willing to participate and some were with errors which the researcher could readily identity and hence were discarded. Data analysis was by the use of Statistical Package for Social Sciences version 16 to re- port on distribution of respondents, the existing correla- tion between variables and Chi square to find the signifi- cance of their association at 95% confidence level.
3. Results and Discussion
3.1. Demographic Information on Food Businesses
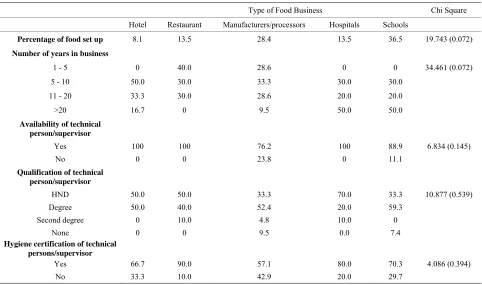
From Table 1 schools represented the highest sampled
unit in the research constituting 36.5% of the whole sam-ple size followed by manufacturers/food processors, res-taurants and hospitals had equivalent presentation with hotels being the least presented. Whiles half of schools and hospitals represented had been in operation for over 20 years, restaurants and manufacturing/processing com- panies were quite young with 40% of restaurant still within their first 5 years in operation and none from 20 years and above. Manufacturing/processing companies had over 90% representation of younger units below the age of 20 whiles 50% of hotels had been in operation for 5 to 10 years.
Table 1. Type of food business, years in operation and key food safety personnel qualification.
Type of Food Business Chi Square Hotel Restaurant Manufacturers/processors Hospitals Schools
Percentage of food set up 8.1 13.5 28.4 13.5 36.5 19.743 (0.072)
Number of years in business
1 - 5 0 40.0 28.6 0 0 34.461 (0.072)
5 - 10 50.0 30.0 33.3 30.0 30.0
11 - 20 33.3 30.0 28.6 20.0 20.0
>20 16.7 0 9.5 50.0 50.0
Availability of technical person/supervisor
Yes 100 100 76.2 100 88.9 6.834 (0.145)
No 0 0 23.8 0 11.1
Qualification of technical person/supervisor
HND 50.0 50.0 33.3 70.0 33.3 10.877 (0.539)
Degree 50.0 40.0 52.4 20.0 59.3
Second degree 0 10.0 4.8 10.0 0
None 0 0 9.5 0.0 7.4
Hygiene certification of technical persons/supervisor
Yes 66.7 90.0 57.1 80.0 70.3 4.086 (0.394)
No 33.3 10.0 42.9 20.0 29.7
cant across the various businesses although graduates with Higher National Diplomas were mostly employed for such positions across the sectors. First degree holders were mostly in the schools and manufacturing/processing companies as technical staff/supervisors. Hygiene quail- fication which is a regulatory requirement for persons in technical or supervisory roles, was predominant in the restaurants [5,15]. This could be due to frequent visits and surveillance by the food inspectors from the various agencies across the country to small scale businesses. Eighty percent (80%) of the hospitals sampled had hy- giene trained staff in charge of food handling supervision. Food Manufacturers and processors had the highest num- ber of supervisors without hygiene certificates confirm- ing reported low standards by a member of the Food and Drugs Board [12]. As mentioned earlier most of these could be individuals or “one man” businesses (small scale businesses) who operates in less obvious environments obscured from the inspectorate focus.
3.2. Management Commitment towards Documentation, Auditing and Traceability
One of the management responsibilities towards con- sumer safety and legislative requirement compliance is the setting up of monitoring and auditing procedures and systems to verify ongoing processes to ascertain food safety and quality maintenance. All accredited certifica- tion bodies with food quality management systems re-
quire the commitment of management to verify and vali- date processes [8]. From Table 2 there is no significant
difference in the availability or maintenance of docu-mentation across the businesses.
Documents serve as sources of information that man- agement can fall on during auditing and training, they also serve as due diligence during legal disputes and customer complaints. Hotels had the highest percentage (66.7%) on record keeping businesses followed by hos- pitals (60.0%) and then food manufacturers with 47.6%. Schools and restaurants had the highest values on record keeping non compliance. Lack of commitment in this area is reflected in the question on routine auditing in place. Restaurants have the highest figure (60.7%) for no routine auditing followed by manufacturing and process- ing businesses then schools. Although 33.3% of hotels had no written document there was auditing in place and this was done mostly once in a year. This is likely to be a one year visit by inspecting agencies to these facilities. Restaurants had the highest percentage (40%) on busi- nesses that never did any auditing. The auditing frequen- cy across the businesses was not significant.
Table 2. Auditing commitment.
Type of Business Chi Square
Availability of
documentation Hotel Restaurant Manufacturing/Processing Hospital School
Yes 66.7 30.0 47.6 60.0 33.3 4.444 (0.349)
No 33.3 70.0 52.4 40.0 66.7
Routine auditing in place
Yes 83.3 40.0 52.4 90.0 59.3 7.323 (0.120)
No 16.7 60.7 47.6 10.0 40.7
Auditing frequency
Once a year 50.0 30.0 14.3 20.0 29.6 16.469 (0.521)
Twice a year 33.3 10.0 9.5 40.0 11.1
Three times a year 16.7 10.0 19.0 20.0 18.5
Other 0 10.0 23.8 10.0 7.4
None 0 40.0 33.3 10.0 33.3
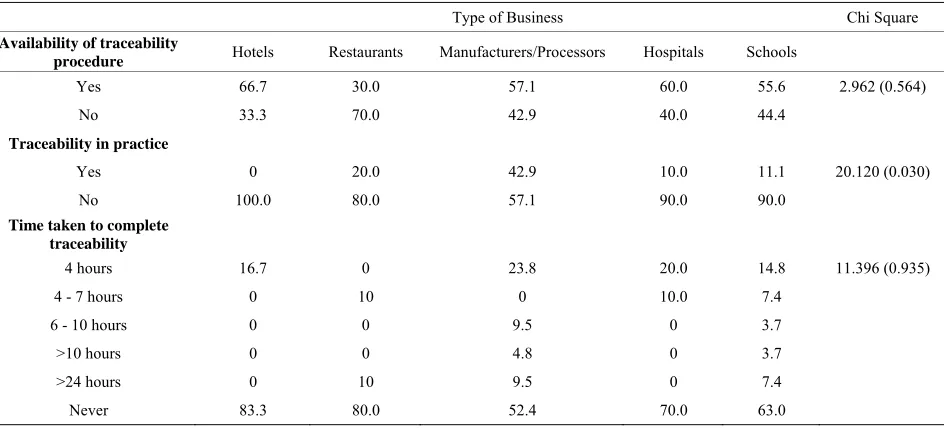
Table 3. Traceability availability and efficiency.
Type of Business Chi Square
Availability of traceability
procedure Hotels Restaurants Manufacturers/Processors Hospitals Schools
Yes 66.7 30.0 57.1 60.0 55.6 2.962 (0.564)
No 33.3 70.0 42.9 40.0 44.4
Traceability in practice
Yes 0 20.0 42.9 10.0 11.1 20.120 (0.030)
No 100.0 80.0 57.1 90.0 90.0
Time taken to complete traceability
4 hours 16.7 0 23.8 20.0 14.8 11.396 (0.935)
4 - 7 hours 0 10 0 10.0 7.4
6 - 10 hours 0 0 9.5 0 3.7
>10 hours 0 0 4.8 0 3.7
>24 hours 0 10 9.5 0 7.4
Never 83.3 80.0 52.4 70.0 63.0
procedures across the businesses were not significantly different although restaurants were the businesses with the least percentage of documented traceability proce- dure hence routine traceability checks or trails were also not in place. A hundred percent of the sampled hotels had no routine traceability checks and so were the hospitals and schools with 90% each on no traceability checks. Manufacturing and processing industries however had lowest figure on unavailability of routine traceability checks. The availability of routine traceability checks across the businesses was significant (p ≤ 0.05). Manu- facturers/processors were more committed in maintaining traceability and thus quality assurance. This shows lim- ited availability or less knowledge and awareness of traceability systems in the food industry leading to the possible difficulty to trace products as production and
food handling in the country is still less controlled along the food chain [12,16]. Demonstrating compliance with food safety requirements of the global economy is a pre- requisite for success [4], but this was not affirmed as most of the businesses could not complete traceability test within the stipulated 4 hours. Only 23.8% of the manufacturers/processors, 20.05% of hospitals, 16.7% of hotels and 14.8% of schools could complete their trace- ability within this time. Thus there was no significant difference within the time the businesses took to com- plete traceability tests.
4. Conclusion
[image:4.595.66.538.324.538.2]tion and maintenance is limited to a few businesses across the industry. Personnel in the industry in charge of food safety and hygiene systems are mostly Higher Na- tional Diploma holders who have limited food technol- ogy backgrounds to be able to take absolute responsibil- ity for implementing and maintaining the needed legisla- tive and standard quality systems required. It is recom- mended that more short courses for training personnel in the food industry be designed for workers by the appro- priate institutions with the needed legislative backing while more students from the Senior Secondary Schools are encouraged to take food science and food manufac- turing and technology related programmes to help im- prove on the current situation.
REFERENCES
[1] T. G. Karippachevil, D. L. Rios and L. Srivastava, “Glo- bal Markets, Global Challenges, Improving Food Safety and Traceability while Empowering Smallholders through ICT,” 2012. www.ictinoagriculture.org
[2] E. Golan, B. Krissoff, F. Kuchler, L. Calvin, K. Nelson and G. Price, “Traceability in the US Food Supply Chain,” Agriculture Economic Report, 2004, 56 p.
www.ers.usda.gov
[3] Z. Gyori, I. Mitlasovszky, B. Kerekes, J. Solyom and Z. S. Nemeth, In: C. Andrea, “Opportunities of Integrating Sup-ply Chain Quality Management and Product Development with Formulation Systems in Compound Feed Manufac-ture,” Quality Assurance and Safety of Crops and Food, Vol. 3, 2011, pp. 82-88.
[4] L. D. Mensah, “Developing of Food Safety Capability in Ghana to Enhance Access to the Global Food Manufac-turing Value Chain,” Ph.D. Thesis, Cranfield University, Northampton, 2012. http://dspace.lib.cranfield.ac.uk [5] “Codex Alimentarius Commission, Food Hygiene,” 4th
Edition, WHO/FAO, Rome, 2009.
[6] C. Andrea, “Opportunities of Integrating Supply Chain Quality Management and Product Development with Formulation Systems in Compound Feed Manufacture,” Quality Assurance and Safety of Crops and Food, Vol. 3, No. 2, 2011, pp. 82-88.
[7] C. Knight, “Traceability in the Food and Feed Chain- System Requirement for System Design and Implementa-tion,” Campden BRI, Glaucestershire, 2012.
www.campden.co.uk
[8] S. Sansawat and V. Muliyil, “Comparing Global Food Safety Initiative Recognized Standards,” 2012.
[9] L. Barbara, “What Is Food Safety Chain Management,” Position Paper, Safetychainsoftware, Inc., 2012.
www.foodsafetychain.com/resources
[10] P. N. T. Johnson, K. I. Tomlins, C. Oduro-Yeboah, C. Tortoe and E. T. Quayson, “A Case Study to Develop an Appropriate Quality Assurance System for Two Cassava- Based Convenience Foods in Ghana,” Internet Journal of Food Safety, Vol. 10, 2008, pp. 81-84.
[11] P. F. Ababio and D. D. Adi, “Food Safety Practices among Food Handlers in the Kumasi Metropolis of Ghana,” Internet Journal of Food Safety, Vol. 14, 2012, pp. 35-43.
[12] Ghana New Agency, “Food Processing Companies over Look Self Inspection-FDB,” 2012.
www.ghanaweb.com
[13] S. Sefa-Dedeh, “Ghana-Overview of Food Safety Situa-tion in Africa-Country PosiSitua-tion,” Go-Global Conference, Accra, 27 April 2009, pp. 1-58.
www.goglobalnetwork.eu
[14] Food Standard Agency, “Food Hygiene a Guide for Busi-nesses,” Food Standard Agency, England, 2005.
[15] Ghanaweb, “Ghana Regions,” 2012.
http://www.ghanaweb.com/GhanaHomePage/geography/r egion.php
![Figure 1. Map of Ghana showing regions [15].](https://thumb-us.123doks.com/thumbv2/123dok_us/1581582.704434/2.595.121.222.565.717/figure-map-ghana-showing-regions.webp)