*
Loc Vuminh 1,, Dung Vuhoang2
1
Giadinh University, Vungtau City, Vietnam.
2
National University Of Singapore, Singapore.
Abstract
During the recent years, many different methods of using fuzzy time series for forecasting have been published. However, computation in the linguistic environment one term has two parallel semantics, one represented by fuzzy sets (computation-semantics) it human-imposed and the rest (context-semantic) is due to the context of the problem. If the latter semantics is not paid attention, despite the computation accomplished high level of exactly but it has been distorted about semantics. That means the result does not suitable the context of the problem. After all, the results are not accurate A new approach is proposed through a semantic-based algorithm, focus on two key steps: partitioning the universe of discourse of time series into a collection of intervals and mining fuzzy relationships from fuzzy time series, that outperforms accuracy and friendliness in computing.
The experimental results, forecasting enrollments at the University of Alabama and forecasting TAIEX Index, demonstrate that the proposed method significantly outperforms the published ones about accurate level, the ease and friendliness on computing.
Keywords: Forecasting; Fuzzy time series; Hedge algebras; Enrollments, Intervals;AITEX Index; fuzziness intervals; semantically quantifying mapping.
Received on 22 April 2018, accepted on 04 June 2018, published on 18 June 2018
Copyright © 2018Loc Vuminh and Dung Vuhoang, licensed to EAI. This is an open access article distributed under the terms of the Creative Commons Attribution licence (http://creativecommons.org/licenses/by/3.0/), which permits unlimited use, distribution and reproduction in any medium so long as the original work is properly cited.
doi: 10.4108/eai.18-6-2018.154820
1.Introduction
Fuzzy time series was originally proposed by Song and Chissom [1] and it has been applied to forecast the enrollments at University of Alabama [2, 3]. In 1996, Chen [4] opened a new study direction of using fuzzy time series to forecast time seriesourse we have, the better forecasting values we get discourse such as [5] which is the first research confirmed the important role of partitioning the universe of discourse, this employed distribution and average based length as a way to solve the problem. In turn, Jilani et al. [6] proposed frequency density, Huarng and Yu [7] suggested the ratios and Bas et al. [8] used modified genetic algorithm as basis to improve quality of interval.
*
Corresponding author. Email: [email protected].
Thus, recent researches focus on the second method. There have been many methods of partitioning the. [12] presented a method of partitioning the universe of universe of Information granules were applied in [9, 10, 11] to get good intervals on the universe of discourse. By the hedge algebras approach Ho et al discourse. According to this approach, fuzziness intervals are used to quantify the values of fuzzy time series that are linguistic terms. These fuzziness intervals are employed as intervals on the universe of discourse. The rest of this paper is organized as follows: Section 2 briefly introduces some basis concepts of HA; Section 3 presents the proposed method; Section 4 presents empirical results on forecasting enrollments at University of Alabama, Forecasting AITEX Index and comment; Section 5 concludes the paper.
2.Preliminaries
In this section, we briefly recall some concepts associated with fuzzy time series and hedge algebras. 2.1. Fuzzy time series
Fuzzy time series was first introduced by Song and Chissom [1], it is considered as the set of linguistic values that is observed by the time. Linguistic values are also called linguistic terms. It can be seen that conventional time series are quantitative view about a random variable because they are the collection of real numbers. In contrast to this, as the collection of linguistic terms, fuzzy time series are qualitative view about a random variable. There are two types of fuzzy time series, time-invariant and time-variant fuzzy time series. Because of practicality, the former is the main subject which many of researchers focus on. In most of literature, the linguistic terms are quantified by fuzzy sets. Formally, fuzzy time series are defined as following definition
Definition 1. Let Y (t) (t = ...,0,1,2,...), a subset of R1, be the universe of discourse on which fi(t) (i = 1,2,...)
are defined and F(t) is the collection of fi(t) (i =
1,2,...). Then F(t) is called fuzzy time series on Y (t) (t = ...,0,1,2,...).
Song and Chissom employed fuzzy relational equations as model of fuzzy time series. Specifically, we have following definition:
Definition 2. If for any fj(t) ∈F(t), there exists an fi(
t-1) ∈ F(t-1) such that there exists a fuzzy relation Rij(t,t-1) and fj(t) = fi(t-1)∘Rij(t,t-1) where “∘” is the
max-min composition, then F(t) is said to be caused by F(t-1) only. Denote this as
fi(t-1) → fj(t) or equivalently F(t-1) → F(t). In [2, 3],
Song and Chissom proposed the method which use fuzzy time series to forecast time series. Based upon their works, there are many studies focus on this field. 2.2. Some basis concepts of Hedge Algebras
“ In the HAapproach, it seems to be essential that the fuzziness measure of words of a variable, which is a quantitative characteristic expressing an essential and key semantic aspect of the fuzzy linguistic
information, does play a centric role in the determination of other quantitative characteristics of words, such as the fuzziness intervals of words, the similarity intervals and the semantically quantifying mappings (or the numeric
semantics of) words, when providing the values the fuzziness parameters of the variable. In summary, this approach is developed based on a convincing logical and mathematical foundation, as the inherent word semantics and its fuzziness are defined and formalized in an axiomatization manner” [14]
In this section, we briefly introduce some basis concepts in HA, these concepts are employed as basis to build our proposed method. HA are created by Ho Cat Nguyen et al. in 1990. This theory is a new approach to quantify the linguistic terms differing from the fuzzy set approach. The HA denoted by AX = (X,G,C,H,≤ ), where, G = {c+,c−} is the set of primary generators, in which c+ and c− are, respectively, the negative primary term and the positive one of a linguistic variable X, C = {0,1,w} a set of constants, which are distinguished with elements in X,H is the set of hedges, “≤” is a semantically ordering relation on X. For each x ∈X in HA, H(x) is the set of hedge u ∈ X that generated from x by applying the hedges of H and denoted u = hn,...,h1 x, with hn,...,h1 ∈H. H = H+ ∪H−, in which H−
is the set of all negative hedges and H+ is the set of all positive ones of X. The positive hedges increase semantic tendency and vise versa with negative hedges. Without loss of generality, it can be assumed that
H− = {h−1 < h−2 < ··· < h−q} and H+ = {h1 < h2< ··· < hp}.
If X and H are linearly ordered sets,
then AX = (X,G,C,H,≤ ) is called linear hedge algebra, furthermore, if AX is equipped with additional operations Σ and Φ that are, respectively, the infimum and supremum of H(x), then it is called complete linear hedge algebra (ClinHA) and denoted AX = (X,G,C,H,Σ,Φ,≤).
Complete linear hedge algebra(ClinHA) There are also following important concepts and properties are present in [12]:
-Fuzziness interval of terms in X and its properties. -Semantically quantifying mapping : X [0,1] of AX and its identification.
-Function Sign: X {1, 0, 1} is a mapping which is defined recursively.
It is user’s Linguistic Frame of Cognitive and is
basis of calculations on the word makes the
calculation method are simple and accurate
Here we just add two properties related to (Clin.HA) which have two factors (one negative and one positive), ie
Definition 1. [12] GivenAX2,(k1), the similar fuzzy space of set X(k)denoted
(k) is a set of similar fuzzyspace of all grades from X(k) for xX(k), g(x)
k
x
l
g
k
(),
(
)
unchanged ( ie xX(k), g(x) made up of the same fuzzy space of level k*) and
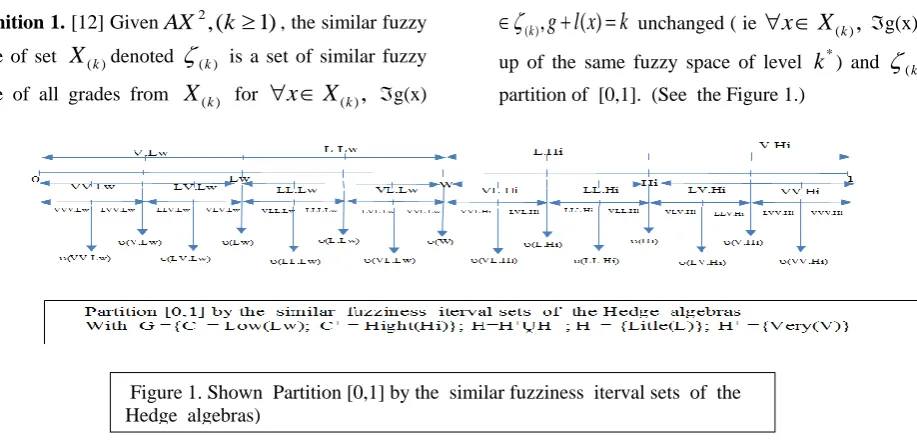
(k) is a partition of [0,1]. (See the Figure 1.)Definition 2.
[12] Give
AX
2,
k
1
,
x
X
(k)identify the similar fuzzy space
g(x)
(k)definition
of
the
compatibility
level
)( 2 l x k
g
of quantitative value
for
Grade
x
to be a mapping
s
g:
[
0
,
1
]
X
[
0
,
1
]
determined based on the distance from
to
) (x
and two similar fuzzy space close to
g(x) as follows:
,0
) ( ) (
) ( , ) ( ) (
) ( min
max ) , (
x z
v x y x
x v x
v sg
Where y,z are two grades defining two similar fuzzy space neighbors left and right of g(x).(See the Figure 2.)
3.Proposed method
3.1. Calculations on the language value apply
to
the forecast
In Figure 2 we have triangular fuzzy sets:
Here the set of 3linguistic values for example the very
little low-denominated (VL.Lw) are the vertices of the triangle
0U:=(0, 0, ( )); 1U:= ( ( ),1,1)
U1:= (0, ( ), ( ))
U2:= ( ( ), ( ), ( ));
U3:= ( ( ), ( ), ( ));
U4:= ( ( ), ( ), ( ));
U5:= ( ( ), ( ), ( ));
U6:= ( ( ), ( ), ( ));
U7
:= ( ( ), ( ), );
(1.2.2) Figure 1. Shown Partition [0,1] by the similar fuzziness iterval sets of the
Hedge algebras)
Figure 2. Shown
identify the similar fuzzy space
g(x)
.
Where Ai aresimilar fuzzy intervals
and U
iare These are triangular fuzzy sets that represent their membership
level functionare member functions representing the following
similar fuzzy intervals, where in the order U
1corresponds to A
1and ... U
7corresponds to A
7 Here the set of 3 linguistic in order from left to right only the left end, the semantic core, and the right end of a similarity Interval for semantic.A1:= [0, ( ), ( )
A2:= [ ( ), ( ), ( ) ;
A3:= [ ( ), ( ), ( ) ;
A4:= [ ( ), ( ), ( ) ;
A5:= [ ( ), ( ), ( ) ;
A6:= [ ( ), ( ), ( ) ;
A
7:= [ ( ), ( ),
3.1.1.For Similar fuzzy space and similar fuzziness interval.
According to Definition 1. [12], Definition 2. [12]
and on Figure 2 Show: 0U, , U1,…….U7 , 1U are
fuzzy triangular sets created Similar fuzzy space of elements {Very Low(V.Low), Low(Lw), LitleLow(L.Lw), W, LitleHigh(L.Hi), High(Hi), VeryHigh(V.Hi) }, It is also the membership function in the order of similar fuzziness interval A1,……A7 In that A2:= [ ( ),
( ), ( ) ) ( ), ( ), are the left and right border of the linguistic value Low and
( ) is semantically quantifying value. This means that all elements of this interval are similar to Low in the degree of acceptance.
Mapping sg :[0,1]X [0,1] determined
based on the distance from
to
(x) and two similar fuzzy space close to g(x) as follows:
( ) ( )
( , ) max min , , 0
( ) ( ) ( ) ( ) g
v x x v
s v x
x y z x
(1.2.2)
Where y,z are two grades defining two similar fuzzy space neighbors left and right of x .
this is
membership funtion of similar fuzzy
interval
A
i(i=1,….7)
Easy to deduce that: if
v
( )x then
s v xg( , )=
( )
( )
( )
v
x
y
;if
v
( )xthen
s v xg( , )=1;
if
( )
v
xthen
s v xg( , )=
( )
( )
( )
x
z
x
In [15] we have clearly stated how to build a
HA that matches the context of the problem. In
this section we introduce additional expressions
for calculating linguistic values according to
two HA parameters. This works for problem
solving. More importantly, it solves the
problem by using the neural network method or
the Ge
3.1.2. Specifying some expressions.
In Part F.2.1) have
(
W
)
=
=fm(c
-)
,
fm(c
+)=1-
,
(
c
) =
−
fm
(
c
) =
fm
(
c
),
(
c
+)=
+
fm
(
c
+),
fm(hx)=
µ(h)fm(x),
H
+={Very (V)}, H
-={Little(L)}, µ(V) =
, µ(L)
=
,
+
=1
=
1-
fm(VL.Lw)=fm(LV.Lw)= µ(V) µ(L)fm(Lw),
form
(Lw)=θβ), (W) =θ, (Hi)=1-(1-θ)βand
fm(VL.Lw)=fm(LV.Lw)= µ(V) µ(L)fm(Lw),
We calculate the number of fuzzy intervals fm(x) listed in the table below:
if = 0.4563 = µ(V)=1- µ(L)
add another lookup at Figure 1 and results of the
table above we have
:
(
LL.Lw)=
(
Lw
)+fm(VLL.Lw)=
*
+µ(L)*fm(LL.Lw)=(0.4563)2+(1-0.4563)*0.16072 =0.26976
Similarly, for cases we have the numerical result in Figure 2.
“There is an induced about the trend change in the forecasting in the discourse space into the space of [0,1] where there is a trend change to the quantitative semantics value due to the impact on the terms of the hedges. That is the basic to we construct the mathematics model for forecasting time series by (HA) approach” [15]. We want to say about µ(h), the single operator impact on the operand (language fm(V.Lw) fm(L.Lw) fm(VL.Lw) fm(LL.Lw) fm(VV.Lw) fm(V.Hi) fm(L.Hi) fm(VL.Hi) fm(LL.Hi) fm(VV.Hi)
0.20820 0.24801 0.13489 0.13488 0.09500 0.24801 0.29561 0.13489 0.16072 0.11320
value) generate new semantics for it - to create an upward or downward direction of of the operand, corresponding to the change of time series at a time - is an important factor for the time series forecasting. “According to the context, semantics of
̅( )
denotes number of the enrollment students at the medium level and W is the normalization value of̅( )
, they are calculated according formulas” :[16]Determining the two parameters of the HA through the analysis of the relationship of historical values in the properties:
- The average value - the boundary between the main semantic value: what is "high" and what is "low".
- Change of each value "Continue to increase or decrease" or "change in the opposite direction".as a bridge between the two semantics: "inherent" and "represented by fuzzy set imposed by the user" of each word
On that basis, we propose the following new time series forecasting algorithm. The algorithm emphasizes semantics generated by the problematic context and focuses on two steps:
- Adjust spacing
partitioning the universe of
discourse
-Set up a logical relationship group
3.2. Forecasting Algorithm (
Algorithm Based on semantics)-For convenience to present proposed method, we name the linguistic values of fuzzy time series as the variables Ai with i ∈N. Revυ(x) and Rev fm(x) are the
reversed mapping of υ(x) and fm(x), respectively, from
[0,1] to the universe of discourse of fuzzy time series U. Denote Ik, on U, is the interval corresponding to Ak.
-7 basic language values: Very Low (V.Low), Low, L.Low, W, Little High(L.Hi), Hi, V.Hi.
Step 1:Constructing the Hedge algebra (HA)
Constructing the Hedge algebra (HA) is consistent with the context of the forecasting problem by determining the fuzzy parameters set of HA based on the historical values relationship analysis of the time series . Specifically
- Determine the U, the universe of discourse of fuzzy time series F(t).
U = [min(F(t))−D1,max(F(t))+D2], where D1 and
D2 are proper positive numbers.
with xi (1≤ i ≤ n) are historical values
If S+ ≥ S− then h := h+1 else h := h−1
Step 2 Method for partitioning the universe of discourse , fuzzifying historical data of time series and mining fuzzy relationships from fuzzy time series
-Based on the explanation in Figure 2, constructing 7 similar fuzzy intervals correspond to 7 basic language values to partitioning the universe of discourse
- Based upon the distribution of historical values, put them into the corresponding linguistic term fuzziness interval for fuzzifying historical data of time series.
- Adjust the position of the historical values near the boundaries of the divisors intervals to reach the optimal divise method.
-The logical relation group is established as follows for mining fuzzy relationships from fuzzy time series
In Aj →Ai Who:
-if j> i then the group is forecasting down, -if j = i then the group forecasting is equal, -if j < i then the group is forecasting increase.
-Assume Set the group of fuzzy logical relationships is established in the Step 2 having the same left side :
At → Au(m)···Av(n), m,··,n are the number
of iterations of fuzzy logical relationship
At → Au and At → Av.
- Suppose that the value of the time series at (t-1 )have known according to above logical relationship groups if f(t) belong to
Revfm(At), then
The forecasting value at t is
( ) ( )
4.Experiment Result and Comment.
4.1. Enrollment Forecasting.
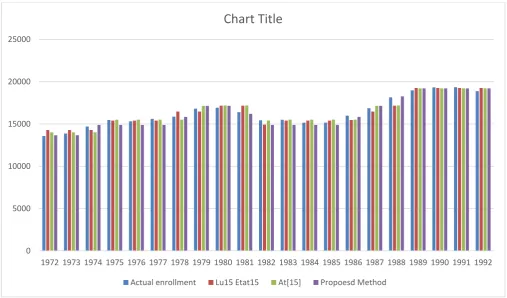
The proposed approach is applied to forecast the enrollments at the University of Alabama from year 1971 to 1992 (n = 22). The result will then be compared with different published methods. To measure the accuracy of the forecasting methods, the following metrics are used for comparison that Defined in [15]
RMSE: The Root Mean Square Error; NE(%):The Numerical Error (NE) percentage
NEE(%):The Normalized Numerical Error (NNE) percentage
According to [15] we have
(
W
)
=
=0.4563
and
µ(V)=
=0.4563 are parameter values use to
constructing
7
similar
fuzzy
intervals
for
partitioning the universe of discourse are illustrated
in Figure 2 .
However, in this division at A4 there are two levels of value between the "low" and the "high" as the "elements of meaning" so that the semantic difference in this range is greater than the difference in numeric value. Therefore, these values must be adjusted accordingly. After adjusting the reasonable divisions we have (VL.Lw replace L.Low)
Table 2. Shown left, right and Rve. of Ai
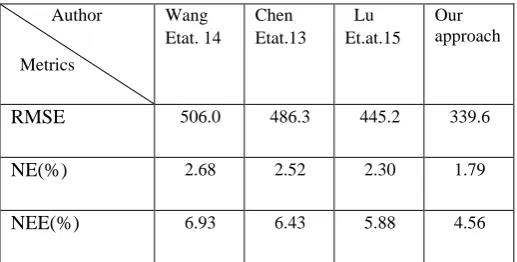
The following is the result of our statistics together with the results of other authors for omparison.
Table 3. shown Metrics of results of the methods The details are shown in Table 4 below
4.2. Forecasting AITEX Index
In this section, our proposed method is compared to [13]. Chen et.al. [13] suggested a method consisting of 6 steps to calculate the forecast TAIEX Index, these steps are listed below:
Propose a method to fuzzify the historical training data of TAIEX into fuzzy sets to from fuzzy logical relationships.
•
Grouped the logiccal relationships into fuzzy logical relationship groups (FLRGs) based on the fuzzy variations of secondary factor.•
Evaluate the leverage of the fuzzy variations between the main factor and the secondary factor to construct fuzzy variation groups.Ai Left and right of Ai Rve(Ai)
A1 [0 , 14096] 13665
A2 [14096,15832] 14888
A3 [15832,16194] 15832
A4 [16194,16625] 16194
A5 [16625,17750] 17138
A6 [17750,18694] 18263
A7 [18694,20000] 19208
Author
Metrics
Wang Etat. 14
Chen Etat.13
Lu Et.at.15
Our approach
RMSE 506.0 486.3 445.2 339.6
NE(%) 2.68 2.52 2.30 1.79
•
Get the statistics of the fuzzy variations appearing in each fuzzy variation group.•
Calculate the weight of the statistics of the fuzzy varitions appearing in each fuzzy variation group, respectively.•
Use the weights of the statistics of the fuzzy variations appearing in the fuzzy variation groups and the FLRGs to perform the forecasting the daily TAIEX.Chen et.al. [13] have applied their proposed method on the experimental data sets TAIEX Index of November and December 2004. The data set consists of 44 items.
In the first step, the historical training data of TAIEX is fuzzified into 9 fuzzy sets (h = 9 form A1 to A9), the accuracy metrics of the result are
RSME = 56.86 NE(%) = 0.8
NNE(%) = 12.44
With 7 split points ( h=7)
Year Actual enrollment
Chen Et at.96
Wang Et at.13
Wang Et at.14
Chen Et at.13
Lu15 Et.at15
Our approach
At. [15] Propoesd Method
1972 13563 14000 13486 13944 14347 14279 14003 13665
1973 13867 14000 14156 13944 14347 14279 14003 13665
1974 14696 14000 15215 13944 14347 14279 14003 14888
1975 15460 15500 15906 15328 15550 15392 15510 14888
1976 15311 16000 15906 15753 15550 15392 15510 14888
1977 15603 16000 15906 15753 15550 15392 15510 14888
1978 15861 16000 15906 15753 15550 16467 15510 15832
1979 16807 16000 16559 16279 16290 16467 17138 17138
1980 16919 16833 16559 17270 17169 17161 17186 17138
1981 16388 16833 16559 17270 17169 17161 17186 16194
1982 15433 16833 16559 16279 16209 14916 15402 14888
1983 15497 16000 15906 15753 15550 15392 15510 14888
1984 15145 16000 15906 15753 15550 15392 15510 14888
1985 15163 16000 15906 15753 15550 15392 15510 14888
1986 15984 16000 15906 15753 15550 15470 15510 15832
1987 16859 16000 16559 16279 16290 16467 17138 17138
1988 18150 16833 16559 17270 17169 17161 17186 18263
1989 18970 19000 19451 19466 18907 19257 19207 19208
1990 19328 19000 18808 18933 18907 19257 19207 19208
1991 19337 19000 18808 18933 18907 19257 19207 19208
1992 18876 19000 18808 18933 18907 19257 19207 19208
RMSE NE(%) NNE(%)
638.4 578.3 506.0 486.3 445.2 400.4 339.6
3.11 2.76 2.68 2.52 2.30 1.95 1.79
7.94 7.17 6.93 6.43 5.88 4.85 4.56
Our proposed method is applied to the same TAIEX datasets. The process is as follows According to Algorithm Based on semantics.
According to [15] we have (W) = =0.52 and µ(V) ==0.29 are parameter values use to constructing 7 similar fuzzy intervals for partitioning the universe of discourse.
Then perform the remaining steps of the algorithm. Forecast results according to the metrics as shown below with previous results for Compare.
Table 5. shown Metrics of results of the methods .
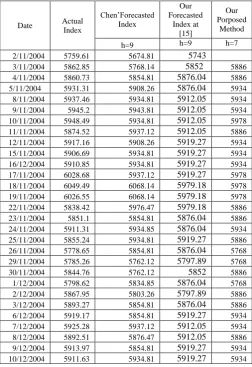
The details are shown in Table 6 below
Date Actual Index Chen’Forecasted Index Our Forecasted Index at [15] Our Porposed Method
h=9 h=9 h=7
2/11/2004 5759.61 5674.81 5743
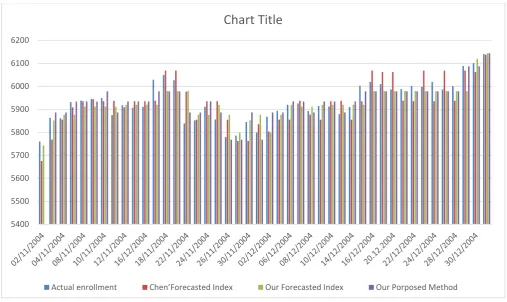
3/11/2004 5862.85 5768.14 5852 5886 4/11/2004 5860.73 5854.81 5876.04 5886 5/11/2004 5931.31 5908.26 5876.04 5934 8/11/2004 5937.46 5934.81 5912.05 5934 9/11/2004 5945.2 5943.81 5912.05 5934 10/11/2004 5948.49 5934.81 5912.05 5978 11/11/2004 5874.52 5937.12 5912.05 5886 12/11/2004 5917.16 5908.26 5919.27 5934 15/11/2004 5906.69 5934.81 5919.27 5934 16/12/2004 5910.85 5934.81 5919.27 5934 17/11/2004 6028.68 5937.12 5919.27 5978 18/11/2004 6049.49 6068.14 5979.18 5978 19/11/2004 6026.55 6068.14 5979.18 5978 22/11/2004 5838.42 5976.47 5979.18 5886 23/11/2004 5851.1 5854.81 5876.04 5886 24/11/2004 5911.31 5934.85 5876.04 5934 25/11/2004 5855.24 5934.81 5919.27 5886 26/11/2004 5778.65 5854.81 5876.04 5768 29/11/2004 5785.26 5762.12 5797.89 5768 30/11/2004 5844.76 5762.12 5852 5886 1/12/2004 5798.62 5834.85 5876.04 5768 2/12/2004 5867.95 5803.26 5797.89 5886 3/12/2004 5893.27 5854.81 5876.04 5886 6/12/2004 5919.17 5854.81 5919.27 5934 7/12/2004 5925.28 5937.12 5912.05 5934 8/12/2004 5892.51 5876.47 5912.05 5886 9/12/2004 5913.97 5854.81 5919.27 5934 10/12/2004 5911.63 5934.81 5919.27 5934
13/12/2004 5878.89 5937.12 5919.27 5886 14/12/2004 5909.65 5854.81 5919.27 5934 15/12/2004 6002.58 5934.81 5919.27 5978 16/12/2004 6019.23 6068.14 5979.18 5978 17/12/2004 6009.32 6062.12 5979.18 5978 20.12.2004 5985.94 6062.12 5979.18 5978 21/12/2004 5987.85 5937.12 5979.18 5978 22/12/2004 6001.52 5934.81 5979.18 5978 23/12/2004 5997.67 6068.14 5979.18 5978 24/12/2004 6019.42 5934.81 5979.18 5978 27/12/2004 5985.94 6068.14 5979.18 5978 28/12/2004 6000.57 5937.12 5979.18 5978 29/12/2004 6088.49 6068.14 5979.18 6087 30/12/2004 6100.86 6062.12 6119.36 6087 31/12/2004 6139.69 6137.12 6143.57 6144
RSME NE(%) NNE(%)
56,86 48.02 26.88
0.80 0.59 0.37
12.44 9.17 0.059
Table 6. Shown the detailed results of the proposed method and the preceding results.
4.3. Comment
The First of all, this proposed method is an improvement of the method already in [15], so it has advantages over the methods of the previously published authors, we briefly recall : We compare our approach with the method Wei Lu et.al. published in [11] to illustrate our superior efficiency. Conclusion of his methodological advantages of semantic assurance due to the context of Wei Lu stated “Interval information granules are always run through the whole process of finding optimal intervals, which make the partitioned intervals carry apparent semantics”[11]. As so , in the method of Wei Lu also pay attention to the balance between accuracy and semantics which is suitable with context in the calculation that is why we compare it with our approach. Our comparison focuses on two aspects: the calculation convenience and the forecasting accuracy.
•
First, the convenience in calculations: only with the simple calculations using Method for partitioning the universe of discourse and Algorithm for forecasting, we have obtained results about group of logical relationship like the results from Wei Lu [11]. However, our calculation is Metrics Chen’sOur in [16] Proposed Method RSME NE(%) NNE(%)
much simpler than theirs as shown in Table 2.[15]
•
Second, the forecasting accuracy: Table 3. shows our proposed method is about 10% better in term of accuracy (all metrics) compared to Wei Lu et.al. approach [11]. [15]The Second, As its name implies, semantic-based algorithms for performing two important steps are for partitioning the universe of discourse and data mining through logical relational grouping. Thus, a more convenient and efficient method of adjusting the divide interval and predicting more accurately than similar functional methods show in [15]. In terms of accuracy, the greater the number of divisions, the higher the accuracy. In both empirical problems forecasting enrollments at the University of Alabama forecating (forecasting enrollments) and
forecasting TAIEX Index (forecasting TAIEX) we used the divisor of 7 and compared the results of other methods with the number of divisions equal (7 for forecasting enrollments) and larger (9 for forecasting TAIEX). The accuracy of the method proposed (for metrics RMSE: The Root Mean Square Error)
-for the forecasting enrollments problem was 20.23% higher than that of Lu and 15.25% higher than our results at [15]
- for the forecasting TAIEX problem The accuracy of the proposed approach to the problem was 52.72% higher than that of Chen and 36.12% higher than our results at [15].
The numbers are very impressive and very convincing demonstrates the superiority of the accuracy of the proposed method!
Figure 3. Chart illustrates Table 4.
0 5000 10000 15000 20000 25000
1972 1973 1974 1975 1976 1977 1978 1979 1980 1981 1982 1983 1984 1985 1986 1987 1988 1989 1990 1991 1992
Chart Title
Figure 4. Chart illustrates Table 6.
5.Conclusion
This paper presents a novel technique based on the hedge algebras (HA) approach. It is highlights in proposed method:
Analyze the data of forecasting problem, special for historical values and their relationship to determine the fuzzy parameter set of hedge algebras.
Thereby the context-semantic of terms has preserved in the calculation. which concentrated on key steps: partitioning the universe of discourse of time series into a collection of intervals, mining fuzzy relationships from fuzzy time series,
Forecasting outputsit do not have to choose fuzzy sets for linguistics terms and defuzzifying output, which are the required steps in method based on fuzzy set theory. This is subjective imposition and so it is
the reason for separating the two types of semantics mentioned above.
REFERENCES
[1] Qiang Song and Brad S Chissom. Fuzzy time series and its models. Fuzzy sets and systems, 54(3): 269–277, 1993.
[2] Qiang Song and Brad S Chissom. Forecasting enrollments with fuzzy time seriespart i. Fuzzy sets and systems, 54(1):1–9, 1993.
[3] Qiang Song and Brad S Chissom. Forecasting enrollments with fuzzy time seriespart ii. Fuzzy sets and systems, 62(1):1–8, 1994.
[4] Shyi-Ming Chen. Forecasting enrollments based on fuzzy time series. Fuzzy sets and systems, 81(3): 311–319, 1996.
[5] Kunhuang Huarng. Effective lengths of intervals to improve forecasting in fuzzy time series. Fuzzy sets and systems, 123(3):387–394, 2001.
[6] Tahseen Ahmed Jilani, Syed Muhammad Aqil Burney, and Cemal Ardil. Fuzzy metric approach
5400 5500 5600 5700 5800 5900 6000 6100 6200
Chart Title
for fuzzy time series forecasting based on frequency density based partitioning. World Academy of Science, Engineering and Technology, International Journal of Computer, Electrical, Automation, Control and Information Engineering, 4(7):1194–1199, 2007.
[7] Kunhuang Huarng and Tiffany Hui-Kuang Yu. Ratio-based lengths of intervals to improve fuzzy time series forecasting. IEEE Transactions on Systems, Man, and Cybernetics, Part B (Cybernetics), 36(2): 328–340, 2006.
[8] Eren Bas, Vedide Rezan Uslu, Ufuk Yolcu, and Erol Egrioglu. A modified genetic algorithm for forecasting fuzzy time series. Applied intelligence, 41(2):453–463, 2014.
[9] Lizhu Wang, Xiaodong Liu, and Witold Pedrycz. Effective intervals determined by information granules to improve forecasting in fuzzy time series. Expert Systems with Applications, 40(14):5673–5679, 2013.
[10] Lizhu Wang, Xiaodong Liu, Witold Pedrycz, and Yongyun Shao. Determination of temporal information granules to improve forecasting in fuzzy time series. Expert Systems with Applications, 41(6):3134–3142, 2014.
[11] Wei Lu, Xueyan Chen, Witold Pedrycz, Xiaodong Liu, and Jianhua Yang. Using interval information granules to improve forecasting in fuzzy time series. International Journal of Approximate Reasoning, 57:1–18, 2015.
[12] Nguyen Cat Ho, Tran Thi Son, and Duong Thanh Long. Hedge algebras with limited number of hedges and applied to fuzzy classification problems. Journal of Science and Technology, 48(5), 2012.
[13] Shyi-Ming Chen and Chao-Dian Chen. Taiex forecasting based on fuzzy time series and fuzzy variation groups. IEEE Transactions on Fuzzy Systems, 19(1):1–12, 2011.
[14] [14] Cat Ho Nguyen, Van Thong Hoang, Van Long Nguyen. A discussion on interpretability of linguistic rule based systems and its application to solve regression problems. Knowledge-Based Systems 88 (2015): 107-133