Proceedings of The 9th International Natural Language Generation conference, pages 104–108,
Statistics-Based Lexical Choice for NLG from Quantitative Information
Xiao Li and Kees van Deemter and Chenghua Lin Computing Science department
University of Aberdeen King’s College Aberdeen, AB24 3FX, UK
{xiao.li, k.vdeemter, chenghua.lin}@abdn.ac.uk
Abstract
We discuss a fully statistical approach to the expression of quantitative information in En-glish. We outline the approach, focussing on the problem of Lexical Choice. An initial eva-luation experiment suggests that it is worth in-vestigating the method further.
1 Introduction
NLG systems express information in human lan-guage. To do this well, these systems need to “know”what expressions are most suitable for ex-pressing a given piece of information. The most direct way to define words in NLG systems is ma-nual coding, as it was done in systems such as FoG (Golberg et al., 1994) and SumTime-Mousam (Sri-pada et al., 2003). However, manual coding is time consuming, it can be argued to be theoretically un-satisfactory, and it is error prone even when perfor-med by domain experts. The process is complicated in the fact that words likepink(Roy, 2002) and eve-ning(Reiter et al., 2005) have different meanings for individual speakers.
Recent NLG approaches learn the use of words through statistical analysis of data-text corpora. For example, Belz’s semi-automatic system for weather forecasting automatically learns a grammar based on a pre-existing (i.e., manually coded) set of grammar rules (Belz, 2008). Liang et al. (2009) developed a fully statistical alignment-based algorithm that au-tomatically acquires a mapping from quantitative in-formation to English words by adopting a hierarchi-cal hidden semi-Markov model trained by Expecta-tion MaximizaExpecta-tion. Konstas and Lapata (2013) in-troduced a generation model based on Liang’s
algo-rithm . However, these existing approaches have dif-ficulty handling situations in which a word expres-ses acombinationof data dimensions, for example as when the word “mild¨expresses a combination of warm temperatures and low wind speed.
In this paper, we discuss a new approach to the problem; the approach is fully statistical and it is able to handle situations in which a word or phrase maps to a combination of data dimensions. We focus on Lexical Choice but are investigating applications to other areas of NLG.
2 Methodology
In many areas of perception research, a method cal-led “contour stylization¨ıs employed to mimic a com-plex signal (i.e., a comcom-plex graph) by means of a limited number of straight lines (Johan t Hart and Cohen, 1990). Our method uses the similar idea and applies it to two dimensions (i.e., weather data and language) at the same time. Our approach builds a bridge between quantitative information and words by discretising the data.
2.1 Representing Data in Vector
in which each key-point plays a role as a Signal Sen-sor. In the above example, 5 key-points are used to represent wind speed collectively, where each key-point specifies a specific range of wind speed. In this way, if a word describes wind speed within a certain range, we will find the connection of the word to the relative key-points.
Based on this formulation, any wind speed can be represented by weighted key-points through li-near interpolation. Suppose one would like to re-present an arbitrary wind speed, sayws = 5. Note thatws = 5 falls between the range of key-points ws = 0 andws = 12 as described above. Using linear interpolation, one can derive the weights of key-pointsws = 0 andws = 12 for representing ws = 5, which are 0.58 and 0.42 respectively. Be-cause the remaining key points does not contribute to represent wind speedws = 5, their weights are set to 0. Finally, the wind speed ws = 5 can be represented as a vectorh0.58,0.42,0,0i, which en-codes the weights for the key-point group.
Although in the above example key-points{ws= 0, ws= 12, ws= 24, ws= 36}are set evenly spa-ced, it should be noted that the setting of key-points (e.g., the choice of key-point values) has relatively little impact on predicting the use of words. This is because the our method can be regarded as fitting the occurrence function of words by a straight line in the contour stylization angle (in addition to the Signal Analysis), and the key-points present the inflection points’ abscissa of the straight line. Although care-fully selecting key-points can possibly enhance the model’s performance, our model adopt the evenly spaced key-points, which empirically works well en-ough in general.
2.2 Representing Words in Vector
Expressions such as words can be represented by key-points weight vectors as well. For example, in English the expressioncalmis only used to describe wind speed close to0. So,calmcan also be repre-sented using the same key-point group as before, i.e., represented with a high weight forws= 0(such as 0.9, for instance), and a low weight for ws = 12 (e.g., 0.01). For the moment, the weights ofcalm
are estimated by hand. In section 2.4 we will see how the weights can be estimated from a data-text corpus.
2.3 Lexical Choice
This section introduces how our proposed appro-cah handles the lexical choice in the NLG process through Cosine similarity. Suppose both quantita-tive information and lexical expressions have been converted into vectors (i.e., ~q and ~e) in the same vector space parameterised by the key-points. The problem of finding the most likely expression (~e) for the given quantitative information (~q) can be trans-formed to the process of finding the most similar lexical expression vector~e to~q. We exemplify the lexical choice process below, using wind speed as quantitative dimension.
Suppose the key-points are still{ws = 0, ws = 12, ws = 24, ws = 36}. The candidate expression words arecalmandbreeze, which can be represented in a form of key-point weight vectors as below:
~ecalm =h0.9,0.01,−0.9,−1i (1)
~ebreeze=h0.7,0.9,−0.8,−1i (2)
Now our goal is to choose the most suitable word to describe wind speedws = 5from the available candidate word expressions (i.e., calmandbreeze). As discussed in Section 2.1, ws = 5 can also be represented by a key-point weight vector
~qws=5 =h0.58,0.42,0,0i (3)
Based on the same key-point vector space, we calcu-late the Cosine similarities between each candidate word and the target wind speed ws = 5, and the most suitable word is naturally the one with the hig-hest similarity tows= 5.
Sim(~ecalm, ~qws=5) = k~e~ecalm·~qws=5
calmk k~qws=5k = 0.45
(4)
Sim(~ebreeze, ~qws=5) = k~e~ebreeze·~qws=5
breezek k~qws=5k = 0.64
(5) As can be seen above, the similarity between ~qws=5and~ebreezeis higher than that of~eclam.
There-fore,breezeis a better choice for expressingws= 5. 2.4 Estimating Weight Vector for Word
Expressions
each possible expression word. Suppose we haver data to text pairs denoted as < datai, texti >ri=1,
wheredataiin the pairs consists of quantitative
di-mensions andtextirefers to the expression words as
shown in Eq. 6.
< data, text >⇒ {dim1,...,m, exp1,...,n} (6)
Following section 2.1, for each data to text pair, we firstly discretise the data dimensions (dim1,...,m)
into a key-point group{~d1, ~d2, ..., ~dm} ≡ ~d. Next,
we can find the optimal values for weight vector ~ei
by solving Eq. 7 constructed based on the training data< datai, texti >ri=1.
~ d1 ~ d2 ... ~ dr ~eiT =
isOccur(expi|text1)
isOccur(expi|text2)
...
isOccur(expi|textr)
(7)
The function isOccur(expi|texti) returns 1 if expi
occurs in the corresponding texti, and returns 0
otherwise.
Generally, there are fewer free parameters than the number of equations, so we can always find the optimised solution for estimating~ei using Least
Square. If there are more than one solution, we adopt the solution with the least norm. In the same way, we can obtain weight vectors for all the candi-date expressions.
So far we have described how to estimate the key-point weight vector for every candidate expression from training data, i.e., data-text pairs. In the test phase, to predict the most likely words for unseen data, we firstly represent data as a weight vector, and then compare its cosine similarity against every can-didate expression. Since the weight vectors for ex-pressions~eiare trained through the occurrence
func-tion isOccur(), the similarity between unseen data and a candidate expression reflects the suitability of an expression in expressing the data.
2.5 Discussion: Handling multiple dimensions One of the important features of our approach is the ability of choosing expressions for data with mul-tiple dimensions. We stress that both the training process and lexical choice process are applicable to
multiple data dimensions. First, in the training pro-cess, information of different quantitative dimensi-ons is converted into key-point weights, so the boun-daries between different dimensions have disappea-red. The training process could even calculate the implicit relationship between expressions and quan-titative data. Second, the lexical choice process se-lects expressions based on a set of dimensions rather than each single dimension. This is why this appro-ach can handle the multiple dimension information.
3 Evaluating the proposed approach to Lexical Choice
To perform an initial sanity check on our appro-ach, we built a small corpus from SumTime-Meteo Corpus (Sripada et al., 2002), which contains hu-man writing weather forecasts with meteorological data. We selected 144 wind speed forecasts with data whose wind speeds do not change a lot during a forecast period, and summarize these data into three dimensions, as shown in Table 1.
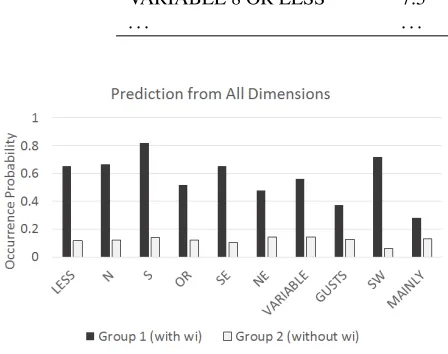
We randomly selected 96 records of the total 114 data records to train the model, and adopt the rest of data records to evaluate. We evaluated 10 words1:
LESS, N, S, OR, SE, NE, VARIABLE, GUSTS, WS, MAINLY, which are the words occurring more than 5 times in the small corpus. For each candidate word wi, we separate the testing data into two groups.
Forecast texts in group 1 contain word wi but not
in group 2. When we use our model (trained with the SumTime-Meteo Corpus) to predict the occur-ring probability of wi in group 1 and group 2
res-pectively, we expect to obtain higher occurring pro-babilityp(wi|G1)from group 1 thanp(wi|G2)from
group 2. The results are shown in Figure 1.
As shown in Figure 2, it is clear that experimental results are inline with our expectation: our approach does produce higher occurring probabilities in group 1 than in group 2. Recall that one key feature of our approach is its capability to model multiple dimen-sional features. To show the benefit of this feature, we have also applied our approach modelling taking into account each single dimension separately. By comparing Table 1 and Table 2, we can see that the
1“Words¨ın the SumTime-Meteo Corpus include
Tabel 1:Some sample records of our corpus.
Wind Speed Wind Direction Wind Variance
MAINLY W-NW 10 OR LESS 4.2 282 7
VARIABLE 8 OR LESS 7.5 319 12
. . . .
Figuur 1:The predicted occurring probabilities based on data of all dimensions.
prediction performance of words based on multiple dimension outperforms all the models considering a single dimension only, especially when predicting wordsvariableandmainly.
4 Conclusion
We have sketched an approach to choosing lexical expressions according to multiple quantitative infor-mation. To have this ability, this approach learns the relationship between quantitative information and words by the following steps: a) resolving quanti-tative information and the occurrence of expressions into the same linear space; b) building equations of expressions’ weight vector; c) finding the best solu-tion of the equasolu-tions. Initial evaluasolu-tion suggest that this approach may be on the right track.
The possibility of applications to Lexical Choice in Natural Language Generation is perhaps most ob-vious, but the mapping that we learn is applicable to interpretation as well. In other words, our proposal aims to solve the age-old problem in Linguistics and Fuzzy Logic of how to specify the meaning of vague words (Van Deemter, 2012), which resists traditi-onal approaches to semantics, because these words admit borderline cases.
Acknowledgments
This work is supported by the award made by UK Economic & Social Research Council (ESRC); award reference ES/M001628/1.
References
Anja Belz. 2008. Automatic generation of wea-ther forecast texts using comprehensive probabilistic generation-space models.Natural Language Enginee-ring, 14(04):431–455.
Eli Golberg, Richard Kittredge, and Norbert Driedger. 1994. A new approach to the synthesis of weather fo-recast text.IEEE Expert.
Rene Collier Johan t Hart and Antonie Cohen. 1990. A perceptual study of intonation.
Ioannis Konstas and Mirella Lapata. 2013. A global model for concept-to-text generation. J. Artif. Intell. Res.(JAIR), 48:305–346.
Percy Liang, Michael I Jordan, and Dan Klein. 2009. Learning semantic correspondences with less supervi-sion. InProceedings of ACL-47, pages 91–99. Ehud Reiter, Somayajulu Sripada, Jim Hunter, Jin Yu,
and Ian Davy. 2005. Choosing words in computer-generated weather forecasts. Artificial Intelligence, 167(1):137–169.
Deb K Roy. 2002. Learning visually grounded words and syntax for a scene description task. Computer Speech & Language, 16(3):353–385.
Somayajulu Sripada, Ehud Reiter, Jim Hunter, and Jin Yu. 2002. Sumtime-meteo: Parallel corpus of natu-rally occurring forecast texts and weather data. Com-puting Science Department, University of Aberdeen, Aberdeen, Scotland, Tech. Rep. AUCS/TR0201. Somayajulu Sripada, Ehud Reiter, and Ian Davy. 2003.
Sumtime-mousam: Configurable marine weather fo-recast generator. Expert Update, 6(3):4–10.