This article has been accepted for publication and undergone full peer review but has not been through the copyediting, typesetting, pagination and proofreading process which may lead to differences between this version and the Version of Record. Please cite this article as doi: 10.1002/rcm.8268
Triple oxygen isotope analysis of nitrate using isotope
exchange - cavity ringdown laser spectroscopy
Fernando Gázquez
*and Mark W. Claire
School of Earth and Environmental Sciences. University of St. Andrews. St Andrews, KY16 9AL, UK.
*Corresponding author: [email protected]
Abstract
RATIONALE: Triple oxygen isotopes (16O/17O/18O) in nitrate are a valuable tool to ascertain the pathways of nitrate formation in the atmosphere and the fate of nitrate in ecosystems. Here we present a new method for determining17
O values in nitrates, based on nitrate-water isotope equilibration (IE) and subsequent isotopic analysis of water using cavity ringdown laser spectroscopy (CRDS).
METHODS: Nitrate oxygen (O-NO3-) is equilibrated with water oxygen (O-H2O) at
low pH and 80oC. Subsequently, the 17O and 18O values of equilibrated water are determined by CRDS, scaled to V-SMOW and V-SLAP and calibrated against nitrate standards (USGS-34, USGS-35 and IAEA-NO3). We provide isotopic measurements of synthetic and natural nitrates and a direct inter-lab with the classic method of thermal-decomposition of nitrate followed by isotope ratio mass spectrometry of O2
(TD-IRMS).
RESULTS: For synthetic NaNO3, the precision (1SD) of the IE-CRDS method is
solution). For natural samples, after purification of nitrates by column chemistry and reprecipitation as AgNO3, the precision is better than 1.8‰ for 17O values, 3.2‰ for
18
O values and 1‰ for 17O values. IE-CRDS and TD-IRMS yield 17O values within the analytical errors of the two methods.
CONCLUSIONS: The IE-CRDS method for determining 17O values in nitrates utilizes a user-friendly and relatively cheaper benchtop analytical instrument, representing an alternative to IRMS-based methods for certain applications.
1. INTRODUCTION
Triple oxygen isotope measurements (16O/17O/18O) have become an important part of the geochemical toolkit over the past two decades, influencing fields such as atmospheric chemistry1-4, meteorites and planetary science5-7, hydrology8,9, paleoclimatology10-12, atmospheric evolution13-14, forensic studies15,16, among other promising applications17,18. Many of these investigations focused on oxygen-bearing compounds in sediments and soils, in order to constrain the atmospheric processes and environmental conditions that prevailed at the time of mineral precipitation3,11,19,20. This is because, under certain conditions, some minerals (e.g. nitrates, sulfates and carbonates) record and preserve the isotopic composition generated in other oxygen reservoirs, including the atmosphere4 and the hydrosphere3,11,21. In particular, triple oxygen isotopes in atmospheric nitrate particles2, soil nitrate3, nitrate in ice22 and nitrate dissolved in natural waters23-26 have provided key insights into the pathways of nitrate formation in the atmosphere and the fate of nitrate in ecosystems.
The 18O/17O/16O anomalies (17O values) in oxygen-bearing compounds can be expressed as deviations with respect to the oxygen isotope ratios in Earth natural waters17,18. In the present study, we use the following definition for 17O:
17O = ln(17O+1) – 0.528 ln(18
O+1) (Equation 1)
describe the 17O and 18O relationship in rainwater worldwide8, and we use equation 1, given that we primarily analyze water samples in this study. Note that 17
O (usually specified in parts per thousand or ‰ units) is equivalent to 17Oexcess
(usually specified in parts per million or “per meg” units), which is used extensively in investigations on triple oxygen isotopes in the hydrologic cycle8,9,11. In this study, we use 17O when referring to large triple oxygen isotope anomalies, such as those observed in solids (e.g. nitrates) and 17O-spiked waters, whereas 17Oexcess is used
when discussing natural waters and isotopically equilibrated samples (normally <<1000 per meg or 1‰). Note that some previous studies used alternative definitions for triple oxygen isotope anomalies, which yield slightly different values of 17
O for equivalent 17O and 18O values17, 29; thus, caution must be taken when comparing directly 17
O values from different studies.
Nitrates from atmospheric deposition generally show large 18
O values30 (e.g. 40‰
to 80‰) with extremely large triple oxygen isotope anomalies30 (17O from 15‰ to 33‰). This is because of photochemical reactions of NOx with atmospheric O3,
which carries the primary “anomalous” oxygen isotope signature from mass-independent fractionation (O-MIF) processes during stratospheric ozone formation31. Reactions with O3 also transmit 17O values to other atmospheric species which can
transfer to the surface in wet or dry deposition (e.g. sulfates and perchlorates, etc.), but nitrate aerosols retain (and preserve) the largest known natural solid-phase 17
O values.
The first measurements of triple oxygen isotopes in nitrate were performed by Michalski et al 32, whose method consists of determining the 18O and 17O values in nitrate by generating O2 through the thermal decomposition of AgNO3, followed by
isotopic analysis of the O2 by Isotope Ratio Mass Spectrometry (TD-IRMS) (Table 1).
Later, Kaisier et al33 developed a method based on the conversion of nitrate to N2O
using a bacterial denitrifier strain and subsequent decomposition of N2O to N2 and
O2 in a gold furnace at 800°C, followed by gas chromatographic separation and
isotope analysis of O2 by IRMS. This procedure requires considerably less nitrate
(~50 nmol) than the Michalski et al method (6-40 mol) but maintains comparable 17
oxygen isotopes in the same nitrate sample (Table 1). Likewise, Kunasek et al35 modified the TD-IRMS method by conducting the nitrate decomposition in a high temperature conversion elemental analyzer (TC/EA) at 550oC. The main difference between the later method and that described in Michalski et al32 is the use of a continuous flow of helium in the on-line pyrolysis system to carry sample to the mass spectrometer, whereas the original procedure utilized an off-line preparation of O2
under vacuum. Schauer et al36 reported that 17O results obtained by TD-IRMS method can be compromised due to oxygen isotope exchange between O2 and
quartz at high temperatures when quartz cups are used to introduce the samples in the TC/EA furnace, and recommended silver capsules for the TD-IRMS method. The updated TD-IRMS methods for 17O in nitrates show reproducibility in the range of 0.2‰ to 0.4‰ (1SD) (Table 1).
Alternatively, Komatsu et al37 used a chemical procedure involving cadmium sponge and NaHCO3 solution to convert dissolved nitrate to N2O38,39, followed by direct 17O
determination in N2O by IRMS, with reproducibility of 0.2‰. More recently,
Dyckmans et al40 developed a method based on the conversion of nitrate to N2O
using bacteria, similar to that of Kaiser et al33, but in this case decomposition of N2O
to N2 and O2 is performed by a microwave-induced plasma in a corundum tube. An
automatized version of the Dyckmans et al40 method was developed by Hattori et al41, with overall external 17O precision of 0.3‰. Finally, Wassemaan et al42 developed an innovative method based on dissolved NO3- reaction with Cd-azide
and analysis of the evolved N2O by laser spectroscopy (Table 1).
Although relatively high 17
O precisions can be achieved by these methods (~0.1 to 0.5‰), several significant inconveniences have stopped the implementation of some of these analytical methods on a wider basis. These include the use of costly setups (e.g. gold furnace)33 and hazardous reagents (e.g. Cd-azide)42, as well as extremely expensive analytical instruments (i.e. isotope ratio mass spectrometers).
oxide42. It is only very recently, however, that methods for triple oxygen isotopes in solid materials and dissolved salts using laser spectroscopy-based analyzers have been presented42,48.
Laboratory experiments have demonstrated that oxygen isotopes in nitrate (O-NO3-)
exchange and equilibrate with water oxygen isotopes (O-H2O) at low pH (<1.1) and
temperatures above 50oC; while no isotopic exchange is observed at lower temperature and circumneutral pH49. This means that (1) nitrate can preserve its primary oxygen isotopic composition after precipitation if not exposed to extreme conditions and (2) isotopic equilibration with water is possible under acid wet laboratory conditions.
Because oxygen equilibration involves an isotope mass-balance, any observed change in the 18O value of O-NO3- after equilibration is accompanied by an
equivalent change in the 18O value of O-H2O. As suggested by Kaneko and
Poulson49, the O-NO3-/O-H2O isotopic equilibration is expected to follow a
mass-dependent law for triple oxygen isotopes50 (i.e. 17O=18Oθ, where θ~0.52). Hence, provided adequate proton concentration and heat, the oxygen isotope composition of nitrates, including 17O anomalies, will be “transmitted” to water and vice-versa. The isotopic composition (17
O, 18O and 17Oexcess values) of the equilibrated water can
then be measured with high precision (better than 15 per meg) by CRDS44. By following this approach, we have developed a new method to determine 17O in nitrate based on O-NO3-/O-H2O isotope equilibration, followed by isotope analysis of
2. EXPERIMENTAL AND ANALYTICAL METHODS
2.1. Preparation of internal nitrate standards
Internal nitrate standards (NaNO3) with different 17O, 18Oand 17O values were
generated by the equilibration method described by Böhlke et al.51 The oxygen isotopes of HNO3 (~65% by weight, VWR Chemicals Prolab, Lutterworth, UK; no.
20429.320) were equilibrated with oxygen in DI water (deionized water with electrical conductivity <15 μS/m) spiked with different amounts of 17
O-enriched water (10%, Berry & Associates, Dexter, MI, USA). Four simultaneous equilibration procedures were conducted to create internal NaNO3 standards, described here as 01,
ST-02, ST-05 and ST-06. The measured 17
O values of our mixed 17O-enriched waters ranged from 2.2‰ to 54.0‰. The initial isotopic composition of the total solution in our equilibrations will differ from that measured in the 17O-enriched waters, as the isotopic composition of the water in the bulk HNO3 acid (~35% H2O) is unknown. The 17
O-enriched H2O/HNO3 solutions (1M, pH=0) were equilibrated in 500-mL tightly
capped Nalgene HDPE plastic bottles at 80±0.1oC in a Memmert™ Natural Convection Oven (Fisher Scientific, Loughborough, UK) for 7 days. Afterwards, the solutions were rapidly introduced into an ice-water bath to “quench” the O-isotope exchange between NO3- and H2O. The acid solutions were neutralized by slowly
adding 10M NaOH (+99.5%, Fisher Scientific; no. S/4920/53), also with unknown oxygen isotope composition. During neutralization, the solutions were immersed in an ice-water bath to dissipate heat released from the reaction. The pH of the solutions was monitored until final pH values ranging from 6.5 to 7.5 were achieved. These neutral solutions were air-dried for 3-4 days at 35oC. The precipitated NaNO3
was then ground to a fine powder using an agate mortar to remove fluid inclusions in crystals and further homogenize the material. The ground NaNO3 was dried for 1 day
at 35oC and finally stored in amber glass bottles. Our four synthetic NaNO3
standards with different O-MIF values, along with an additional in-house standard of analytical grade NaNO3 (namely ST-03; +99%, Acros Organics, via Fisher Scientific;
2.2. O-NO3-/O-H2O isotope equilibration (IE) and subsequent isotopic analysis
of water using cavity ringdown laser spectroscopy (CRDS)
2.2.1. General O-NO3-/O-H2O isotope equilibration method
Equilibration experiments were performed in Hungate type anaerobic culture tubes, 16x125mm, with Butyl stoppers and screwed cap (Fisher Scientific; no. 501215187). Nitrate salts were weighed to a precision of ±0.1 mg. Subsequently, 500 L of 0.79M
HCl (pH=0.1; referred as ST-HCl hereafter), sourced from analytical grade HCl (12N; Fisher Scientific) and diluted with DI water with known and constant oxygen isotopic composition (referred as ST-H2O hereafter), was added to the tube and weighed
again. In our experiments, the O-NO3-/O-H2O molar ratio (called β hereafter) ranged
from 0.0011 to 0.0581 (e.g. 12 to 590 mol of NO3- in 500 L of ST-HCl, or 6 to 295
mol in 250 L), with a precision of ±0.0001 (1SD). The tubes were capped and placed in the oven at 80oC±0.1oC, typically for 3 to 5 days. Subsequently, the tubes were rapidly introduced in an ice-water bath to “quench” the O-isotope exchange between NO3- and H2O. After ~30 min, the tubes were vigorously shaken. Because
the analysis of acid solution can pose a serious threat for the Picarro (Santa Clara, CA, USA) vaporizer and CRDS analyzer (e.g. deterioration of valves and potential damage of the cavity’s mirrors), solutions were neutralized before the oxygen isotopic analysis. To this end, 41.5 L of 10M NaOH, created by dissolving NaOH (+99.5%, Fisher Scientific; S/4920/53) in ST-H2O (referred as ST-NaOH hereafter),
was added to neutralize the 500-L acid solution, then capped and shaken. Note that the NaOH is kept at 4oC before use, in order to aid dissipation of heat released from the neutralization reaction. Once the pH was neutral, the solutions were stored at room temperature until analysis. 250 L of solution was transferred into 2-mL septum-capped glass vials, fitted with a 300-L micro-insert (Fisher Scientific; no. 10376102), and then loaded into a Picarro A0325 autosampler.
Two types of blank experiments were performed together with the equilibration experiments: (1) blanks consisting of 500 L of ST-H2O and (2) blanks consisting of
manipulation (e.g. pipetting). The later neutralized blank similarly accounts for evaporation but allows evaluation of three sources with unknown oxygen isotope compositions. This includes (i) water from the original concentrated HCl that represents ~4% of the initial solution in the equilibration experiments; (ii) water from the ST-NaOH solution, representing <0.01% of the solution, whose isotopic composition of the original ST-H2O may have been modified because of equilibration
with OH- (aq) from the NaOH with unknown isotopic composition; (iii) water generated from the neutralization reaction and in which the oxygen also derives from OH- (aq), representing ~0.8% of the final solution; and (iv) presumed isotope exchange with the borosilicate glass of the tubes at high temperature and low pH. In summary, the ST-HCl blanks account for presumed water evaporation, isotopic fractionation during sample handling and any isotopic background produced by the ~5% of water with unknown isotopic composition derived from the reagents in the experimental protocol.
2.2.2. O-NO3-/O-H2O isotope equilibration of small samples
Sample amount can be a limiting factor for some applications of our method (e.g. nitrates in ice and freshwaters; see section 3.4), so we explored reducing the solution volume in the O-NO3-/O-H2O equilibration step in order to decrease the
sample size required. To this end, 9 mol of NO3- (±0.1 mol) (e.g. 800 g of NaNO3
Finally, the 6-mm break-seal tubes were flame sealed and placed in the oven at 80oC for at least three days.
After equilibration (same conditions as section 2.2.1), the tubes were rapidly placed in an ice bath. Prior to analysis, water was frozen into the base of the break-seal tube by immersion in liquid nitrogen. Subsequently, the tube was scored with a diamond cutter, broken to a fixed height of 25 mm, and then quickly inserted into the 2-mL septum-capped vials used by the Picarro A0325 autosampler45. Prior to the analysis, the solution was neutralized by adding 4.2 L of the ST-NaOH solution (10N).
2.2.3. Equilibration time and sample amount sensitivity
To evaluate the time required by the O-NO3-/O-H2O system to achieve isotopic
equilibrium, we carried out equilibration experiments using nitrate standards, ST-01 and ST-03. The experiments consisted of 234±1 mol of NO3- (i.e. 20 mg of NaNO3)
dissolved in 500 L of ST-HCl solution and equilibrated at 80o
C for different periods of time (1 h, 3 h, 6 h, 16 h, 24 h, 46 h, 72 h, 96 h and 528 h). The experiments were performed in duplicate using the methods described in section 2.2.1, except for the equilibration time.
The sealed tube ensures isotopic mass-balance in the O-NO3-/O-H2O equilibration
2.2.4. Calibrations with international reference nitrates
A typical run of equilibration experiments consists of 10-12 unknowns (4-5 duplicated samples), 3 standards run in duplicate, 1 ST-H2O blank and 1 ST-HCl blank. The
same molar amount of NO3- (±0.1 mol) was used for unknown and standards in
each set of experiments. Our three-point calibration line using the international reference materials covers the oxygen isotopic composition of most of the samples analyzed in this study and most nitrates observed in nature. We run our 5 synthetic nitrates (ST-01, ST-02, ST-03, ST-05 and ST-06) together with the international standards USGS-34 (18
O=-27.9‰ and 17O=0‰), USGS-35 (18O=+57.5‰ and 17
O=+20.7‰) (both from National Institute of Standards and Technology, Gaithersburg, MD, USA) and IAEA-NO3 (18
O=+25.6‰ and 17O=-0.2‰) (International Atomic Energy Agency, Vienna, Austria). Standards USGS-34 and IAEA-NO3 are KNO3, while USGS-35 and our internal synthetic standards are
NaNO3, so care was taken to ensure that equivalent amounts of NO3- were used. To
evaluate the sensitivity of the calibration of unknowns to sample size we conducted calibrations with different nitrate amounts (i.e. β from 0.0011 to 0.0581).
2.2.5. Natural samples
10 mL of BaCl2 solution (50 g/L) was added to each 50 mL of solution to precipitate
any sulfates and phosphates. The tubes were centrifuged, and the supernatant was transferred to new tubes. In addition to sulfates, a complex mixture of other salts (e.g., chlorides and perchlorates) in solution is expected, so dissolved nitrates were purified and converted to AgNO3 using anion exchange resin AG1-X8 (200-400
mesh in the chloride form, Bio-Rad, Hercules, CA, USA) using the method described by Silva et al52. The internal standards ST-01, ST-02 and ST-03 (previously calibrated against USGS-34, USGS-35 and IAEA-NO3, see previous section) were treated in the same way and converted to AgNO3. The resulting AgNO3 was
analyzed using the procedure described in section 2.2.1. To this end, 14 mg of AgNO3 (82 mol of NO3-) was dissolved in 250 L of ST-HCl solution (i.e.
β=0.0162±0.0001). AgNO3 reacts with HCl to produce insoluble AgCl and HNO3. The
AgNO3 from natural samples was also independently analyzed for 18O values using
the method to be described in section 2.4.
2.2.6. Isotopic analysis of water by CRDS
Isotope analyses were conducted at the School of Earth and Environmental Sciences, University of St. Andrews (St Andrews, UK). Water oxygen and hydrogen isotopes were measured simultaneously by CRDS using a L2140-i Picarro water isotope analyser44, interfaced with an A0211 high-precision vaporizer. The instrument used N2 gas as carrier. Because of the relatively high salinity of the
solutions analyzed in this study (up to ~100 g/L), long-term accumulation of salts in the vaporizer can pose an issue for routine analyses. We use a metal mesh insert that is introduced into the vaporizer port and filled with glass wool to retain salts and prevent them from accumulating in the vaporizer. The insert was replaced and cleaned at the beginning of every run.
Each sample was injected ten times into the vaporizer, which was heated to 110°C. Memory effects from previous samples were avoided by rejecting the first three analyses. Values for the final 7 injections were averaged with a typical mean instrumental precision (±1SD) of ±0.02‰ for 17O values, ±0.03‰ for 18O values and ±0.19‰ for 2
samples. To this end, three internal water standards (JRW, BOTTY, SPIT) were calibrated against V-SMOW and SLAP, using 17O values of 0.0‰ and -29.69865‰,
respectively, and 18O values of 0.0‰ and -55.5‰, respectively29. This approach assumes that V-SMOW and SLAPhave 17Oexcess=0. All the 17Oexcess values are given
in per meg units (0.001‰). The in-run drift of the instrument was monitored by analyzing a water standard every 6 samples. No drift was observed, so no correction was necessary. The 17Oexcess value was calculated for each injection using the
normalized 17O and 18
O values. The 17Oexcess values from the 7 repeated analyses
were then averaged. Typical in-sample 17Oexcess and d-excess precisions (1SD) in
water standards (BOTTY, n=127), were 13 per meg. No 17Oexcess values were
rejected.
2.3. Triple oxygen isotope analyses by thermal decomposition followed by
IRMS (TD-IRMS)
Synthetic nitrates (ST-01, ST-02, ST-03, ST-05 and ST-06) were also analyzed for 17
O by the classic method of thermal decomposition of nitrate followed by isotope analysis of O2 by IRMS33 at the Department of Geology and Geophysics, Louisiana
State University (Baton Rouge, LA, USA. The NaNO3 was converted to O2 by
heating the sample to 520oC in vacuo (10-7 torr) in borosilicate tubes. After cryogenic trapping of evolved NOx, the evolved O2 was cryogenically trapped in a cold finger
using 5A molecular sieves at 77K. The triple oxygen isotope ratios of O2 were
determined using a Finnigan-Mat 251 isotope ratio mass spectrometer (Thermo Scientific, Bremen, Germany) with Faraday cup detectors at m/z 32, 33, and 34. The 17
O values of the unknows are calibrated against the reference materials IAEA-NO3 and USGS-35. The typical 17
O precision of the method is ±0.2‰ (1SD).
2.4. Measurement of 18O values by High Temperature Conversion Elemental Analyzer coupled to IRMS (TC/EA-IRMS)
For δ18
(Cambridge, UK). Samples (~100 g) were loaded in tin capsules and run four consecutive times, bracketed by the international nitrate standards, USGS-34, USGS-35 and IAEA-NO3. IAEA-NO3 was analyzed every 15 samples to monitor the drift of the instrument. The typical in-sample precision of the unknown and the standards was ±0.5‰ (1SD). All δ18O values are relative to V-SMOW.
3. RESULTS AND DISCUSSION
3.1. Blanks and background
The IE-CRDS method described here uses blanks to evaluate the effect of a number of processes and sources of oxygen that may affect the magnitude of the results, including water evaporation and isotope fractionation when handling the solutions, isotopic exchange between the water and the borosilicate tubes and the contribution of waters with unknown isotope composition from the reagents (i.e. concentrated HCl and NaOH).
The isotopic composition of the ST-H2O standard before the experiments (17
O= -4.13±0.03‰; 18O= -7.88±0.05‰; 2H =-52.8±0.4‰; 17Oexcess=35±11 per meg;
n=21) is indistinguishable from that of the same water placed in the oven at 80oC in the Hungate tubes for at least 3 days (17
O= -4.14±0.05‰; 18O= -7.88±0.09‰; 2H =-53.0±0.4‰; 17Oexcess=35±13 per meg; n=23). This confirms that no evaporation
occurs during the extent of the experiments, nor isotope fractionation during solution transferring, as higher 17O, 18O and 2H values and lower 17Oexcess values, would
be expected for evaporated waters9,11,44.
The second type of blank in our method involves the acid solution ST-HCl. The isotopic composition of the ST-HCl blanks after the equilibration period and neutralization (17O= -4.19±0.04‰; 18O= -7.98±0.08‰; 2H=-55.4±0.9‰;
17
Oexcess=37±8 per meg; n=22) shows slightly more negative values of 17O and 18O
(approximately 0.1‰ for 18O and 0.05‰ for 17O) than the ST-H2O standard used to make the ST-HCl solution. Importantly, the 17Oexcess of the ST-HCl after the
was observed to be 2.5‰ lower than that of the ST-H2O standard. In summary, this indicates that waters with unknown isotope composition from the HCl concentrated solution, the ST-NaOH solution and/or the neutralization reaction significantly affect the 2H value, have an minor impact on the 17O and18O values, and do not alter the 17Oexcess of the final solution. These combined results also rule out significant
isotope exchange between water and the borosilicate at the experimental conditions (pH=0.1 and 80oC). Given the above demonstrations, we assert that the IE-CRDS method for oxygen isotope measurements on nitrate does not require background/blank corrections provided that all samples and standards are processed identically.
3.2. Isotopic equilibration and sample size dependence
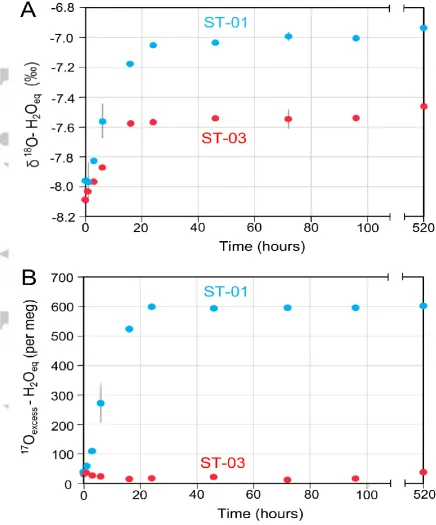
As expected, we found that the isotopic composition of the ST-HCl acid solution equilibrated with dissolved NO3- (constant of 0.0232±0.0001) at 80°C changed with
time, reaching a plateau after ~24h (Figure 1). This performance was slightly faster than in similar experiments reported by Kaneko and Poulson49 in which 98% equilibration occurred after 121 h. In practice, we extend our experiments to at least 72 h. Longer equilibration periods do not influence the final isotope values.
The isotope equilibrium composition of water (e.g. the 18
O-H2Oeq value in Figure 1A)
depends on the isotope composition of initial nitrate. For example, the 18O-H2Oeq
value of water in equilibrium with our ST-01 synthetic nitrate with initial 18O-NO3
-=47.2±0.8‰, (measured by TC/EA-IRMS; Table 2) is -7.0‰, whereas it is -7.6‰
when the dissolved nitrate is ST-03 with initial 18O-NO3-=26.3±0.7‰. Likewise, the 17
Oexcess of water equilibrated with the ST-01 nitrate reaches a constant value after
24 h (Figure 1B), with a 17Oexcess of 600 per meg, ~570 per meg higher than that of
the initial ST-HCl solution and considerably elevated compared with natural waters8 (e.g. ~37 per meg). In contrast, the water equilibrated with the ST-03 standard shows constant17
anomaly (17
O) of 23.2‰ (measured by TD-IRMS; Table 2), whereas the ST-03 nitrate is a commercial analytical reagent with no MIF-anomaly (17
O=-0.1‰).
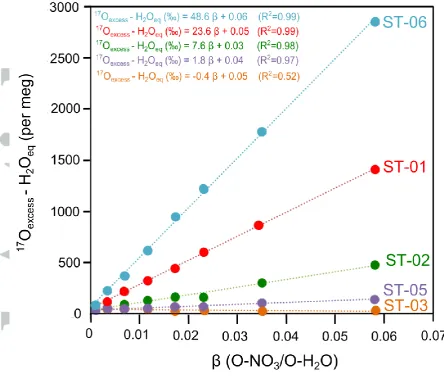
We evaluated the change in 17Oexcess experienced by the ST-HCl solution after
complete equilibration with different amounts of dissolved nitrate (i.e. β from 0 to 0.0581 at a fixed volume of 500 L) with 17O ranging from -0.1‰ to 45.4‰
(measured by TD-IRMS). The 17Oexcess of the equilibrated ST-HCl solution linearly
increases with sample size (i.e. increasing β) with R2
better than 0.97 in the experiments performed with O-MIF nitrates (ST-01, ST-02, ST-05 and ST-06) (Figure 2). The 17Oexcess of the exchanged water reaches values up to ~2800 per
meg (2.8‰) for of 0.0581 (e.g. 590 mol of NO3- in 500 L of acid solution).
However, when the nitrate ST-03 (17
O=-0.1‰) is used, as expected for equilibration with O-MDF nitrate, the measured 17Oexcess barely changes with
increasing amount of nitrate in solution. Importantly, the slope of vs17
Oexcess-H2Oeq in Figure 2 is directly proportional to the
17
O value of the O-NO3-. The lines fitted on Figure 2 represent the mixing path
between O-H2O and O-NO3-, where a of 0 means that all the oxygen in the mixture
corresponds to water (e.g. no nitrate in solution) and a equal to 1 would imply (implausibly) that all the oxygen corresponds to nitrate. Note that values greater than 0.8 are physically impeded by the solubility product of NaNO3 (e.g. ~1400 g/L at
80oC) and technically impeded by the inability of the A0211 vaporizer to take samples with salinities higher than 100 g/L ( of 0.0581). If it is assumed that the O- NO3-/O-H2O relationship remains linear over the range of from 0.0581 to 1, the 17
Oexcess (or 17O value) of the O-NO3-end-member can be calculated from the linear
regressions, when is equal to 1. The corrected 17
O values of ST-01, ST-02, ST-03 and ST-05 calculated by this method are in perfect agreement with the results obtained by the classic TD-IRMS method, as shown in Table 2. The sole exception is for the extremely high 17
From the results described above it can be concluded that: (1) the isotope exchange observed by Kaneko and Paulson49 and measured in NO3- after water equilibration is
also directly observable in the isotopic composition of the equilibrated waters; (2) the system reaches equilibrium conditions after 24h; (3) the 18O-H2Oeq value is
proportional to the isotopic composition of the initial nitrate; and finally, (4) the triple oxygen isotope composition of nitrate is transferred to water, confirming that the O- NO3-/O-H2O isotope equilibration reaction is a mass-dependent process governed by
a θ~0.52.
3.3. Calibration of unknowns, precision, accuracy and inter-lab comparisons
To determine the triple oxygen isotope composition of unknown nitrate samples, we calibrate the 17O, 18O and 17Oexcess values observed in the ST-HCl solution after
equilibration with unknowns, against the change observed when international reference materials with known isotope compositions (USGS-34, USGS-35 and IAEA-NO3) are equilibrated under identical conditions and O-NO3-/O-H2O ratio ().
After equilibration and solution neutralization, the 17O and 18O values of O-H2O
(e.g. the 18O-H2Oeq value) increase when the most isotopically enriched reference
material is used (USGS-35) and decrease when water is equilibrated with the nitrate with the lowest 17O and 18O values (USGS-34) (Figures 3A and B). As expected, equilibration with the large O-MIF USGS-34 nitrate increases the 17Oexcess of O-H2O,
whereas no measurable change in 17Oexcess was observed when equilibrating with
the O-MDF standards. The extent of the change depends on the amount of nitrate in solution () (Figure 3C). The mean reproducibility (1SD) of the duplicated measurements was ±0.02‰ for 17O values, ±0.03‰ for 18O values and 7 per meg for 17Oexcess, in good agreement with the internal reproducibility of the CRDS
instrument. We found that the reproducibility of O-H2Oeq does not depend on ,
There is a strong linear correlation between the 17O-H2Oeq and 18O-H2Oeq values
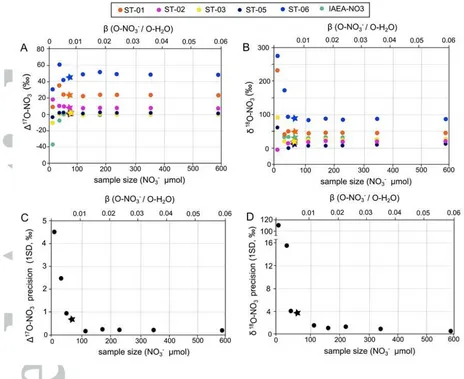
and the known values of the reference materials (i.e. R2> 0.95 when ≥0.007(Figure 3)This linear correlation is used to calculate the 17O and 18O values, and the derived 17O values of the unknowns (referred to as -calibration hereafter). For less than 0.007 (i.e. less than 72 mol of NO3- in 500 L of ST-HCl
solution), the derived 17O and 18O values are inconsistent and highly imprecise. However, when from 0.0117 to 0.058 is used (here 118 to 590 mol of NO3- in 500
L of ST-HCl solution) the isotopic compositions stabilize and 1SD better than 1.7‰
for 18
O values can be obtained, increasing to 0.5‰ when =0.058 (Fig. 4). The 18O values obtained from the IE-CRDS method are thus in good agreement with the results from the TC/EA-IRMS technique, within the analytical uncertainties of both methods (Figure 5).
Likewise, the precision of the 17
O results from our IE-CRDS method improves with sample size. Reproducibility better than 0.7‰ (1SD of duplicated analyses) can be achieved for ≥0.007 and the precision can be improved to 0.2‰ when ≥0.0117 is used, with no significant improvement above this value of (Figure 4). The 17O results of our synthetic nitrates by the IE-CRDS method agree with the 17O values for the classic TD-IRMS technique (Figure 5B and Table 2), except for sample ST-06 for which the IE-CRDS result is ~4‰ higher. Again, this is probably because the 17
O values of ST-06 is far away from the calibration range of both methods, given that the isotopic compositions of the three international reference materials used span 0 to 20.7‰.
In addition to the -calibration, we test an alternative calibration method to determine the 17
O based on the determined 17Oexcess of water after equilibration (referred as
-calibration hereafter) instead of using both the 17O and the 18
O values (Figure 3C). When using this approach, the 17O results match those from the -calibration within
that could occur would affect the 17O and 18O measurements more than the
17
Oexcess, because in the first stages of the evaporation 17Oexcess changes less than
the 17O and 18O values9,11. We suggest that the -calibration can produce better long-term reproducibility for 17
O, avoiding all analytical artefacts.
The accuracy of the IE-CRDS method was evaluated by analyzing the reference material IAEA-NO3 as an unknown against USGS-34 and USGS-35, using different values of . We found that the measured 17O value of IAEA-NO3 differs by less than 0.4‰ for ≥0.007 using the -calibration compared with its accepted value (-0.2‰), with no improvement with further increased sample size (Figure 4A). For the 18
O value in IAEA-NO3, the results obtained by IE-CRDS for ≥0.007 deviate by less than 1‰ on average from the accepted value (25.6‰), and similarly with no improvement with increased sample size (Figure 4B). These deviations in the 17O and 18O values are within the 2SD analytical error of the method, demonstrating that IE-CRDS is accurate for 17
O determination in nitrate.
3.4. Sample size reduction
The general IE-CRDS method described above used 500 L of acid solution that is equilibrated with at least ~118 mol of NO3- (e.g. 10 mg of NaNO3) to achieve a 17O
precision of ±0.2‰. Note that nitrate concentrations in unpolluted freshwater are normally less than 40 mol/L25-26, while concentrations lower than 20 mol/L22 and typical less than 5 mol/L34 can be found in snow and ice. This means that approximately 6 L of freshwater and up to 50 L of melted ice would be required for duplicate 17O analyses of nitrate using the general IE-CRDS method. Considering that sample amount can be a limiting factor for some applications, we modified the IE-CRDS technique to reduce the amount of nitrate needed.
The practical lower volume limit of the O-NO3-/O-H2O equilibration experiments is
sample that may occur when less than ~20L remains in the vial. This modification enables us to decrease the nitrate sample mass by one order of magnitude, to less than 9 mol of NO3- keeping constant (e.g. 0.0091). The experiments using this
protocol of O-NO3-/O-H2O isotope equilibration yielded 17O results in perfect
agreement with those from the general equilibration procedure, with acceptable precision (e.g. 0.5‰ for 17O values and 3‰ for 18O values on average when 9 mol of NO3- is used) and accurate values for the IAEA-NO3 reference material
(calibrated values of 25.1‰ and -0.2‰ for 18O and 17O, respectively).
In practice, ~1 L of unpolluted freshwater (e.g. 20 mol/L of NO3-) would be required
to obtain enough nitrate for the duplicate analyses using the IE-CRDS method for small samples, while over 4L of melt ice/snow (e.g. 5 mol/L of NO3-) would be
needed. These sample volumes are considerably larger than those used by the bacterial denitrification methods22,25,26,34, but similar to those for the TD-IRMS
methods1 (Table 1). 3.5. 17
O values in natural nitrates
The three natural samples analyzed using the IE-CRDS method yielded 17
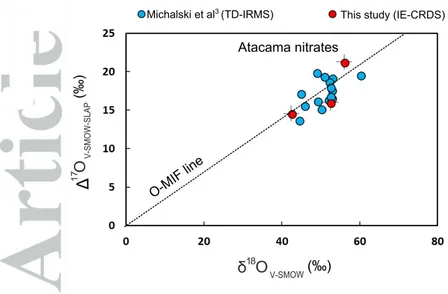
O values ranging from 14.6‰ to 21.3‰, in good agreement with previous results of Atacama nitrates reported by Michalski et al3 (Figure 6). The average precision of the duplicated measurements was better than 1.1‰. Our method is slightly less precise for natural samples than other methods (e.g. the TD-IRMS method32) but the reproducibility is considerably better than that of other laser-based procedures (e.g. the Cd‐azide method using laser spectroscopy42). The precision for 18O values was better than 3.2‰ and was 2.1‰ on average. The 18O values obtained by the IE-CRDS method ranged from 42.4‰ to 55.9‰ and were identical to those obtained by TC/EA-IRMS, within the 2SD errors of the two methods. Our results for the Atacama nitrate samples plot in the same 18O-17O space as the data set reported previously3, suggesting good agreement between the IE-CRDS method and the traditional TD-IRMS method. We suspect that the slightly lower precision for18
due to the presence of trace AgCl or Ag2O in the experiments when using AgNO3 as
the starting material. The presence of impurities (i.e. other salts and organic compounds) may affect the accuracy of the IE-CRDS method for natural samples, resulting in systematically lower 17
O values than expected. This could be improved by using additional stages of purification by column resins or a different purification method.
It is worth mentioning that the NO3- concentrations in soils from dry deserts such as
Atacama can exceed 15% in weight, so small soil samples (of the order of grams) are sufficient to obtain enough nitrate for the IE-CRDS analyses. Much smaller nitrate amounts are found in soils of wet areas, freshwaters25-26 and ice/snow22,34; thus, larger sample amount would be required. This poses the largest disadvantage of the IE-CRDS method compared with other methods that can quantify considerably smaller nitrate amounts (e.g. denitrification-IRMS methods).
4. Conclusions
The IE-CRDS method presented here for determining 17O values in solid NO3-
provides a new application for CRDS technology previously used for triple oxygen analysis of waters. The reproducibility (1SD) can be better than 1.1‰ for 17O value when nitrates from soils or salt mixtures are purified using a resin column and ~120 mol of NO3- is used. This 17O precision is not better than that obtained by other
methods, but may be improved by increasing the number of replicates or sample size when possible. The precision for 18O values is generally better than 3‰, which
can be suitable for some applications. Smaller sample amounts (down to ~9 mol of NO3-) can be used if the volume of acid solution is reduced, producing similar
reproducibility for 18
O and 17O values. This sample size is similar to that used by most TD-IRMS methods, but considerably larger than the NO3- amount required by
The IE-CRDS method requires NO3- purification by resin column and reprecipitation
as AgNO3, representing the most time-consuming and costly step of the procedure.
The TD-IRMS methods require the same sample purification protocol; however, the bacteria dentification-IRMS techniques and the Cd-azide-laser spectroscopy method can use solutions with complex matrices, reducing the preparation time and use of expensive reagents (e.g. Ag2O). Importantly, the accuracy of the IE-CRDS method
for natural samples relies on the purity of AgNO3 obtained after purification; thus,
impurities (i.e. other salts and organic compounds) may result in systematically lower 17
O values than expected. Additional purification protocols may be needed when analyzing samples with complex matrices by the IE-CRDS method.
The sample throughput of the IE-CRDS is ~12 samples/day, limited by the run time of the CRDS analyzer. This is less than the yield of other methods, but the isotopic analysis is highly automated and utilizes a benchtop instrument that is less expensive to purchase, run, and maintain than IRMS instruments.
In summary, the IE-CRDS method is a new analytical tool for isotope laboratories using CRDS analyzers for triple oxygen isotopes analysis in waters and represents an alternative to the traditional IRMS-based methods for measuring 17O values in NO3-. CRDS instruments are becoming increasingly popular because they are
cheaper and more user-friendly than mass spectrometers. However, the characteristics of the samples subject to study (e.g. NO3-concentration) should be
carefully considered when choosing a method for measuring 17
O values in NO3-.
Acknowledgments
References
1. Mauersberger K, Erbacher B, Krankowsky D, Gunther J, Nickel R. Ozone isotope enrichment: isotopomer-specific rate coefficients. Science. 1999;283:370–372.
2. Michalski G, Scott Z, Kabiling M, Thiemens MH. First measurements and modeling of 17
O in atmospheric nitrate. Geophys Res Lett. 2003;30(16):1870.
3. Michalski G, Böhlke JK, Thiemens MH. Long term atmospheric deposition as the
source of nitrate and other salts in the Atacama Desert, Chile: New evidence from mass-independent oxygen isotopic compositions. Geochim Cosmochim Acta. 2004;68:4023-4038.
4. Jenkins KA, Bao H. Multiple oxygen and sulfur isotope compositions of atmospheric sulfate in Baton Rouge, LA, USA: Atmos Environ. 2006;40:4528-4537. 5. Clayton RN, Onuma N, Mayeda TK. A classification of meteorites based on
oxygen isotopes. Earth Plant Sci Lett. 1976;30(1):10-18.
6. Herwartz D, Pack A, Friedrichs B, Bischoff A. Identification of the giant impactor Theia in lunar rocks. Science. 2014;344:1146-1150.
7. Ali A, Jabeen I, Gregory D, Verish R, Banerjee NR. New triple oxygen isotope data of bulk and separated fractions from SNC meteorites: Evidence for mantle homogeneity of Mars. Meteorit Planet Sci. 2016;51(5):981-995.
8. Luz B, Barkan E. Variations of 17O/16O and 18O/16O in meteoric waters. Geochim
Cosmochim Acta. 2010;74:6276-6286.
9. Surma J, Assonov S, Bolourchi MJ, Staubwasser M. Triple oxygen isotope signatures in evaporated water bodies from the Sistan Oasis, Iran. Geophys Res
10. Alexander B, Thiemens MH, Farquhar J, Kaufman AJ, Savarino J, Delmas RJ. East Antarctic ice core sulfur isotope measurements over a complete glacialinterglacial cycle. J Geophys Res. 2003;D24:181–187.
11. Gázquez F, Morellón M, Bauska T, et al. Triple oxygen and hydrogen isotopes of gypsum hydration water for quantitative paleo-humidity reconstruction. Earth Planet
Sci Lett. 2018;481C:177-188.
12. Landais A, Barkan E, Yakir D, Luz B. The triple isotopic composition of oxygen in leaf water. Geochim Cosmochim Acta. 2006;70:4105-4115.
13. Bao H, Lyons JR, Zhou C. Triple oxygen isotope evidence for elevated CO2
levels after a Neoproterozoic glaciation. Nature. 2008;453:504–506.
14. Cao XB, Bao HM. Dynamic model constraints on oxygen-17 depletion in atmospheric O2 after a snowball Earth. Proc Natl Acad Sci. 2013;110:14546-14550.
15. Böhlke JK, Sturchio NC, Gu B, et al. Perchlorate isotope forensics. Anal Chem. 2005;77:7838-7842.
16 Michalski G, Earman S, Dahman C, Hershey RL, Mihevc T. Multiple isotope forensics of nitrate in a wild horse poisoning incident. Forensic Sci Int. 2011;198(1-3):103-109.
17. Bao H, Cao X, Hayles JA. Triple Oxygen Isotopes: Fundamental Relationships and Applications. Annu Rev Earth Planet Sci. 2016;44:463-492.
18. Thiemens MH. History and applications of mass-independent isotope effects. Annu Rev Earth Planet Sci. 2006;34:217-262.
19. Gázquez F, Calaforra JM, Evans NP, Hodell DA. Using stable isotopes (δ17O, δ18O and δD) of gypsum hydration water to ascertain the role of water
20. Levin NE, Raub TD, Dauphas N, Eiler JM. Triple oxygen isotope variations in sedimentary rocks. Geochim Cosmochim Acta. 2014;139:173-189.
21. Passey BH., Hu H, Ji H, et al. Triple oxygen isotopes in biogenic and sedimentary carbonates. Geochim Cosmochim Acta. 2014; 141:1-25.
22. Buffen AM., Hastings MG, Thompson LG, Mosley-Thompson E. Investigating the preservation of nitrate isotopic composition in a tropical ice core from the Quelccaya Ice Cap, Peru, J Geophys Res Atmos. 2014;119:2674-2697.
23. Fang Y, Koba K, Makabe A, et al. Microbial denitrification dominates nitrate losses from forest ecosystems. Proc Natl Acad Sci. 2015;112 (5):1470-1474.
24. Nakagawa F, Suzuki A, Daita S, Ohyama T, Komatsu DD, Tsunogai U. Tracing atmospheric nitrate in groundwater using triple oxygen isotopes: evaluation based on bottled drinking water. Biogeosci. 2013;10:3547-3558.
25. Tsunogai U, Komatsu DD, Daita S, et al. Tracing the fate of atmospheric nitrate deposited onto a forest ecosystem in Eastern Asia using 17
O. Atmos Chem Phys.
2010;10:1809-1820.
26. Tsunogai U, Daita S, Komatsu DD, Nakagawa F, Tanaka A. Quantifying nitrate dynamics in an oligotrophic lake using Δ17
O. Biogeosci. 2011;8:687-702.
27. Barkan E, Luz B. High precision measurements of 17O/16O and 18O/16O ratios in
H2O, Rapid Commun Mass Spectrom. 2015;19:3737–3742.
28. Schoenemann SW, Schauer AJ, Steig EJ. Measurement of SLAP and GISP 17
O
and proposed VSMOW-SLAP normalization for 17O-excess. Rapid Commun Mass
Spec. 2013;27:582–590.
30. Michalski G, Bockheim, JG, Kendall C, Thiemens MH. Isotopic composition of Antarctic Dry Valley nitrate: Implications for NOy sources and cycling in Antarctica.
Geophys Res Lett. 2005;32(13):L13817.
31. Cliff SS, Thiemens MH. The 18O/16O and 17O/16O ratios in atmospheric nitrous oxide: A mass-independent anomaly. Science. 1997;278:1774-1776.
32. Michalski GJ, Savarino JK, Bohlke, Thiemens, M. Determination of the total
oxygen isotopic composition of nitrate and the calibration of a 17O nitrate reference material. Anal Chem. 2002;74:4989-4993.
33. Kaiser JM, Hastings G, Houlton BZ, Röckmann T, Sigman DM. Triple oxygen isotope analysis of nitrate using the denitrifier method and thermal decomposition
of NO. Anal Chem. 2007;79:599-607.
34. Morin S, Savarino J, Frey M, et al. Tracing the Origin and Fate of NOx in the Arctic Atmosphere Using Stable Isotopes in Nitrate. Science. 2008;322:730-732. 35. Kunasek SA, Alexander B, Steig EJ, Hastings MG, Gleason DJ, Jarvis JC.
Measurements and modelling of 17O of nitrate in snowpits from Summit, Greenland,
J Geophys Res. 2008;113:D24302.
36. Schauer AJ, Kunasek SA, Sofen ED, et al. Oxygen isotope exchange with quartz during pyrolysis of silver sulfate and silver nitrate. Rapid Commun Mass Spectrom. 2012;26:2151-2157.
37. Komatsu DD, Ishimura T, Nakagawa F, Tsunogai U. Determination of the
15
N/14N, 17O/16O, and 18O/16O ratios of nitrous oxide by using continuous-flow isotope-ratio mass spectrometry. Rapid Commun Mass Spectrom. 2008;22:1587-1596.
38. McIlvin MR, Altabet MA. Chemical conversion of nitrate and nitrite to nitrous Oxide for nitrogen and oxygen isotopic analysis in freshwater and seawater. Anal
39. Tsunogai U, Kido T, Hirota A, Ohkubo SB, Komatsu DD, Nakagawa F. Sensitive determinations of stable nitrogen isotopic composition of organic nitrogen through chemical conversion into N2O. Rapid Commun Mass Spectrom. 2008;22:345-354.
40. Dyckmans J, Lewicka-Szczebak D, Szwec L, Langel R, Well R. Comparison of methods to determine triple oxygen isotope composition of N. Rapid Commun Mass
Spectrom. 2015;29:1991-1996.
41. Hattori S, Savarino J, Kamezaki K, et al. Automated system measuring triple oxygen and nitrogen isotope ratios in nitrate using the bacterial method and N2O
decomposition. Rapid Commun Mass Spectrom. 2016;30:2635-2644.
42. Wassennar WI, Douence C, Altabet MA, Aggarwal PK. N and O isotope (δ15Nα,
δ15Nβ, δ18O, δ17
O) analyses of dissolved NO3− and NO2− by the Cd‐azide reduction
method and N2O laser spectrometry. Rapid Commun Mass Spectrom.
2018;32(3):184-194.
43. Berman ESF, Levin NE, Landais A, Li SN, Owano T. Measurement of δ18O, δ17
O, and 17O-excess in water by off-axis integrated cavity output spectroscopy and isotope ratio mass spectrometry. Anal Chem. 2013;85:10392-10398.
44. Steig EJ, Gkinis V, Schauer AJ, et al. Calibrated high-precision 17O-excess measurements using laser-current tuned cavity ring-down spectroscopy. Atmos
Meas Tech. 2014;7:2421-2435.
45. Kaseke KF, Wang L, Seely MK. Nonrainfall water origins and formation mechanisms. Sci Adv. 2017;3(3):e1603131.
46. Gázquez F, Mather I, Rolfe J, et al. Simultaneous analysis of 17O/16O, 18O/16O and 2H/1H of gypsum hydration water by cavity ringdown laser spectroscopy. Rapid
Commun Mass Spectrom. 2015;21:1997-2006.
47. Affolter S, Hauselmann AD, Fleitmann D, Hauselmann P, Leuenberger M. Triple isotope (D, 17
inclusions for a Western Central European cave (NW Switzerland). Quat Sci Rev. 2015;127:73-89.
48. Gázquez F, Claire MW. Triple oxygen isotope analysis of nitrate using cavity ringdown laser spectroscopy. Geophysical Research Abstracts. EGU general Assembly. Vienna. 2018.
49. Kaneko M, Paulso SR. The rate of oxygen isotope exchange between nitrate and water. Geochim Cosmochim Acta. 2013;118:148-156.
50. Mook WG. Environmental Isotopes in the Hydrological Cycle: Principles and
Applications, Vol. I: Introduction - Theory, Methods, Review. UNESCO, IAEA, Paris;
2000.
51. Bohlke JK, Mroczkowski SJ, Coplen TB. Oxygen isotopes in nitrate: new reference materials for 18O:17O:16O measurements and observations on nitrate– water equilibration. Rapid Commun Mass Spectrom. 2003;17(16):1835‐1846. 52. Silva SR, Kendall C, Wilkison DH, Ziegler AC, Chang CCY, Avanzino RJ. A new
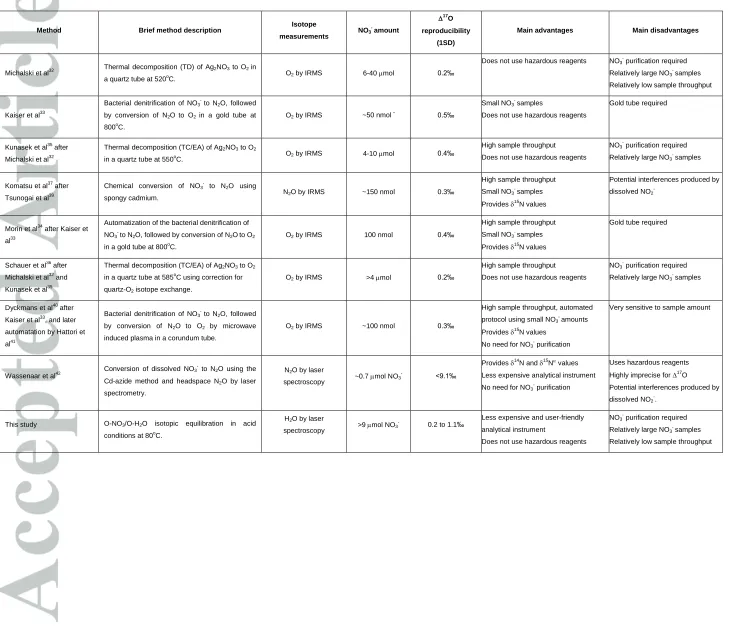
Table 1. Overview of analytical methods for triple oxygen isotopes measurements of nitrates
Method Brief method description Isotope
measurements NO3
- amount 17 O reproducibility (1SD)
Main advantages Main disadvantages
Michalski et al32 Thermal decomposition (TD) of Ag2NO3 to O2 in
a quartz tube at 520o
C. O2 by IRMS 6-40 mol 0.2‰
Does not use hazardous reagents NO3- purification required
Relatively large NO3- samples
Relatively low sample throughput
Kaiser et al33
Bacterial denitrification of NO3- to N2O, followed
by conversion of N2Oto O2 in a gold tube at
800oC.
O2 by IRMS ~50 nmol
-0.5‰
Small NO3- samples
Does not use hazardous reagents
Gold tube required
Kunasek et al35 after
Michalski et al32
Thermal decomposition (TC/EA) of Ag2NO3 to O2
in a quartz tube at 550oC. O2 by IRMS 4-10 mol 0.4‰
High sample throughput
Does not use hazardous reagents NO3
purification required
Relatively large NO3 -
samples
Komatsu et al37 after
Tsunogai et al39
Chemical conversion of NO3 -
to N2O using
spongy cadmium. N2O by IRMS ~150 nmol 0.3‰
High sample throughput
Small NO3- samples
Provides 15
N values
Potential interferences produced by
dissolved NO2
-Morin et al34
after Kaiser et
al33
Automatization of the bacterial denitrification of
NO3- to N2O, followed by conversion of N2Oto O2
in a gold tube at 800o
C.
O2 by IRMS 100 nmol 0.4‰
High sample throughput
Small NO3 -
samples
Provides 15
N values
Gold tube required
Schauer et al36 after
Michalski et al32 and
Kunasek et al35
Thermal decomposition (TC/EA) of Ag2NO3 to O2
in a quartz tube at 585oC using correction for
quartz-O2 isotope exchange.
O2 by IRMS >4mol 0.2‰
High sample throughput
Does not use hazardous reagents NO3
purification required
Relatively large NO3 -
samples
Dyckmans et al40 after
Kaiser et al33, and later
automatation by Hattori et
al41
Bacterial denitrification of NO3 -
to N2O, followed
by conversion of N2O to O2 by microwave
induced plasma in a corundum tube.
O2 by IRMS ~100 nmol 0.3‰
High sample throughput, automated
protocol using small NO3 -
amounts
Provides 15
N values
No need for NO3
purification
Very sensitive to sample amount
Wassenaar et al42
Conversion of dissolved NO3
to N2O using the
Cd‐azide method and headspace N2O by laser
spectrometry.
N2O by laser
spectroscopy ~0.7 mol NO3
- <9.1‰
Provides 14
N and 15
N values
Less expensive analytical instrument
No need for NO3
purification
Uses hazardous reagents
Highly imprecise for 17O Potential interferences produced by
dissolved NO2
-.
This study O-NO3/O-H2O isotopic equilibration in acid
conditions at 80o
C.
H2O by laser
spectroscopy >9 mol NO3
-0.2 to 1.1‰ Less expensive and user-friendly analytical instrument
Does not use hazardous reagents NO3
purification required
Relatively large NO3- samples
Table 2. Calibrated triple oxygen isotope composition of synthetic and natural
nitrates (soils and salt mixtures) analyzed by the IE-CRDS method proposed here and by the classics TD-IRMS and TC/EA-IRMS methods. 17
O has been calculated using Equation 1. The IE-CRDS results are the averaged values of experiments with β≥0.007. [See section 3.3. for definition of -calibration and -calibration.]
#The reproducibility of the 17
O value by the TD-IRMS method is better than 0.2‰.
IE-CRDS TD-IRMS TC-EA
-calibration -calibration
Sample Type n 17O 1SD 18O 1SD 17O 1SD 17O 1SD 17O# 18O 1SD
ST-01 synthetic 14 48.5 1.1 46.1 1.1 23.6 0.6 23.5 0.5 23.2 47.2 0.8
ST-02 synthetic 14 18.6 0.9 20.3 1.7 7.9 0.4 7.8 0.3 7.4 19.0 0.9
ST-03 synthetic 14 13.2 1.8 26.4 2.8 -0.6 0.4 -0.5 0.6 -0.1 26.3 0.7
ST-05 synthetic 14 7.1 0.9 10.3 2.0 1.8 0.6 1.8 0.6 2.4 10.1 0.3
ST-06 synthetic 14 97.0 2.3 86.8 2.0 48.9 1.8 49.4 1.9 45.4 88.4 0.6
IAEA-NO3 synthetic 10 12.8 0.8 25.4 1.1 -0.5 0.4 -0.2 0.3 - - -
AT-12 PONR 90 natural 1 37.5 - 42.4 - 14.6 - 14.9 - - 46.8 0.5
S-2 natural 2 52.1 1.7 55.9 3.2 21.3 0.0 21.1 0.0 - 53.3 0.5
Figure 1. Triple oxygen isotope composition of water (ST-HCl) after O-NO3-/O-H2O
isotope equilibration with β of 0.0232±0.0001, at 80oC and pH=0.1 over 21 days. Experiments were performed using nitrate internal standards ST-01 (initial 18
O-NO3
-=47.2±0.8‰ and 17O=23.2‰) and ST-03 (initial 18O-NO3-=26.3±0.7‰ and 17
[image:30.595.65.502.80.606.2]Figure 2. Triple oxygen isotope anomaly (17Oexcess) of water (ST-HCl) after complete
equilibration with different amount of NO3- (β ranging from 0 to 0.0581) at 80oC and
pH=0.1. The 17
Figure 3. Calibration lines with international reference nitrate (USGS-34, USGS-35 and IAEA-NO3) and different O-NO3-/O-H2O ratios (). The isotope composition of
the ST-HCl solution after equilibration (e.g. 18O-H2Oeq value) with each reference
nitrate has been plotted against the known initial isotopic compositions of the nitrate (e.g. 18
Figure 4. Triple oxygen isotope composition of synthetic nitrates determined by the IE-CRDS method. The 17O values of nitrate were obtained by the -calibration approach (see main text). The 17O and 18O values stabilize for
≥0.007. Precision (1SD of duplicated analyses) improves with sample size (i.e. increased ) to 0.2‰
when ≥ 0.0117 is used, with no significant improvement above this value of Circles represent experiments that used the general O-NO3-/O-H2O isotope
Figure 6. Triple oxygen isotope composition of natural nitrate samples from the
[image:37.595.64.512.74.368.2]