Cirrus Clouds and Multiple Tropopause Events over
Buenos Aires
Susan Gabriela Lakkis1,2*, Mario Lavorato3, Pablo Osvaldo Canziani2,4, Héctor Lacomi3
1
Facultad de Ciencias Agrarias, Pontificia Universidad Católica Argentina, Puetro Madero, Argentina
2
Equipo Interdisciplinario para el Estudio del Cambio Global, Pontificia Universidad Católica Argentina, Puetro Madero, Argentina
3
División Radar Laser, CEILAP (CITEFA – CONICET), Buenos Aires, Argentina
4
Consejo Superior de Investigaciones Científicas y Técnicas (CONICET), Argentina E-mail: [email protected]
Received March 10, 2011; revised April 15, 2011; accepted April 29, 2011
Abstract
Lidar measurements of midlatitude cirrus clouds over Buenos Aires, collected between 2002 and 2003, are compared with multiple tropopauses (MT) retrieved from rawinsonde temperature retrievals. Results derived from the rawinsondes display MT events with an annual cycle which are fewest in March. Comparison with lidar observations shows that cirrus clouds are mostly located closely below the first tropopause, but when cloud top is above the first tropopause, in 25% of cases, the cloud base is not above it, resulting in a cirrus cloud crossing the inter-tropopause region. Compared with the distribution of the whole population of mid-latitude cirrus clouds, cross-tropopause cirrus clouds display a similar geometrical thickness as in-ter-tropopause cirrus clouds.
Keywords: Multitropopause Events, Cirrus Clouds, Lidar
1. Introduction
Cirrus clouds play an important but uncertain role in the Earth’s climate system 1. They cover about 30% of the Earth’s surface at any one time, and play an important role in the Earth’s climate system owing to their capabil-ity of trapping outgoing long-wave (greenhouse effect) and reflecting solar radiation (albedo effect) as well as in the troposphere – stratosphere exchange 2. Due to their ubiquitous nature and higher altitude, the properties of these ice clouds are particularly difficult to characterize. Moreover, the properties of tropical cirrus are distinct from those of the midlatitudes. While the cirrus clouds form at higher altitudes and where temperatures are much lower, is usually termed as “cold cirrus”, its coun-terpart in midlatitudes forming at relatively lower alti-tudes associated with comparatively higher temperatures are called “warm cirrus” 3. Moreover, at small scale, their properties are directly related to the local phenom-ena 4, and therefore it is difficult to ascertain if they can be parameterized with accuracy, even when only considering constrained latitude areas 5. Since cirrus cloud population may be increasing as consequence of
the climate change, improving our understanding of these clouds is an important challenge.
The tropopause is a layer formed due to natural atmos- pheric temperature inversion, which separates the tropo-sphere from stratotropo-sphere. This layer is recognized as a key feature of the atmospheric structure at all latitudes; i.e., polar, mid latitudes and tropics, and an overall un-derstanding both of the upper troposphere - lower strato-sphere (UTLS) and of the stratostrato-sphere-tropostrato-sphere ex-change (STE) is dependent on our ability to quantify and describe tropopause structures and their evolution in time
6-9.
to the high altitude of the cirrus clouds, their formation process as well as their evolution may be related to the upper troposphere-lower stratosphere coupled system; thus, studying UTLS conditions could provide insights on cirrus clouds formation processes and their properties
13. The tropopause temperature could influence the clouds altitude and therefore, the thermodynamic of the atmosphere; hence, the variability in the tropopause could affect the properties of the tropopause cirri, espe-cially those located within the UTLS area. The multiple inversions in the UTLS area represent the tropopause events (MT). Considering that the variability in the ther- modynamic structure of the tropopause could affect the properties of the tropopause cirri, several recent analysis have focused on tropical and midlatitude tropopause cirri properties, bearing in mind that temperature inversion has a constraining effect on cloud altitude 2,14,15.
Recently Nöel and Haeffelin 13, analyzed the cirrus clouds and multiple tropopause events correlation over Sirta by means of the ratio of the distance between the first tropopause and cloud top to the distance between MT. Using this definition about the ratio defined by them, we studied the MT events but over Buenos Aires (EZE; 34.6S, 58.5W) during 2002-2003 and attempts to inves-tigate the possible relationship between MT events and cirrus clouds occurrence.
2. Observations
To analyze the behaviour of the multiple tropopauses re- lated to cirrus clouds, in situ rawinsondes and remote- sensing observations collected between 2002 and 2003 were used for the present analysis. Tropopause levels were retrieved from temperature profiles obtained throu- gh a data set of radiosoundings launched (12 UTC) from the Servicio Meteorológico Nacional (SMN). The simul-taneous study of ice clouds involved finding a data sour- ce suited to the detection and analysis the cirrus clouds.
Various techniques have been developed during the past decades to detect cloud occurrences from passive remote-sensing observations by spaceborne radiometers
16, satellite observations and analysis using passive cloud-imager data, such as cloud-top height (e.g., 17,18) or microphysical properties 19. Nonetheless these techniques can include significant biases due to the ubiq-uitous and semitransparent nature of those clouds. This precludes the use of passive remote-sensing data to study interactions between the thermodynamic structure near the UTLS and cirrus cloud properties. Therefore, other observations are required to obtain a realistic estimate of the ice cloud cover. Due to the capability of the laser beam to point upward into the atmosphere and their high sensitivity to atmospheric layers, lidar system have
be-come the standard tool to analyze the clouds and their time and spatial evolution. Moreover, most modern lidar systems are equipped with the ability to read the polari-zation state of the backscattered light 20, providing insights into the cloud phase 21, geometric and optical properties 2 and microphysical properties 22
The elastic backscatter lidar used for the present work is located in Villa Martelli near Buenos Aires and is based on Nd: YAG laser transmitter (Continuun – Sure-lite II) which delivers around 500 mJ by pulse at 532 nm with a 10 Hz pulse rate, 5 ns pulse duration, with a tilt angle less than 0.6 mrad. A dual telescope receiver is used to handle the large signal dynamic range. An 8.2 cm diameter Cassegrain telescope covers the range between 50 m to 6 km, while a 50 cm diameter Newtonian scope covers from 500 m up to 28 km. The two tele-scopes are pointed at zenith. A field of view less than 1.5 mrad is normally used for both telescopes.To avoid pos-sible, unwanted inclusion of altocumulus, i.e., of water clouds, we restricted the present campaign to clouds with a cloud base height ≥ 6 km, a criterion that coincides with the definition of cirrus clouds given by the Interna-tional Coordination group on Laser Atmospheric Studies (ICLAS): cirrus clouds derived from lidar measurements are layers of particle above 6 km situated in an air mass with temperature of –25˚C or colder which in addition display a large temporal and spatial variability.
3. Multitropopause Events
different processes involved in both hemispheres 7
which are also used to define it, e.g., chemical tropo- pause and dynamical tropopause, it should be noted that when we refer to tropopause, the Extratropical Tropo- pause Layer (ExTL) as explained in Bischoff et al. 25 is considered.
[image:3.595.58.286.284.448.2] [image:3.595.59.286.490.681.2]Analysis of 2000 temperature profiles from the Bue-nos Aires radiosoundings on the 2002-2003 period shows that multiple tropopauses occur in near 30% of cases, with a third tropopause in 10% of cases (not shown) . Additional tropopauses were considered to be negligible.
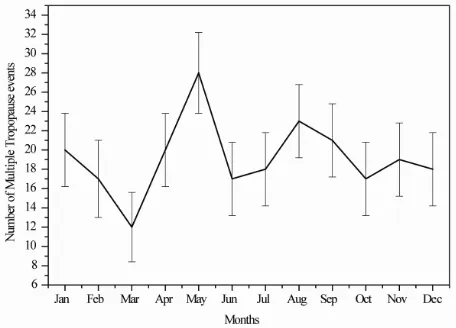
Figure 1 shows the annual cycle of MT occurrences,
averaged over the 2002-2003 period. The vertical bars (one standard deviation) represent the 2002-2003 in- terannual variability, confirming the significance of the annual cycle. The tropopause temperature and pressure
Figure 1. Annual frequencies of multiple tropopauses over Buenos Aires, averaged on 2002-2003 period.
Figure 2. Annual evolution of the mean tropopause alti-tudes and the mean inter-tropopause thickness (thick line) during the 2002-2003 period.
are known to exhibit quasi-biennial oscillation and long- term fluctuations 26 than can affect both the annual cycle and the interannual variability. The annual MT occurrence cycle begins with high occurrences close to 20% in January, followed by the first minimum in March (13%). The first maximum is reached during May with percentages near 29%, followed by a second maximum reached during August (23%). High MT occurrences in April-June and August-September coincide with the higher occurrences of fronts or jets. These values are consistent with results from Bischoff et al., (2007) who found, based on 9000 rawinsonde data, occurrences over Buenos Aires (EZE) for double tropopause close to 25% in March and maximum occurrence (≈ 42%) in late win-ter and early spring.
Figure 2 shows the annual cycle of tropopause
alti-tudes and the mean intertropopause thickness (IT) con-sidering only the first and second tropopauses of the data. The IT can be defined as the distance between the lowest and higher tropopauses. The minimum and maximum altitudes are reached in February-September and June- October respectively.
The monthly mean altitude of the first tropopause var-ies 2.4 km between February-October (from 11.4 to 13.8), while that of the second tropopause varies almost 2.6 km (from 18.7 to 16.1 km). The IT annual cycle displays a minimum in October (2.2 km) and two maximum be-tween April-August. These maximums may be correlated with the increase in MT frequency over the same period (Figure 1), but with its first maximum centered in July
instead June. The averaged IT thickness spreads from 2.8 km to 6.4 km.
4. Cirrus Clouds and Multiple Tropopauses
The distribution of cirrus occurrence with cloud tempera- ture for the dataset under study (80 cases) shows that cir- ri population is constrained between –75˚C and –55˚C, with cirrus sightings increasing in the temperature range from –70˚C to –65˚C. Almost the 75% of these clouds were observed with the relative humidity close to 80% in average.
de-tected can reveal correlations between the two phenom-ena.
This study focuses on the relationship between the tropopause(s) and cirrus clouds. In order to avoid possi-ble, unwanted inclusion of altocumulus, i.e., of water clouds, we restricted the present analysis to clouds with a cloud base height ≥ 7 km, which implies an amount of 41.600 lidar profiles for 2002-2003 period.
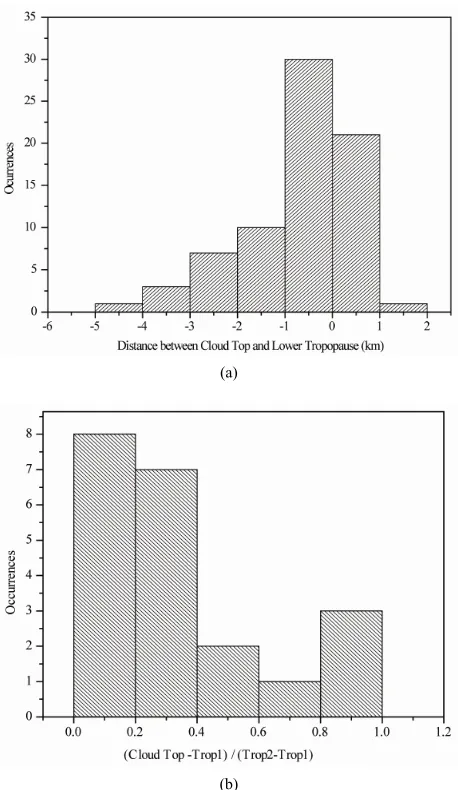
The distance between cloud-top altitudes and the low-est tropopause is shown in Figure 3(a) for all clouds
with top altitudes above 7 km. Positive (negative) values indicate cloud-top altitudes above (below) the first tro-popause. Clearly, most cloud-top altitudes are located below but very close to the first tropopause; that is, cirrus clouds are very likely stuck right under the tropopause and thus, these tropopause cirrus can be viewed as tro-popause tracers as was reported by Lakkis et al. 2. Clouds with tops above the first tropopause occur in 25% of the observations, out of which almost 90% occur in MT events; therefore for these cases, a possible relation-ship between tops and second tropopause disserves to be analyzed. In order to evaluate this correlation and how much of this region is filled by clouds, we use the ratio of the distance between cloud top and first tropopause to the distance between the first and second tropopauses, proposed for Noël and Haefelin 12. This ratio is 0 for clouds’ tops close to the first tropopause and 1 for those close to the second. Figure 3(b) shows the distribution
positively skewed of the ratio. In the 75% of the cases the ratio is below 0.4, meaning that cloud tops occupy a limited region between the first and second tropopauses, with their top in the lower 40% of the intertropopause zone, while ratio is above 0.6 in 15% of the cases which means that these cloud tops span the entire region. No cirrus cloud was detected with a top altitude above the second tropopause; thus it is possible to infer that these clouds live in an unstable temperature profile which con-tributes a fraction of them to expand vertically until they reach the second tropopause.
Figure 4 shows the distributions of cloud-base altitude
for those cloud tops that extend above the first tro-popause. As shown in the plot, the distribution appears negatively skewed and cirrus clouds have most frequent- ly their base altitude between 4 and 1 km below the first tropopause, with a maximum centered close to 2, 5 km below the lower tropopause. By considering Figures 4
and 3(a), it is important to note that all the cirri presented
are located close to the first tropopause and below the second tropopause; i.e., cirrus that cross the intertro-popause zone, but there are no clouds entirely contained in the intertropopause region. During the whole time of each observation (up to 9 hours), the cloud remains in- side the limits defined by the first and second tropopau-
(a)
(b)
Figure 3. (a) Distribution of distance between the first tro-popause and cross-trotro-popause cirrus cloud tops, (b) ratio of the cloud top to first tropopause distance on the distance between first and second tropopauses.
ses; therefore the second tropopause seems to act as a cloud-top ceiling. Following the criteria adopted by Noël and Haeffelin 12 and considering clod top and base values it is possible to classify cirrus clouds in two groups defined by the location of their boundaries with respect to the first and second tropopause: the first group with cloud top altitudes below the first tropopause (75%) as tropospheric cirrus, while the second one, with cloud top altitude within the intertropopause, as cross-cirrus (25%).
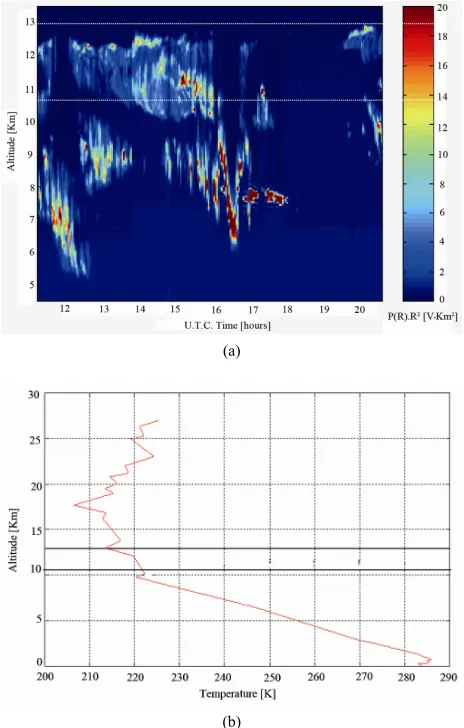
As an example of the dataset analyzed, a cloud ob-served on 27 May 2003 is shown in Figure 5(a). The
[image:4.595.309.538.76.471.2]Figure 4. Distribution of distance between cloud base and the first tropopause.
(a)
(b)
Figure 5. (a) Backscattering coefficients observed by the lidar on 27 May 2003 as a function of time and altitude, (b) Temperature profile from radiosoundings on 27 May 2003. On both figures, the first two tropopauses are indicated using solid lines.
(Figure 5(b)).
Finally, we study the geometrical thickness for the cirrus with top above the first tropopause. The distribu-tion of geometrical thickness for cross cirrus is presented in Figure 6. The measured values of geometrical
thick-ness, conforming a negatively skewed distribution of thi- ck cirrus, are found to extend over a range of 1 to 5 km with peak occurrence (65%) confined to a narrow range of 1 to 3 km. Nonetheless these values are not different of those derived from tropospheric cirrus clouds. Figure 7 shows geometrical thickness for all the dataset under
[image:5.595.309.539.292.464.2]analysis. Therefore, it is not possible to highlight specific properties of the cross cirrus compared with the rest of the cirrus population and to establish relationships be-tween thickness and multiple tropopause events could not be argued. However this thickness value confirms them (cross and troposheric cirrus) as thick cirrus, con-
[image:5.595.56.288.297.661.2]Figure 6. Distribution of cloud geometrical thickness for observations during 2002-2003 for cirrus clouds between the two tropopauses.
[image:5.595.310.537.519.690.2]sidering the standard lidar terminology and it appears the conclusion reached in Lakkis et al.2 still hold true for the extended dataset.
5. Conclusions
In this study multitropopause events related with cirrus clouds were analyzed. Using lidar technique it was pos-sible to compare cirrus cloud-top and bases altitudes.
Regarding the MT events, the annual cycle of MT shows that high MT occurrence appears in April-June and August-September in coincidence with the higher occurrences of fronts or jets. The IT annual cycle picture displays a minimum in October and two maximum be-tween April-August. These maximums may be correlated with the increase in MT frequency over the same period (Figure 1). The averaged IT thickness spreads from 2.8
km to 6.4 km.
The study of cloud-top and base altitude respect to tropopause altitude reveals that most cirrus clouds are contained below the lower tropopause, but representative part of them crosses the tropopauses. There were not detected cirrus clouds totally contained between the first and second tropopause. The frequency of occurrence of the cirrus clouds increases with decreasing distance be-tween cloud top and the first tropopause as Figure 3(a)
shows. With the same trend, clouds are more frequent as cloud bases get closer to the tropopause; nevertheless, the maximum occurrence was found 3 - 2 km below the tropopause (Figure 4). These results enhance the
conclu-sions about cirrus as tropopause tracers highlighted in Lakkis et al.2.
The geometrical thickness values, both the tropo-spheric and cross cirrus, are found to extend over a range of 1 to 5 km with peak occurrence confined to a narrow range of 1 to 3 km, therefore it is not possible to differ-entiate different characteristics for each group of clouds.
6. References
[1] S. Solomon, D. Qin, M. Manning, R. B. Alley, et al., “Contribution of Working Group I to the Fourth Assess-ment Report of the IntergovernAssess-mental Panel on Climate Change, 2007,” Cambridge University Press, Cambridge, 2007.
[2] S. G. Lakkis, M. Lavorato and P. Canziani, “Monitoring Cirrus Clouds with LIDAR in the Southern Hemisphere: A Local Study over Buenos Aires. 1. Tropopause heights,” Atmospheric Research, Vol. 92, No. 1, 2009, pp. 18-26. doi:10.1016/j.atmosres.2008.08.003
[3] S. V. Sunilkumar and K. Parameswaran, “Temperature Dependence of Tropical Cirrus Properties and Radiative Effects,” Journal of Geophysical Research, Vol. 110, No. 13, 2005, pp. 1-14.doi:10.1029/2004JD005426.
[4] W. Cantrell and A. Heymsfield, “Production of Ice in Tropospheric Clouds: A Review,” Bulletin of the Ameri-can Meteorological Society, Vol. 62, No. 7, 2005, pp. 2352-2372.doi:10.1175/BAMS-86-6-795
[5] A. J. Heymsfield and L. M. Miloshevich, “Parameteriza-tions for the Cross-Sectional Area and Extinction of Cir-rus and Stratiform Ice Cloud Particles,” Journal of At-mospheric Sciences, Vol. 60, 2003, pp. 936-956.
doi:10.1175/1520-0469(2003)060<0936:PFTCSA>2.0.C O;2
[6] J. R. Holton, P. H. Haynes, M. E. McIntyre, A. R. Doug-lass, R. B. Rood and L. Pfister, “Stratosphere Tropo-sphere Exchange,” Reviews of Geophysics, Vol. 33, No. 4, 1995, pp. 403-439. doi:10.1029/95RG02097
[7] T. G. Shepherd, “Issues in Stratospheric-Tropospheric Coupling,”Journal of the Meteorological Society of Ja-pan, Vol. 80, No. 4B, 2002, pp. 769-792.
doi:10.2151/jmsj.80.769
[8] A. Stohl, P. Bonasoni, P. Cristofanelli, et al., “Strato-sphere-Troposphere Exchange: A Review, and What We Have Learned from STACCATO,” Journal of Geophysi-cal Research, Vol. 108, No. 2, 2003, pp. 8516-8531.
doi:10.1029/2002JD002490
[9] D. J. Seidel and J. W. Randel, “Variability and Trends in the Global Tropopause Estimated from Radiosonde Data,” Journal of Geophysical Research, Vol. 111, 2006.
doi:10.1029/2006JD007363
[10] S. G. Lakkis and P.O. Canziani, “A Comparative Analy-sis of the Temperature Behavior and Multiple Tropopause Events Derived from GPS, Radiosonde and Reanalysis Datasets over Argentina, as an Example of Southern Mid Latitudes,” Revista de Climatología, Vol. 9, 2009, pp. 1-14.
[11] K. P. Hoinka, “Statistics of the Global Tropopause Pres-sure,” Monthly Weather Review, Vol. 126, 1998, pp. 3303-3325.
doi:10.1175/1520-0493(1998)126<3303:SOTGTP>2.0.C O;2
[12] G. C. Reid and K. S. Gage, “A relationship Between the Height of the Tropical Tropopause and the Global Angu-lar Gage Momentum of the Atmosphere,” Geophysical Research Letters, Vol. 11, No. 9, 1984, pp. 840-842.
doi:10.1029/GL011i009p00840
[13] V. Noël and M. Haeffelin “Midlatitude Cirrus Clouds and Multiple Tropopauses from a 2002-2006 Climatology over the SIRTA Observatory,” Journal of Geophysical Research, Vol. 112, No. D13, 2007.
doi:10.1029/2006JD007753
[14] McFarquhar, M. Greg, J. Andrew, et al., “Thin and Sub-visual Tropopause Tropical Cirrus: Observations and Ra-diative Impacts,” Journal of Atmospheric Sciences, Vol. 57, No. 12, 2000, pp. 1841-1853.
doi:10.1175/1520-0469(2000)057<1841:TASTTC>2.0.C O;2
[15] T. J. Garrett, B. C. Navarro, C. H. Twohy, et al., “Evolu-tion of a Florida Cirrus Anvil,” Journal of Atmospheric Sciences, Vol. 62, No. 7, 2005, pp. 2352-2372.
doi:10.1175/JAS3495.1
for ISCCP,” Journal of Climate, Vol. 6, No .12, 1993, pp. 2341-2369.
doi:10.1175/1520-0442(1993)006<2341:CDUSMO>2.0. CO;2
[17] N. Naud, M. Haeffelin, P. Muller, Y. Morille and A. De-laval, “Assessment of MISR and MODIS Cloud Top Heights through Comparison with a Back-Scattering Li-dar at SIRTA,” Geophysical Research Letters, Vol. 31, 2004.doi:10.1029/2003GL018976
[18] J.-F. Daloze and M. Haeffelin, “Validation of SAFNWC/MSG Cloud Top Height Using Ground-Based Lidar and Radar Measurements,” Visiting Scientist Re-port, CMS Lannion, 2005.
[19] M. H. Chiriaco, Chepfer, V. Noël, A. Delaval, M. Haef-felin, P. Dubuisson and P. Yang, “Improving Retrievals of Cirrus Cloud Particle Size Coupling Lidar and Three-Channel Radiometric Techniques,” Monthly Weather Review, Vol. 132, 2004, pp. 1684-1700.
doi:10.1175/1520-0493(2004)132<1684:IROCCP>2.0.C O;2
[20] K. Sassen, “The Polarization Lidar Technique for Cloud Research: A Review and Current Assessment,” Bulletin of the American Meteorological Society, Vol. 72, No. 12, pp. 1848-866.
doi:10.1175/1520-0477(1991)072<1848:TPLTFC>2.0.C O;2
[21] Z. Wang and K. Sassen, “Cloud Type and Macrophysical Property Retrieval Using Multiple Remote Sensors,” Journal of Applied Meteorology, Vol. 40, No. 10, 2001, pp. 1665-1682.
doi:10.1175/1520-0450(2001)040<1665:CTAMPR>2.0. CO;2
[22] V. Noël, H. Chepfer, M. Haeffelin and Y.Morille, “Clas-sification of Ice Crystal Shapes in Midlatitude Ice Clouds from Three Years of Lidar Observations over the SIRTA Observatory,” Journal of the Atmospheric Sciences, Vol. 63, No. 11, 2006, pp. 2978-2991.
[23] WMO, “Definition of the Tropopause,” WMO Bulletin, No. 6, 1957, p. 136.
[24] M. A. Shapiro, “Turbulent Mixing within Tropopause Folds as a Mechanism for the Exchange of Chemical Contituents between the Stratosphere and Troposphere,” Journal of the Atmospheric Sciences, Vol. 37, No. 5, 1980, pp. 994-1004.
doi:10.1175/1520-0469(1980)037<0994:TMWTFA>2.0. CO;2
[25] S. A. Bischoff, P. O. Canziani and A. E. Yuchechen, “The Tropopause at Southern Extra Tropical Latitudes: Argentina Operational Rawinsonde Climatology,” Inter-national Journal of Climatology, Vol. 27, No. 2, 2007, pp. 189-209. doi:10.1002/joc.1385
[26] J. K. Angell and J. Korshover, “Quasi-biennial and Long-Term Fluctuations in Tropopause Pressure and Temperature, and the Relation to Stratospheric Water Vapor Content,” Monthly Weather Review, Vol. 102, No. 1, 1974, pp. 29-34.
doi:10.1175/1520-0493(1974)102<0029:QBALTF>2.0.C O;2
[27] A. Protat, M. Haeffelin, A. Armstrong, Y. Morille, J. Pelon, J. Delanoë and D. Bouniol, “Impact of Conditional Sampling and Instrumental Limitations on the Statistics of Cloud Properties Derived from Cloud Radar and Lidar at SIRTA,” Geophysical Research Letters, Vol. 33, 2006.