1 1
Field experiments with wild primates reveal no consistent dominance-based bias in
2social learning
34 5
Jennifer Botting1,2, Andrew Whiten1,2*,Mathilde Grampp2,3 & Erica van de Waal2,4,5 6
7
1School of Psychology & Neuroscience, University of St Andrews 8
2Inkawu Vervet Project, KwaZulu-Natal, South Africa 9
3Faculté des Sciences de la Vie,University of Strasbourg 10
4Anthropological Institute and Museum, University of Zurich 11
5Department of Ecology & Evolution, University of Lausanne 12
13 14
*Corresponding author, [email protected], School of Psychology & Neuroscience, 15
Westburn Lane, St Andrews, Fife, United Kingdom. 16
17
Key Words: Dominance-based bias, field experiment, social attention, social learning biases, 18
vervet monkey. 19
20
Abstract 21
22
Directed social learning suggests that information flows through social groups in a non-23
random way, with individuals biased to obtain information from certain conspecifics. A bias to 24
copy the behaviour of more dominant individuals has been demonstrated in captive chimpanzees, 25
but has yet to be studied in any wild animal population. To test for this bias using a field 26
experiment, one dominant and one low-ranking female in each of three groups of wild vervet 27
2 demonstrations from each model, fruits that could be opened either way were presented to each 29
group and all openings were recorded. Overall, the dominant females were not attended to more 30
than low-ranking females during the demonstrations, nor were their methods preferentially used 31
in the test phase. We conclude that these monkeys show no overall bias to copy high-ranking 32
models that would lead to a high-ranking model’s behaviour becoming more prevalent in the 33
group than a behaviour demonstrated by a low-ranking model. However by contrast, there were 34
significant effects of observer monkeys’ rank and sex upon the likelihood they would match the 35
dominant model. Additionally we found that the dominant models were more likely to stick to 36
their initially learned method than were low-ranking models. 37
38
Introduction 39
40
Research has increasingly revealed evidence for social learning abilities in a variety of 41
animal taxa. Social learning can be highly beneficial, allowing an animal to avoid the costs 42
associated with asocial learning (Laland, 2004). However, maladaptive information may also be 43
transmitted (Laland & Williams, 1998) and therefore animals could benefit from copying only 44
the most useful information. One way to obtain the best information may be to selectively copy 45
certain individuals based upon individual characteristics, such as age, sex or past successes. It is 46
also likely that animals may exhibit biased social learning based upon the social organisation of a 47
group (directed social learning, Coussi-Korbel & Fragaszy, 1995); greater time spent in 48
proximity to certain individuals may increase the likelihood that they will become models for 49
social learning. Research with a variety of nonhuman animals has yielded evidence for a range of 50
3 Laland, 2009; Choleris, Guo, Liu, Mainardi, & Valsecchi, 1997), sex (Katz, & Lachlan, 2003; 52
van de Waal, Renevey, Favre, & Bshary, 2010), position in social network (Claidière, Messer, 53
Hoppitt & Whiten, 2013; Allen, Weinrich, Hoppitt, & Rendell, 2013) and kinship (van de Waal, 54
Bshary & Whiten, 2014). Findings of multiple social learning biases in the same species (Kendal 55
et al., 2015) also suggest that biases may work in concert. 56
In addition to the aforementioned biases, it has been proposed that copying successful 57
individuals may be an adaptive strategy (Boyd & Richerson, 1985; Henrich & Gil-White, 2001) 58
and that social rank may be used as a proxy for this in nonhuman animals (Laland, 2004, 59
although see Henrich & Gil-White, 2001). However few empirical studies have examined this 60
issue. Dindo and colleagues (2011) found no evidence of dominance-based biases in social 61
learning or social attention in captive tufted capuchin monkeys during an extractive foraging 62
task. By contrast, two studies with captive chimpanzees found that chimpanzees preferred to 63
copy a higher rather than lower ranked individual using tasks requiring both object manipulation 64
(Kendal et al., 2015, although see Watson et al. 2017) and token exchange (Horner, Proctor, 65
Bonnie, Whiten & de Waal, 2010), although dominance in the latter was confounded with age 66
and past success on tasks. On the basis of these findings with chimpanzees, it has been 67
suggested that such a bias towards copying dominant individuals could, in a similar way to 68
conformist transmission (Boyd & Richerson, 1985), constrain intra-group variation and enhance 69
the between-group variation found in wild chimpanzees (Kendal et al., 2015). However, such a 70
bias has not yet been assessed in wild populations. 71
The aim of the current study was, accordingly, to examine whether a dominance-based 72
bias exists in a wild population of primates. Vervet monkeys (Chlorocebus aethiops pygerythrus) 73
4 Seyfarth, 1990) and have previously been shown to learn socially in experimental contexts (van 75
de Waal et al., 2010; van de Waal, Borgeaud & Whiten, 2013; van de Waal, Claidière & Whiten, 76
2015). Whilst a previous study revealed a bias for individuals to preferentially attend to and copy 77
female, rather than male, conspecifics (van de Waal et al., 2010), both sexes of models used in 78
that study were dominant and so the effect of demonstrator rank upon social learning remains to 79
be tested in this species. 80
To provide an experimental test for a bias to copy high-ranking, over low-ranking, 81
models in a wild primate, we trained two models of differing rank within each of three groups to 82
use alternative methods to open an ‘artificial fruit’ to gain a reward inside and gave both models 83
the opportunity to demonstrate their method to their groupmates. We investigated whether a 84
certain rank of model was attended to more in an experimental setting and whether the method 85
they displayed was preferred over the other in an extractive foraging task. 86
87
Material & methods 88
Study site and participants 89
The research was conducted at the Inkawu Vervet Project, located in the Mawana Game 90
Reserve in KwaZulu-Natal, South Africa (S 28° 00; E 031° 12). Experiments were conducted 91
between May and December 2015 with five groups of vervet monkeys at the field site. Four were 92
assigned to experimental conditions: Ankhase (AK), Baie Dankie (BD), Noha (NH) and Kubu 93
(KB) and one acted as a control group (Lemon Tree (LT)). A total of 100 monkeys were 94
exposed to the demonstration phase in the three two-model groups, whilst 42 monkeys 95
participated in the test phase of the experiment from all five groups. 96
5 Two models of differing rank were selected for each of the three ‘two-model’ groups 98
(AK, NH and BD, see Table 1) and trained to demonstrate alternative methods for opening a 99
baited artificial fruit. Model rank was determined by the outcome of dyadic conflicts recorded 100
ad libitum and through regular observations of order to access of food provided to the group by 101
researchers since the habituation of the groups (between two and five years for each group). 102
During this time the female hierarchies have remained highly stable, as is usual for vervet 103
monkeys (Cheney & Seyfarth, 1990). Models defined as ‘dominant’ were ranked #1 of females 104
in their group, whilst ‘low rank’ models were taken from the bottom half of the female hierarchy 105
(positions 6 of 10 (AK), 11 of 12 (BD) and 7 of 11 (NH)). All researchers collecting data at IVP 106
were tested on monkey identification and interobserver reliability prior to data collection. 107
Individual rank for all group members was calculated using the EloRating package in R 108
(Neumann et al., 2011). In the control group (LT), no models were trained. In the fourth 109
experimental group, KB, only a low-ranking model (a sub-adult female model who had her first 110
offspring early on in the test and was then ranked 5 of 8 females) was trained to test the effects of 111
a single model. Demonstrations and test sessions were conducted by JB and MG, with the 112
assistance of one or more trained field assistants, comprising volunteers and students at IVP. 113
Apparatus 114
To create two alternative behaviours in the two models, an ‘artificial fruit’, a 115
polycarbonate box designed to mimic the characteristics of natural items that need to be opened 116
to gain the edible fraction inside (hereafter simply ‘box’) was used. Access to the food reward 117
inside required the opening of a small door on one side. The sides and top were painted black 118
with only the door left transparent, to funnel the monkeys’ attention to this part of the box. The 119
base of the box tilted it back at a roughly 30 degree angle and two metal hooks allowed the box 120
6 One of two methods could open the door. First, the door was attached via a bolt in its top 122
centre, allowing it to be pivoted around this bolt (‘Pivot’). Second, the door contained a smaller 123
section which was attached with hinges at the top, so this could be pushed inwards and upwards 124
as an alternative means of opening (‘Push’) (see Figure A1). Magnets held both door elements 125
in place, so they could not be accidentally opened. A manual lock prevented one method of 126
opening during training. Only one non-model attempted and failed to open the box during the 127
demonstration phase and this individual later successfully opened the box in the test phase. All 128
training, demonstration and tests were recorded using handheld Panasonic HD (HC-X920M) 129
video cameras. 130
Training 131
The dominant female and a mid- to low-ranking female (hereafter low-ranking) from 132
each of groups AK, NH and BD, and one low-ranking female from KB, were trained as 133
demonstrators. Some females had been trained to approach boxes with patterned covers for a 134
food reward during a previous study at the site (Borgeaud & Bshary, 2015). In the present study 135
these covers were placed on top of the boxes during the training and demonstration phase to 136
encourage the target females to approach the boxes; however not all models had been trained on 137
a cover, so covers were not used with Riss (low-ranking model, BD) and Ness (low-ranking 138
model, KB). 139
Training was conducted over a period of 7-9 days on an opportunistic basis. Both models 140
were usually trained on each day of training, in no particular order. The food reward used for 141
each opening was a small piece of apple. The criterion for demonstration, which all models 142
reached, was the successful opening of the box 10 times during two consecutive sessions, 143
totalling 20 successful openings. The training was opportunistically conducted when there were 144
few other monkeys in the area to minimise the observations of the models being trained. 145
Demonstration and social attention 146
One hundred demonstrations by each model were engineered on an opportunistic basis 147
over 6-8 days, with no more than 20 demonstrations conducted per model, per day. 148
Demonstrations were completed with both models each day in no particular order. A session 149
7 away. A successful demonstration consisted of the model successfully opening the box and 151
obtaining the food with at least one other individual within 10 metres and with a clear line of 152
sight. All individuals judged by two experimenters as either within 5 metres or 10 metres and as 153
either attending or not attending to the box during the opening, based on head orientation, were 154
identified and called aloud for the video record. For the analyses, only individuals within five 155
metres of the box and attending were coded as ‘observers’. Following demonstrations, the box 156
was removed. 157
Test protocol 158
Ten test sessions were conducted following the demonstration phase. The control group, 159
LT, saw no demonstrations and five test sessions were conducted due to time constraints. The 160
groups were located shortly after sunrise at their sleeping site and food calls were used, as with 161
past experiments which involved food with this study population, to alert the monkeys to the 162
presence of available food from the experiments. In the first test session, five unlocked boxes 163
were presented to the group (for test sessions 2-10, six boxes were used). Boxes were secured to 164
the ground in two rows perpendicular to an imagined line between the experimenters and at least 165
five metres apart. The boxes were placed with the doors facing outwards and less than 5 metres 166
between the boxes in the rows. At each interaction with the box by any monkey, the monkey was 167
identified and all individuals within 10 metres were identified by commentary recorded onto the 168
cameras. At each opening, the method of opening was identified in this way, as well as the 169
success of the opening. Once all the boxes were emptied, they were rebaited (the experimenter’s 170
bodies blocked most visual access during rebaiting and if the door needed to be re-opened to 171
rebait, it was done so using the method in which the door was most recently opened). An upper 172
limit of 30 pieces of apple per day was set for each monkey. The boxes were continuously 173
rebaited until the group moved away or an individual attained 30 pieces. If the latter occurred, no 174
rebaits occurred until that individual had moved out of sight. The test session ended when all 175
monkeys had moved away from the boxes and out of sight. 176
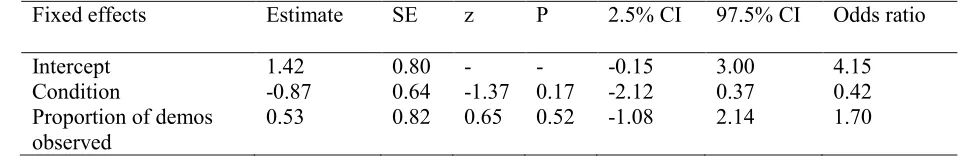
Statistical analyses 177
Analyses were performed using the statistical software ‘R’ version 1.0.136 (R Core 178
8 analyse the majority of the data using the package ‘lme4’ (Bates, Maechler, Bolker & Walker, 180
2014). To analyse whether dominant or low-ranking models received differing levels of social 181
attention, the total number of observations made of each model during demonstration were 182
compared using a Wilcoxon test. GLMMs with Poisson error structure were fitted with the 183
outcome variables of “number of demonstrations seen of each model”. Observer age (adult or 184
juvenile), sex (male or female), rank (a continuous score between 0 and 1) and kinship to the 185
model (a categorical variable with three levels; “kin of dominant model”, “kin of low-ranking 186
model” or “non-kin”) were added as fixed effects. There were too few data points to use ID 187
nested within group as random factors and thus ID was entered as a random intercept into the 188
models as it led to a better fitting model than group (as judged by a lower AIC score which 189
represents the best fitting and simplest model, Akaike, 1974). To analyse whether groups 190
preferentially displayed the method of their dominant model, Fisher’s exact tests were used to 191
compare the first method used by each individual from the D-push and D-pivot conditions. A 192
series of GLMMs were then used to analyse whether fixed effects such as age, sex, rank, kinship 193
and proportion of dominant to low-ranking demonstrations observed had effects upon 194
participation and the method used by individuals. For all analyses with GLMMs, the full models 195
are reported containing all fixed effects and only interactions that had a significant effect. Full-196
null model comparisons are reported using the package ‘MuMIn’ (Burnham & Anderson, 2002). 197
Results 198
Social attention during demonstrations 199
A total of 100 monkeys from the three two-model groups were recorded to observe at least one 200
demonstration from a model during the test phase (out of a potential 116 group members, 201
excluding infants). The dominant models’ demonstrations did not receive significantly more 202
observations overall than the low-ranking models’ demonstrations (Wilcoxon Signed-Rank Test, 203
mean observations of dominant female = 5.0; mean observations of low-ranking female = 4.82, 204
W = 5028, P = 0.95). When the GLMM was fitted with the outcome variable as the number of 205
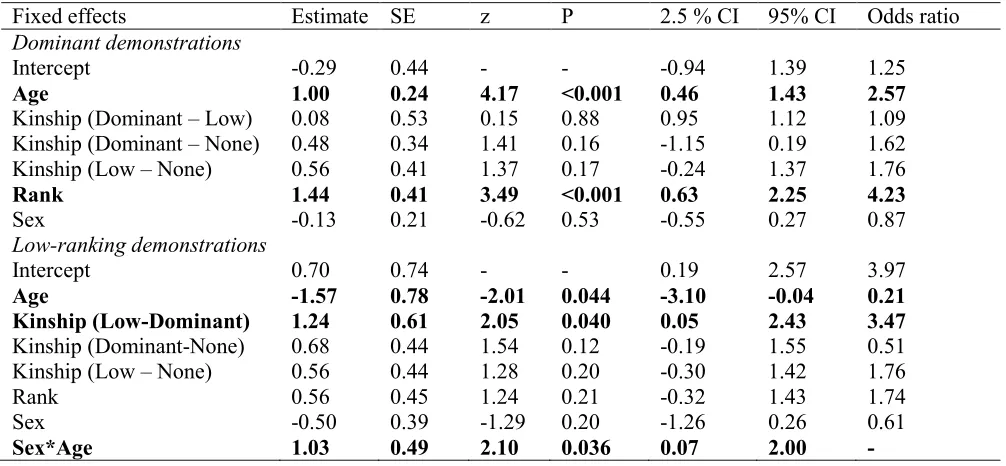
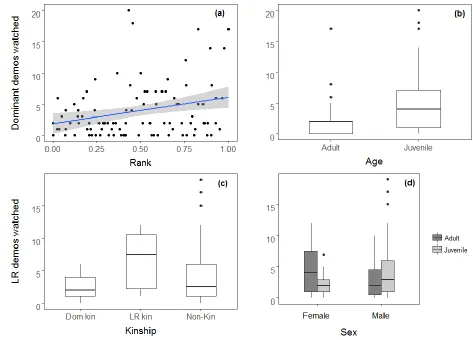
9 rank had a significant positive relationship with demonstrations viewed and juveniles observed 207
more demonstrations than adults (see Table 2, Figure 1). When juveniles were analysed 208
separately, they did not watch significantly more of the dominant models’ demonstrations than 209
the low-ranking models’ demonstrations (Wilcoxon Signed-Rank Test, mean observations of 210
dominant models = 5.69, means observations of low ranking models = 3.52, W = 2466, P = 211
0.19). When the outcome variable was the number of low-ranking demonstrations viewed, 212
kinship was a significant predictor, with kin of the low-ranking model viewing significantly 213
more of her demonstrations than kin of the dominant model (but not more than non-kin, see 214
Table 2, Figure 1c). We also found a significant interaction between sex and age, as shown in 215
Figure 1d. 216
Model Behaviour 217
Prior to the test phase, the models had all successfully used their assigned methods at 218
least 120 times during the training and demonstration phase combined. All three dominant 219
females maintained a significant preference for their trained method (Gaga, N=97, P<0.001, 95% 220
CI [0.60, 0.79], Gene, N=83, P<0.001, 95% CI [0.92, 1.00], Ouli, N=182, P=0.001, 95% CI 221
[0.55, 0.69]), whereas the low-ranking models in the two-model groups did not maintain a 222
preference for their trained method and one low-ranking model showed a significant preference 223
for her non-trained method (Nkos, N=132, P<0.001, 95% CI [0.65, 0.81]). The low-ranking 224
model in BD opened the box only once, using her trained method, so a preference could not be 225
calculated. The low-ranking model in KB, where there was no dominant model demonstrating 226
another action, maintained a significant preference for her trained method (Ness, N=260, 227
10 Whether the models used their trained or untrained method at each opening was entered into a 229
GLMM with a binomial error structure as the outcome variable with the fixed effect of model 230
rank, group and the observations they had made of the other model in their group during the 231
demonstration phase. Individual trial number was nested within ID and entered as a random 232
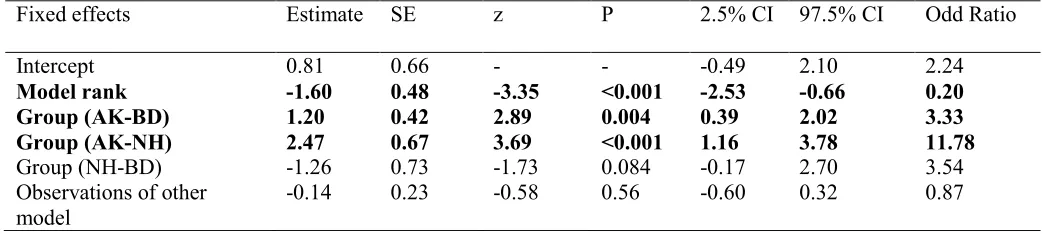
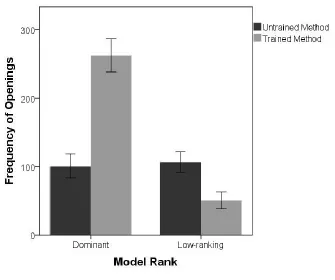
factor. Significant effects of model rank and group were found (see Table 3); dominant models 233
were significantly more likely to persist in their trained method than low-ranking models (see 234
Figure 2) and AK models were significantly less likely to stick to their trained method than NH 235
or BD. 236
Participation 237
Across all ten tests, 33 individuals from the three two-model groups opened the box. 238
However, only 25 of these individuals were successful in gaining a reward when they opened the 239
box. The remaining eight individuals either opened the box only when it was already empty or 240
were unable to retrieve the reward despite having opened the box due, for example, to the pivot 241
door closing, or food becoming trapped behind the push door. 242
Whether an individual who had seen at least one demonstration participated in the test 243
phase was entered into a GLMM with a binomial error structure and group as random intercept. 244
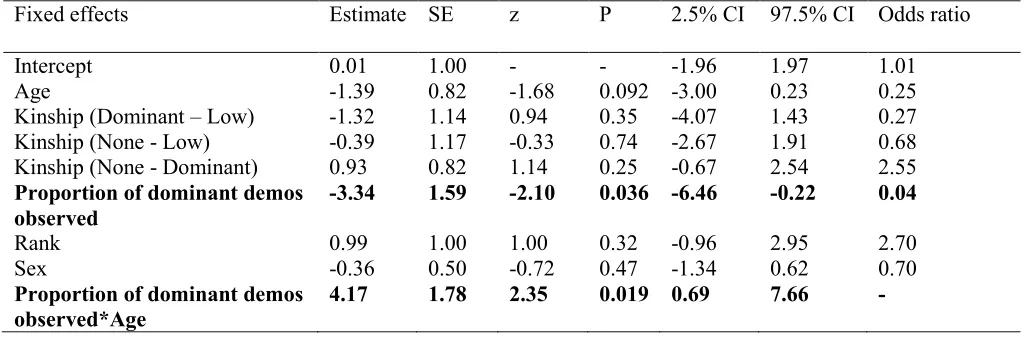
Observer rank, sex and age, along with the proportion of dominant to low-ranking 245
demonstrations they had observed were entered into the GLMM as fixed effects. A significant 246
interaction between proportion of dominant demonstrations seen and the age class of the 247
individual was found (see Table 4). The more demonstrations by a dominant model that juveniles 248
witnessed, the more likely they were to participate. 249
11 In the no-model control group (LT), six individuals opened the box. No significant 251
preference for either method was found for the first method used (binomial test, N=6, P = 0.69). 252
Of the three individuals who opened the box more than six times throughout the five tests, one 253
showed a significant preference for push (binomial test, N=149, P<0.001, 95% CI [0.68, 0.82]), 254
another a significant preference for pivot (binomial test, N=12, P=0.04, 95% CI [0.52, 0.98]) and 255
the other showed no preference for either method (binomial test, N= 7, P=0.45). 256
In the one-model group (KB), only three individuals opened the box, all using the 257
model’s method of push on their first opening, including the dominant female of the group. Two 258
of the three openers also displayed a significant preference for the model’s method over the 259
course of the 10 tests (binomial tests; Lif, N=32, P=0.04, 95% CI [0.53, 0.86]; Tang, N=9, 260
P=0.04, 95% CI [0.52, 1.0]), whilst the third showed no preference for either method (Avo, 261
N=30, P>0.99). All three individuals had seen at least one demonstration by the model (see 262
Table A2). 263
Given the small sample sizes, Fisher’s exact tests were used to assess whether the method 264
of opening (pivot or push) differed across the conditions in the two-model groups. When the first 265
method used was analysed there were no significant differences between the D-pivot and D-push 266
conditions (Fisher’s exact test, N=33, P=0.30). To assess whether there was an effect of 267
condition upon method used throughout the tests, all openings made by non-models in the three 268
two-model groups throughout the 10 test sessions were then collated (N=1637). A GLMM with 269
binomial error structure was used with individual trial number nested within monkey ID as a 270
random effect and with the method used at each opening entered as the outcome variable. The 271
condition and the proportion of pivot to push demonstrations witnessed by each individual within 272
12 model as fixed effects. No significant effects were found for either condition or proportion of 274
demonstrations observed (see Table 5). 275
A comparison of the control group, LT, with the two-model groups was conducted using a 276
GLMM with a binomial error structure, random effect of trial number nested within ID and fixed 277
effect of condition. A significant main effect of condition was found; individuals in the D-pivot 278
condition were more likely to use the pivot method than individuals from the control group 279
(estimate = 2.54, SE = 1.02, z = 2.5, P = 0.01, 95% CI [0.55, 4.53], see Figure 3). The full model 280
differed significantly from the null model (χ2 = 8.80, P = 0.01). 281
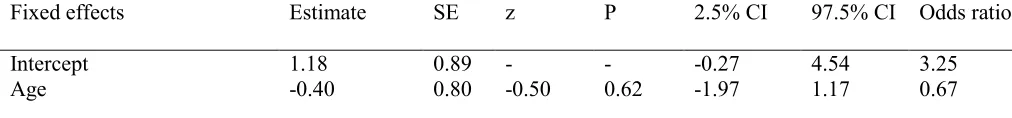
Effects of demonstrations seen, rank, kinship, age and sex 282
Whether an individual matched the method of the dominant model at each trial in the test phase 283
was entered as an outcome variable into a further GLMM with binomial error structure. 284
Condition (D-push or D-pivot) as well as participant sex, rank, age and kinship (to the models), 285
and the demonstrations they had witnessed were entered as fixed effects. As before, individual 286
trial number nested within ID was entered as a random variable. All openings over the 10 tests 287
from the three two-model groups (BD, AK and NH) were used. 288
A significant main effect of condition and an interaction between rank and sex were found. 289
Those individuals whose dominant female demonstrated push matched her method significantly 290
less often than those whose dominant female demonstrated a pivot (see Table 6), thereby 291
demonstrating a preference for pivot irrespective of condition, and rank had a significant positive 292
relationship with the likelihood of females to match the dominant method (see Figure 4). 293
13 To assess whether one method (push or pivot) could be considered ‘easier’ than the other, 295
time taken to successfully extract the food reward from the box using each method was 296
compared using the three two-model groups (BD, AK and NH). The time taken to open the box 297
was recorded for each opening as the time from when the monkey first touched the box, to the 298
moment when the apple was removed from the box. Only instances in which both the time that 299
the box was touched and the time that the apple was removed from the box could be accurately 300
recorded were used (N=1358, 1172 pivots, 186 pushes). The average time to open the box using 301
the push method across all three groups with models removed was 8.25 seconds (SE = 0.82), 302
whereas the average time to open using the pivot method was 7.62 seconds (SE = 0.25). A 303
GLMM with Gaussian error structure and a random intercept of ID was run with fixed effect of 304
opening method. When the three two-model groups were analysed together there was no 305
significant effect of method used upon the time taken to open (t = -0.89, P = 0.37). When only 306
the first test session was analysed, there remained no significant effect of method upon the time 307
taken to access the reward (t = 0.71, P = 0.47). However, when individuals from the one-model 308
group (KB) were analysed, the latency to open was significantly longer for the pivot method, 309
which was the method not modelled in this group (estimate = -7.21, SE = 2.79, t = -2.59, P = 310
0.01, 95% CI [-12.7, -1.75]). No significant effect of whether the monkeys matched the dominant 311
method was found upon their latency to retrieve the reward (t = -0.49, P=0.62). Overall, BD 312
group were slower at opening the box than both LT (estimate = -5.68, SE = 2.80, t = -2.03, P = 313
0.042, 95% CI [-11.2, -0.19]) and AK (estimate = -4.81, SE = 2.36, t = -2.04, P = 0.042, 95% CI 314
[-9.43, -0.18]). 315
Discussion
14 The primary aim of this experiment was to ascertain whether wild vervet monkeys 317
display a bias to attend to and copy a dominant model in an extractive foraging task. There was 318
no overall preference for group members to attend to the dominant females’ demonstrations 319
more than the low-ranking models’ demonstrations and no significant bias towards the dominant 320
females’ versus the low ranking females’ method was exhibited in the first method used on the 321
box by each individual, nor did any consistent bias emerge over the course of the ten test 322
sessions. When all sessions were collated, there was a significant effect of condition upon 323
likelihood of the dominant female’s method being matched. This suggests a preference for the 324
pivot action over the push action, by comparison with which a model’s rank had little enduring 325
effect upon the method adopted by group members. 326
This finding is consistent with an earlier experiment with captive capuchin monkeys 327
(Dindo et al., 2011) and findings of social attention in wild vervet monkeys which showed no 328
effect of rank upon levels of social attention received (Renevey, Bshary & van de Waal et al., 329
2013). However it contrasts with reports of dominance-based biases in captive chimpanzees 330
(Horner et al., 2010; Kendal et al., 2015, although see Watson et al. 2017). It is possible, and not 331
implausible, that artificial social groupings could have influenced the captive studies; for 332
example, animals that have to remain in close proximity to all group mates may exhibit different 333
attentional biases compared to those living in their natural, fission-fusion state (Goodall, 1986; 334
Murray, Mane & Pusey, 2007). There may also be different perceptions of others’ success (or 335
different levels of ability to judge success) between species. It has been shown that wild 336
dominant female chimpanzees are able to acquire higher quality resources than lower ranking 337
females and, as such, may achieve higher reproductive success (Pusey, Williams & Goodall, 338
15 populations sampled thus far (Cheney, Lee & Seyfarth, 1981; Cheney & Seyfarth, 1987; 340
Wrangham, 1981). Therefore whilst for chimpanzees dominance might be a proxy for judging 341
the success of potential models, and thus invite a bias towards copying these individuals, this 342
may not be the case in vervet monkeys. This would then limit the adaptive value of copying a 343
dominant female. Indeed, vervet monkeys have already been shown to copy female, but not 344
male, models in extractive foraging tasks (van de Waal et al., 2010), ostensibly because females 345
are the philopatric sex and thus most knowledgeable about the local environment. Therefore, 346
females of all ranks may have similar and relevant local knowledge. The preference for the pivot 347
method almost exclusively in groups where it was modelled and the preferences for the push 348
method shown in the one-model group suggest that the models did influence individuals’ 349
learning, but there appeared to be no enduring effect of the models’ ranks upon method chosen. 350
Though there was no overall bias for group members to attend to, or copy, particular 351
models based upon the model’s rank, there were biases in both attention and behaviour based 352
upon individual level variables and the observer’s relationship with the model. Chance (1967) 353
suggested that individuals should attend more to higher-ranked individuals than lower-ranked 354
individuals, but this was not found in the current study. Instead the rank of the observers 355
significantly affected the demonstrations they observed by females of different rank; higher-356
ranking individuals attended to more demonstrations by the dominant female than did lower-357
ranking individuals. This effect of rank was also shown in the test phase where high-ranking 358
females were more likely to match the dominant than low-ranking females. It may be that all 359
individuals have a preference to attend to, and match the behaviour of, the dominant female, but 360
this can only be expressed in higher-ranking monkeys who may be more tolerated in proximity 361
16 in this finding. Whilst kinship was not a significant predictor of method used, rank is maternally 363
determined in vervet monkeys (Cheney & Seyfarth, 1990) and thus can serve as an indicator for 364
kinship in females and juveniles. Indeed, it may be possible that in our study, rank was a better 365
predictor of kinship than our kinship variable. Since genetic data were not available, kinship was 366
recorded only for direct offspring born since the monkeys were habituated and reliably identified 367
five years ago; sibling relationships between adult females were unknown and could not be 368
included in our measure. However, given that sisters are usually adjacent in rank in vervet 369
monkeys (Cheney & Seyfarth, 1990), the rank variable likely captured these relationships. The 370
low ranking models’ kin watched more of her demonstrations than the kin of the dominant model 371
(but not non-kin overall). Therefore, it may be that the tendency of high-ranked individuals to 372
preferentially attend to and copy the behaviour of the dominant female reflects a kinship bias to 373
some extent. Previously only infants have been shown to exhibit a kinship bias in social learning 374
in vervet monkeys (van de Waal et al., 2014). However, to confirm that a kinship bias goes 375
beyond infancy in vervet monkey social learning, more complete data on relatedness are 376
required. 377
The interaction of rank and sex suggests that, perhaps because females are the philopatric 378
sex, there may be informational and/or normative (Claidiere and Whiten, 2012) benefits for 379
females to match the behaviour of their female kin/fellow high-ranking monkeys that may not be 380
as relevant for males. It may be that all females are able to convey equally useful social and 381
environmental information that would negate a bias for males to attend to and copy the most 382
dominant female. 383
Previous research found adult male vervet monkeys to be extraordinarily receptive to the 384
17 tendency to adopt their new group’s food colour preference. There has been considerable debate 386
about alternative explanations for such apparent conformity in this outcome and related findings 387
in birds (Aplin et al., 2015; van Leeuwen, Kendal, Tennie & Haun, 2015; van Leeuwen, Acerbi, 388
Kendal, Tennie, & Haun, 2016; Aplin et al. 2016; Whiten & van de Waal, 2016; Acerbi, van 389
Leeuwen, Haun & Tennie, 2016). A further study on vervet monkeys found stable 390
experimentally seeded dietary preferences in low-ranking females after group fission which, 391
along with the initial study, could be explained by a bias to either copy the dominant or conform 392
to the preferences of the origin group (van de Waal, van Schaik and Whiten, in press). As in the 393
current study we found no group level preference emerging for the method demonstrated by the 394
dominant female in each group, the latter explanation for the low-ranking females’ behaviour 395
appears more parsimonious. Only four males who had transferred from another group managed 396
to open the box during the test phases of the present study and while all showed a preference for 397
the dominant models’ method, this is too small a number from which to draw meaningful 398
conclusions. 399
This study also revealed a significant effect of age in attention to the models; juveniles 400
were more likely than adults to attend to the demonstrations of the dominant models. When 401
juveniles alone were analysed, they did not show a significant preference to attend to the 402
dominant models more than the low-ranking models. Therefore it seems likely that the observed 403
age differences in attention stem from a higher tolerance for juveniles in dominant models. Some 404
primate species show high levels of tolerance towards even unrelated juveniles (Hirata & Celli, 405
2003; Boinski et al., 2003) and thus it seems likely that the juveniles were able to be in closer 406
proximity to the dominant females’ demonstrations than were adults. However, age was not a 407
18 Model behaviour
409
The behaviour of the models during the unrestrained test phase provided interesting 410
findings; whereas all three dominant models showed a sustained preference for their trained 411
action, none of the low-ranking models in the two-model groups did (although the low-ranking 412
model from BD was able to open the box only once). The finding that neither method was more 413
efficient than the other suggests that these models likely switched method after viewing others 414
performing the alternative action. However, since the number of observations of the other model 415
during the demonstration phase was not a good predictor of method used, it is likely that the low-416
ranking models were influenced by other group members as well. The sole, low-ranking model 417
in KB maintained her preference for her trained, push action in the absence of a dominant model 418
preforming the alternative action. This is consistent with findings that dominant individuals seem 419
to take less account of social information than lower-ranking individuals (Kendal et al., 2015; 420
Pongrácz, Vida, Bánhegyi & Miklósi, 2008), perhaps due to their ability to monopolise resources 421
and scrounge from others. The group level differences in models’ adherence to their trained 422
method may have been due to individual variation or group level differences in social 423
relationships, as has been shown in our three experimental groups of vervet monkeys (Borgeaud, 424
Sosa, Bshary, Sueur & van de Waal, 2016), and thus potentially in social information use. 425
Finally, this study revealed a preference for one of the two alternative actions (pivot), an 426
issue that often arises when using multiple-option artificial fruits to test for social learning 427
(Claidière, et al., 2013; Tennie, Call & Tomasello, 2006). However, this preference was only 428
exhibited when the pivot was modelled (no preference was found in the control group), thus 429
suggesting that some actions may lend themselves more to social learning than others. This has 430
19 2006). The pivot method involved a bigger range of motion and was noisier than the more 432
discrete push action. We suggest that such differences in ease of transmission should be 433
investigated further as they may play a significant role in which behaviours are preferred and 434
likely to become traditions. 435
Some limitations in this initial attempt to address the issue of model bias experimentally 436
in the wild should be acknowledged. Our sample size was relatively small due to the low number 437
of individuals from each group who opened the box during the test phase. This should be borne 438
in mind particularly when interpreting the class-level biases revealed here, such as effects of age 439
and sex, as they may have been influenced by number and sex of individuals within the group. 440
Further investigation is required to assess the strength of these biases and whether they are seen 441
in other contexts. As in other studies of a similar nature (Lonsdorf et al., 2016), the open nature 442
of the test phase meant that some high-ranking individuals were able to monopolise the boxes 443
first, so monkeys would be likely to see more demonstrations from higher-ranking individuals 444
during the test phase than from lower-ranking individuals. Although we did incorporate the 445
number of pushes and pivots seen at this phase into our analyses and found them not to be 446
significant predictors, it is still possible that an individual other than a demonstrator may have 447
influenced the choice of method of the other monkeys. 448
To conclude, this experiment revealed that several biases appear to exist in vervet 449
monkey social attention and social learning based upon individual characteristics, such as rank, 450
sex and age, and the relationship between observer and model. Overall though, no group-wide 451
bias was found for individuals to copy a model of higher rank. These results highlight the 452
complex nature of social learning and social attention in primates, including factors such as 453
20 individual-level biases. Further research is needed to fully understand these biases and how they 455
might contribute to the spread of behaviours in wild primates. 456
References 457
Acerbi, A., Van Leeuwen, E. J., Haun, D. B. & Tennie, C. (2016). Conformity cannot be 458
identified based on population-level signatures. Scientific Reports, 6. 459
Aplin, L. M., Farine, D. R., Morand-Ferron, J., Cockburn, A., Thornton, A., & Sheldon, B. C. 460
(2015). Experimentally induced innovations lead to persistent culture via conformity in wild 461
birds. Nature. 518, 538–541. 462
Aplin, L. M., Farine, D. R., Morand-Ferron, J., Cockburn, A., Thornton, A., & Sheldon, B. C. 463
(2016). Counting conformity: evaluating the units of information in frequency-dependent social 464
learning. Animal Behaviour, 110, e5–e8. 465
Allen, J., Weinrich, M., Hoppitt, W., & Rendell, L. (2013). Network-based diffusion analysis 466
reveals cultural transmission of lobtail feeding in humpback whales. Science, 340(6131), 485-467
488. DOI: 10.1126/science.1231976 468
Akaike, H. (1974). A new look at the statistical model identification. IEEE transactions on 469
automatic control, 19(6), 716-723. DOI: 10.1109/TAC.1974.1100705 470
Bates, D., Maechler, M., Bolker, B., & Walker, S. (2014). lme4: Linear mixed-effects models 471
using Eigen and S4. R package version, 1(7). https://cran.r 472
project.org/web/packages/lme4/index.html 473
Boinski, S., Quatrone, R. P., Sughrue, K., Selvaggi, L., Henry, M., Stickler, C. M., & Rose, L. 474
21 (Eds.), The biology of traditions: models and evidence (pp. 365-390). Cambridge: Cambridge 476
University Press. 477
Bolker, B. M., Brooks, M. E., Clark, C. J., Geange, S. W., Poulsen, J. R., Stevens, M. H. H., & 478
White, J. S. S. (2009). Generalized linear mixed models: a practical guide for ecology and 479
evolution. Trends in ecology & evolution, 24(3), 127-135. DOI: 10.1016/j.tree.2008.10.008 480
Borgeaud, C., & Bshary, R. (2015). Wild vervet monkeys trade tolerance and specific 481
coalitionary support for grooming in experimentally induced conflicts. Current Biology, 25(22), 482
3011-3016. DOI: 10.1016/j.cub.2015.10.016 483
Borgeaud, C., Sosa, S., Bshary, R., Sueur, C., & Van de Waal, E. (2016). Intergroup variation of 484
social relationships in wild vervet monkeys: a dynamic network approach. Frontiers in 485
psychology, 7: 915. https://dx.doi.org/10.3389%2Ffpsyg.2016.00915 486
Boyd, R., & Richerson, P. J. (1985). Culture and the Evolutionary Process. Chicago: University 487
of Chicago Press. 488
Burnham, K. P. and Anderson, D. R (2002) Model selection and multimodel inference: a 489
practical information-theoretic approach. 2nd ed. New York, Springer-Verlag. https://cran.r-490
project.org/web/packages/MuMIn/MuMIn.pdf 491
Chance, M. R. (1967). Attention structure as the basis of primate rank orders. Man, 2(4), 503-492
518. 493
Cheney, D. L., Lee, P. C., & Seyfarth, R. M. (1981). Behavioral correlates of non-random 494
mortality among free-ranging female vervet monkeys. Behavioral Ecology and Sociobiology, 495
22 Cheney, D. L., & Seyfarth, R. M. (1987). The influence of intergroup competition on the
497
survival and reproduction of female vervet monkeys. Behavioral Ecology and Sociobiology, 498
21(6), 375-386. DOI: 10.1007/BF00299932 499
Cheney, D. L., & Seyfarth, R. M. (1990). How monkeys see the world: Inside the mind of 500
another species. Chicago: University of Chicago Press. 501
Choleris, E., Guo, C., Liu, H., Mainardi, M., & Valsecchi, P. (1997). The effect of demonstrator 502
age and number on duration of socially-induced food preferences in a house mouse (Mus 503
domesticus). Behavioural processes, 41(1), 69-77.DOI: 10.1016/S0376-6357(97)00029-6 504
Claidière, N., Messer, E. J., Hoppitt, W., & Whiten, A. (2013). Diffusion dynamics of socially 505
learned foraging techniques in squirrel monkeys. Current Biology, 23(13), 1251-1255. DOI: 506
10.1016/j.cub.2013.05.036 507
Claidière, N., & Whiten, A. (2012). Integrating the study of conformity and culture in humans 508
and nonhuman animals. Psychological bulletin, 138(1), 126. 509
Coussi-Korbel, S., & Fragaszy, D. M. (1995). On the relation between social dynamics and 510
social learning. Animal Behaviour, 50(6), 1441-1453. DOI: 10.1016/0003-3472(95)80001-8 511
Dindo, M., Leimgruber, K. L., Ahmed, R., Whiten, A., & de Waal, F. (2011). Observer choices 512
during experimental foraging tasks in brown capuchin monkeys (Cebus apella). American 513
journal of primatology, 73(9), 920-927. DOI: 10.1002/ajp.20962 514
Duffy, G. A., Pike, T. W., & Laland, K. N. (2009). Size-dependent directed social learning in 515
nine-spined sticklebacks. Animal Behaviour, 78(2), 371-375. DOI: 516
23 Goodall, J. (1986). The chimpanzees of Gombe: Patterns of behavior. Cambridge, MA: Belknap 518
Press of Harvard University Press. 519
Henrich, J., & Gil-White, F. J. (2001). The evolution of prestige: Freely conferred deference as a 520
mechanism for enhancing the benefits of cultural transmission. Evolution and human 521
behavior, 22(3), 165-196. 522
Hirata, S., & Celli, M. L. (2003). Role of mothers in the acquisition of tool-use behaviours by 523
captive infant chimpanzees. Animal cognition, 6(4), 235-244. 524
Horner, V., Proctor, D., Bonnie, K. E., Whiten, A., & de Waal, F. B. (2010). Prestige affects 525
cultural learning in chimpanzees. PLoS One, 5(5), e10625. DOI:10.1371/journal.pone.0010625 526
Katz, M., & Lachlan, R. F. (2003). Social learning of food types in zebra finches (Taenopygia 527
guttata) is directed by demonstrator sex and feeding activity. Animal cognition, 6(1), 11-16. 528
DOI: 10.1007/s10071-003-0158-y 529
Laland, K. N. (2004). Social learning strategies. Animal Learning & Behavior, 32(1), 4-14. DOI: 530
10.3758/BF03196002 531
Laland, K. N., & Williams, K. (1998). Social transmission of maladaptive information in the 532
guppy. Behavioral Ecology, 9(5), 493-499. 533
Van Leeuwen, E. J., Kendal, R. L., Tennie, C. & Haun, D. B. (2015). Conformity and its look-a-534
likes. Animal Behaviour, 110, e1–e4. 535
Van Leeuwen, E. J., Acerbi, A., Kendal, R. L., Tennie, C. & Haun, D. B. (2016). A 536
24 Lonsdorf, E. V., Bonnie, K. E., Grim, M., Krupnick, A., Prestipino, M., & Whyte, J. (2016). 538
Seeding an arbitrary convention in capuchin monkeys: The effect of social context. Behaviour, 539
153(5), 633-654. 540
Kendal, R., Hopper, L. M., Whiten, A., Brosnan, S. F., Lambeth, S. P., Schapiro, S. J., & 541
Hoppitt, W. (2015). Chimpanzees copy dominant and knowledgeable individuals: implications 542
for cultural diversity. Evolution and Human Behavior, 36(1), 65-72. 543
DOI:10.1016/j.evolhumbehav.2014.09.002 544
Murray, C. M., Mane, S. V., & Pusey, A. E. (2007). Dominance rank influences female space 545
use in wild chimpanzees, Pan troglodytes: towards an ideal despotic distribution. Animal 546
Behaviour, 74(6), 1795-1804. DOI: 10.1016/j.anbehav.2007.03.024 547
Neumann, C., Duboscq, J., Dubuc, C., Ginting, A., Irwan, A. M., Agil, M., ... & Engelhardt, A. 548
(2011). Assessing dominance hierarchies: validation and advantages of progressive evaluation 549
with Elo-rating. Animal Behaviour, 82(4), 911-921.DOI: 10.1016/j.anbehav.2011.07.016 550
Pongrácz, P., Vida, V., Bánhegyi, P., & Miklósi, Á. (2008). How does dominance rank status 551
affect individual and social learning performance in the dog (Canis familiaris)?. Animal 552
Cognition, 11(1), 75-82. DOI:10.1007/s10071-007-0090-7 553
Pusey, A., Williams, J., & Goodall, J. (1997). The influence of dominance rank on the 554
reproductive success of female chimpanzees. Science, 277(5327), 828-831. 555
DOI:10.1126/science.277.5327.828 556
R Core Team (2013). R: A language and environment for statistical computing. R Foundation for 557
25 Renevey, N., Bshary, R., & van de Waal, E. (2013). Philopatric vervet monkey females are the 559
focus of social attention rather independently of rank. Behaviour, 150(6), 599-615. 560
van Schaik, C. P., van Noordwijk, M. A., & Wich, S. A. (2006). Innovation in wild Bornean 561
orangutans (Pongo pygmaeus wurmbii). Behaviour, 143(7), 839-876. DOI: 562
10.1163/156853906778017944 563
Seyfarth, R. M. (1977). A model of social grooming among adult female monkeys. Journal of 564
theoretical Biology, 65(4), 671-698. 565
Tennie, C., Call, J., & Tomasello, M. (2006). Push or pull: Imitation vs. emulation in great apes 566
and human children. Ethology, 112(12), 1159-1169. DOI:10.1111/j.1439-0310.2006.01269.x 567
van de Waal, E., Borgeaud, C., & Whiten, A. (2013). Potent social learning and conformity 568
shape a wild primate’s foraging decisions. Science, 340(6131), 483-485. 569
van de Waal, E., Bshary, R., & Whiten, A. (2014). Wild vervet monkey infants acquire the food-570
processing variants of their mothers. Animal Behaviour, 90, 41-45. 571
DOI:10.1016/j.anbehav.2014.01.015 572
van de Waal, E., Claidière, N., & Whiten, A. (2015). Wild vervet monkeys copy alternative 573
methods for opening an artificial fruit. Animal cognition, 18(3), 617-627. DOI: 10.1007/s10071-574
014-0830-4 575
van de Waal, E., Renevey, N., Favre, C. M., & Bshary, R. (2010). Selective attention to 576
philopatric models causes directed social learning in wild vervet monkeys. Proceedings of the 577
26 van de Waal, E., van Schaik, C., & Whiten, A. (2017). Resilience of experimentally-seeded 579
dietary traditions in wild vervets: evidence from group fissions. American Journal of 580
Primatology. e22687 581
Watson, S. K., Reamer, L. A., Mareno, M. C., Vale, G., Harrison, R. A., Lambeth, S. P., ... & 582
Whiten, A. (2017). Socially transmitted diffusion of a novel behavior from subordinate 583
chimpanzees. American Journal of Primatology, 79(6),e22642 584
Whiten, A., Horner, V., Litchfield, C. A., & Marshall-Pescini, S. (2004). How do apes ape?. 585
Animal Learning & Behavior, 32(1), 36-52. DOI: 10.3758/BF03196005 586
Whiten, A., Horner, V., & De Waal, F. B. (2005). Conformity to cultural norms of tool use in 587
chimpanzees. Nature, 437(7059), 737-740. DOI: 10.1038/nature04047 588
Whiten, A. & van de Waal, E. (2016). Identifying and dissecting conformity in animals in the 589
wild: Further analysis of primate data. Animal Behaviour, 122, e1–e4. 590
Wrangham, R. W. (1981). Drinking competition in vervet monkeys. Animal Behaviour, 29(3), 591
904-910. DOI: 10.1016/S0003-3472(81)80027-9 592
593
Acknowledgements 594
This project was funded by the Swiss National Science Foundation (grant number 595
31003A_159587) and Society in Science - Branco Weiss Fellowship to E.v.d.W and a John 596
Templeton Foundation grant to A.W and Kevin Laland (grant number ID40128). We are grateful 597
to the late K. van der Walt for permission to conduct the study in his reserve and to the site 598
27 J. Cantoni, M. Clerc, P. Dongre, E. Holden, A. Lamprecht, D. Montanari, W. O’Hearn, A. 600
Sobrino and P. Stoebener for their assistance with data collection. We also thank Betsy Herrelko 601
and two anonymous reviewers for their insightful comments which helped to improve this 602
article. 603
604
605
606
607
608
[image:27.612.70.536.482.675.2]Appendix 609
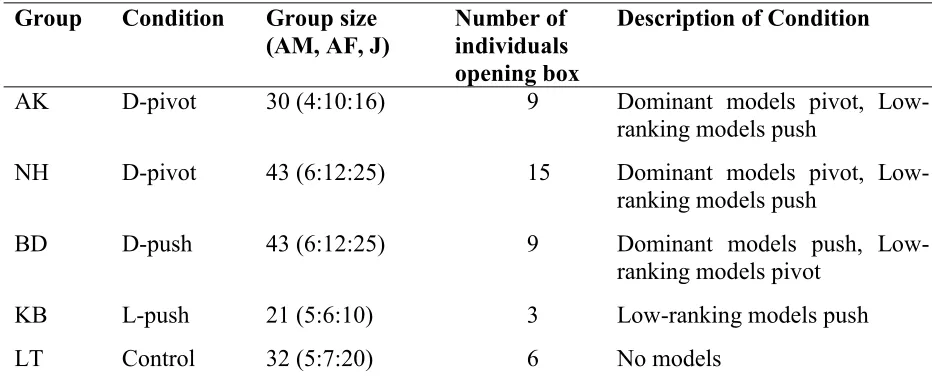
Table 1: Allocation of groups to conditions, group sizes and number of individuals who opened 610
the box 611
Group Condition Group size (AM, AF, J)
Number of individuals opening box
Description of Condition
AK D-pivot 30 (4:10:16) 9 Dominant models pivot, Low-ranking models push
NH D-pivot 43 (6:12:25) 15 Dominant models pivot, Low-ranking models push
BD D-push 43 (6:12:25) 9 Dominant models push,
Low-ranking models pivot
KB L-push 21 (5:6:10) 3 Low-ranking models push
LT Control 32 (5:7:20) 6 No models
Numbers of individuals in the groups (excluding infants) are given as they were on the first day 612
28 (J). The number of individuals from each group who opened the box during the test phase are 614
listed with a description of each condition. 615
616
617
618
619
620
[image:28.612.66.569.427.660.2]621
Table 2: Factors affecting the probability of individuals observing a demonstration from within 5 622
metres. 623
Fixed effects Estimate SE z P 2.5 % CI 95% CI Odds ratio
Dominant demonstrations
Intercept -0.29 0.44 - - -0.94 1.39 1.25
Age 1.00 0.24 4.17 <0.001 0.46 1.43 2.57
Kinship (Dominant – Low) 0.08 0.53 0.15 0.88 0.95 1.12 1.09
Kinship (Dominant – None) 0.48 0.34 1.41 0.16 -1.15 0.19 1.62
Kinship (Low – None) 0.56 0.41 1.37 0.17 -0.24 1.37 1.76
Rank 1.44 0.41 3.49 <0.001 0.63 2.25 4.23
Sex -0.13 0.21 -0.62 0.53 -0.55 0.27 0.87
Low-ranking demonstrations
Intercept 0.70 0.74 - - 0.19 2.57 3.97
Age -1.57 0.78 -2.01 0.044 -3.10 -0.04 0.21
Kinship (Low-Dominant) 1.24 0.61 2.05 0.040 0.05 2.43 3.47
Kinship (Dominant-None) 0.68 0.44 1.54 0.12 -0.19 1.55 0.51
Kinship (Low – None) 0.56 0.44 1.28 0.20 -0.30 1.42 1.76
Rank 0.56 0.45 1.24 0.21 -0.32 1.43 1.74
Sex -0.50 0.39 -1.29 0.20 -1.26 0.26 0.61
29 Analyses are separated for demonstrations by the dominant and low-ranking female models. 624
Significant predictors are presented in bold. Only significant interactions were included in the 625
full model. 626
627
628
629
630
631
632
[image:29.612.64.585.487.604.2]633
Table 3: Factors affecting the probability that models used their trained method in the test phase. 634
635
Significant predictors are presented in bold. The final model was significantly different from the 636
null model containing only the random effects of Test and Individual trial nested within ID 637
(likelihood ratio test: χ2=12.2, P=0.016). 638
Fixed effects Estimate SE z P 2.5% CI 97.5% CI Odd Ratio
Intercept 0.81 0.66 - - -0.49 2.10 2.24
Model rank -1.60 0.48 -3.35 <0.001 -2.53 -0.66 0.20
Group (AK-BD) 1.20 0.42 2.89 0.004 0.39 2.02 3.33
Group (AK-NH) 2.47 0.67 3.69 <0.001 1.16 3.78 11.78
Group (NH-BD) -1.26 0.73 -1.73 0.084 -0.17 2.70 3.54
Observations of other model
30 639
640
641
642
643
644
645
646
647
[image:30.612.65.579.496.666.2]648
Table 4: Factors affecting the probability that an individual participated in the test phase. 649
Fixed effects Estimate SE z P 2.5% CI 97.5% CI Odds ratio
Intercept 0.01 1.00 - - -1.96 1.97 1.01
Age -1.39 0.82 -1.68 0.092 -3.00 0.23 0.25
Kinship (Dominant – Low) -1.32 1.14 0.94 0.35 -4.07 1.43 0.27
Kinship (None - Low) -0.39 1.17 -0.33 0.74 -2.67 1.91 0.68
Kinship (None - Dominant) 0.93 0.82 1.14 0.25 -0.67 2.54 2.55
Proportion of dominant demos observed
-3.34 1.59 -2.10 0.036 -6.46 -0.22 0.04
Rank 0.99 1.00 1.00 0.32 -0.96 2.95 2.70
Sex -0.36 0.50 -0.72 0.47 -1.34 0.62 0.70
Proportion of dominant demos observed*Age
31 Significant predictors are presented in bold. Only significant interactions were included in the 650
full model. 651
652
653
654
655
656
657
658
659
660
[image:31.612.56.536.567.646.2]661
Table 5: Factors affecting the probability that an individual used push or pivot in the test phase. 662
663
Fixed effects Estimate SE z P 2.5% CI 97.5% CI Odds ratio
Intercept 1.42 0.80 - - -0.15 3.00 4.15
Condition -0.87 0.64 -1.37 0.17 -2.12 0.37 0.42
Proportion of demos observed
32 The full model differed significantly from the null model with only the random effect of trial 664
number nested within ID (χ2=12.3, P=0.002). 665
666
667
668
669
670
671
672
673
674
675
676
[image:32.612.67.573.659.718.2]677
Table 6: Factors affecting the probability that individuals matched the method of their dominant 678
female in the test phase. 679
Fixed effects Estimate SE z P 2.5% CI 97.5% CI Odds ratio
Intercept 1.18 0.89 - - -0.27 4.54 3.25
33 Significant predictors are presented in bold. The full model was significantly different from the 680
null model containing only the random effects of individual trial nested within ID (likelihood 681
ratio test: χ2= 35.2, P < 0.001). 682
Condition -3.59 0.85 -4.20 <0.001 -5.26 -1.92 0.03
Kinship (Dominant – Low) 0.16 1.40 0.11 0.91 -2.58 2.89 1.17
Kinship (None - Dominant) 0.95 0.60 1.59 0.11 -0.22 2.13 2.59
Kinship (None - Low) 1.11 1.34 0.83 0.41 -1.51 4.71 3.03
Proportion demos seen -1.31 1.21 -1.09 0.28 -3.68 1.05 0.27
Rank 1.61 1.59 1.01 0.31 -1.50 4.71 4.99
Sex -2.03 1.23 -1.65 0.099 -4.45 0.38 0.13
34 Table A1: All demonstrations watched by all individuals during the demonstration phase, with participation and associated individual 683
variables. 684
685
Group Individual Participated Kinship Sex Age Rank Dominant
demos watched
Low-ranker demos watched
Total demos watched
Proportion of demos watched
BD Aapie No Non-Kin F J 0.292683 2 0 2 1
BD Afrikaans Yes Non-Kin M J NA 3 0 3 1
BD Akkedis No Non-Kin M J 0.536585 7 6 13 0.54
BD Alsiende Yes Non-Kin F J 0.365854 10 5 15 0.67
BD Bullebak No Non-Kin M J 0.243902 0 1 1 0
BD Chernobyl No Non-Kin M A 0.95122 1 1 2 0.5
BD Chouchou Yes Non-Kin F A 0.634146 2 6 8 0.25
BD Dapper No Non-Kin M A 0.268293 0 4 4 0
BD Dwergie No Non-Kin M J 0.804878 0 2 2 0
BD Heerlik No Non-Kin F A 0.560976 0 10 10 0
BD Hippie No Non-Kin F J 0.585366 7 2 9 0.78
BD Kies No Non-Kin M J 0.682927 1 9 10 0.1
BD Little Blind No Non-Kin F J 0.073171 4 0 4 1
BD Madagascar No Non-Kin M A 0.902439 0 5 5 0
BD Mevrou No Non-Kin F J 0.341463 2 0 2 1
BD Mieles Yes Non-Kin F A 0.121951 0 8 8 0
BD Mvula No Non-Kin M A 0.097561 2 1 3 0.67
BD Neuchatel No Non-Kin M A 0.926829 6 6 12 0.5
BD Noktober No Non-Kin M J 0.170732 6 2 8 0.75
BD Nurk No Non-Kin F J 0.219512 0 4 4 0
35
BD Onbeskof Yes Dom kin M J 0.707317 5 1 6 0.83
BD Pannekookie No Non-Kin F A 0.146341 2 8 10 0.2
BD Pieperig Yes Non-Kin F J 0.756098 12 1 13 0.92
BD Poeding Yes Non-Kin M J 0.829268 17 2 19 0.89
BD Potjie No Non-Kin F J 0.390244 0 2 2 0
BD Princess Yes Non-Kin F A 0.878049 0 4 4 0
BD Rakker No LR kin M J 0.317073 0 11 11 0
BD Rooikat No LR kin M J 0.439024 8 1 9 0.89
BD Siele No Non-Kin F J 0.414634 4 7 11 0.36
BD Spook No Non-Kin M J 0.658537 0 6 6 0
BD Toronto No Non-Kin M A 0.512195 2 10 12 0.17
BD Vakkie No Non-Kin M J 0.02439 6 6 12 0.5
BD Vulcan No Non-Kin M J 0.195122 1 2 3 0.33
BD Wolfy No Non-Kin M J 0.487805 0 3 3 0
BD Wurm No Non-Kin M J 0 2 5 7 0.29
BD Zurich Yes Non-Kin M A 0.731707 2 2 4 0.5
AK Elton No Non-Kin M A 0.931034 6 8 14 0.43
AK Geleza Yes Dom kin F J 0.896552 14 1 15 0.93
AK Ghangaan No Dom kin F A 0.862069 2 2 4 0.5
AK Ghozo No Dom kin M J 0.793103 3 5 8 0.38
AK Gugu Yes Dom kin F A 0.965517 6 6 12 0.5
AK Heye No Non-Kin M J 0.310345 2 11 13 0.15
AK Hlo No Non-Kin M J 0.206897 0 3 3 0
AK Hleka No Non-Kin F A 0.448276 4 0 4 1
AK Hola No Non-Kin M J 0.344828 0 1 1 0
AK Hwawaza Yes Non-Kin M J 0.758621 8 17 25 0.32
AK Idwala No Non-Kin F J 0.275862 1 4 5 0.2
AK Ijinga Yes Non-Kin M J 0.034483 1 12 13 0.08
AK Ilonga No Non-Kin F J 0.413793 0 2 2 0
AK Inhla Yes Non-Kin F J 0.827586 5 2 7 0.71
36
AK Isilonda Yes Non-Kin F A 0.413793 2 8 10 0.2
AK Mbas No Non-Kin M J 0.137931 3 3 6 0.5
AK Mungunya Yes Non-Kin M J 0 0 19 19 0
AK Mvula No Non-Kin M J 0.068966 0 1 1 0
AK Ndonsa No LR kin F A 0.206897 2 1 3 0.67
AK Nyone No LR kin M J 0.241379 9 6 15 0.6
AK Ubu No Non-Kin M J 0.62069 7 7 14 0.5
AK Umzali No Non-Kin M A 0.586207 5 0 5 1
AK Unwabu No Non-Kin M J 0.517241 5 3 8 0.63
AK Voldemort No Non-Kin M A 0.551724 2 0 2 1
NH Boston No LR kin M J 0.119048 5 9 14 0.36
NH Brasilia Yes LR kin F A 0.666667 2 12 14 0.14
NH Cancun No Non-Kin M A 0.761905 0 1 1 0
NH Ertjies No Non-Kin M A 0.928571 2 0 2 1
NH Garroua Yes Dom kin M J 0.619048 7 0 7 1
NH Gaya No Dom kin F J 0.97619 14 2 16 0.88
NH Glastonbury Yes Dom kin M J 0.452381 18 0 18 1
NH Govu No Non-Kin M A 0.857143 2 3 5 0.4
NH Jakarta No Non-Kin F A 0.214286 1 0 1 1
NH Jillin No Non-Kin F J 0.071429 1 3 4 0.25
NH Jinka No Non-Kin F A 0.595238 0 1 1 0
NH Jixi No Non-Kin M J 0.166667 3 0 3 1
NH Juneau Yes Non-Kin M J 0.428571 20 0 20 1
NH Lhassa No Non-Kin F A 0.404762 0 3 3 0
NH Lome Yes Non-Kin M J 0.785714 2 6 8 0.25
NH M30 Yes Non-Kin M A 0.571429 0 4 4 0
NH Paris Yes Non-Kin F A 0.738095 0 6 6 0
NH Praia No Non-Kin F J 0.285714 2 7 9 0.22
NH Pretoria No Non-Kin F A 0.904762 8 0 8 1
NH Puerto Yes Non-Kin M J 0.714286 5 15 20 0.25
37
NH Rennes No Non-Kin F J 0.047619 3 0 3 1
NH Rheeban No Non-Kin M J 0 2 0 2 1
NH Rio No Non-Kin M J 0.380952 1 0 1 1
NH Styx No Non-Kin M A 0.261905 2 0 2 1
NH Tallin No Non-Kin M J 0.142857 4 1 5 0.8
NH Tirroan No Non-Kin M J 0.238095 4 0 4 1
NH Troia Yes Non-Kin F A 0.333333 1 4 5 0.2
NH Uji No Non-Kin M J 0.690476 6 1 7 0.86
NH Ulundi Yes Non-Kin M J 0.5 10 1 11 0.91
NH Upsala No Non-Kin F A 1 17 0 17 1
NH Xaixai No Non-Kin F A 0.880952 2 7 9 0.22
NH Xalapa Yes Non-Kin F J 0.190476 7 0 7 1
NH Xeres Yes Non-Kin M J 0.52381 7 7 14 0.5
NH Xian No Non-Kin F J 0.47619 6 2 8 0.75
NH Yoogali No Non-Kin F J 0.642857 7 3 10 0.7
NH Zanzibar No Non-Kin M J 0.357143 2 0 2 1
NH Zion No Non-Kin M J 0.809524 1 6 7 0.14
686
687
688
689
690
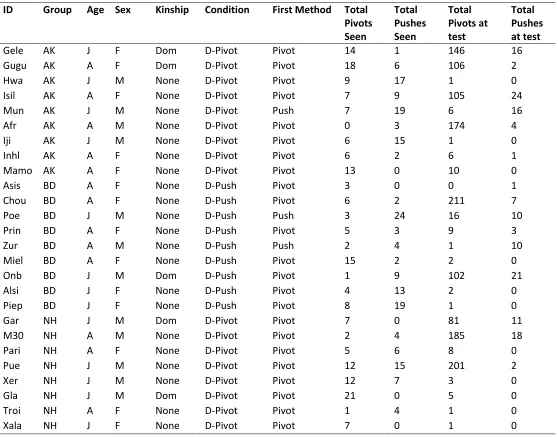
38 Table A2: All openings made by all individuals across the five groups using each method with all individual variables
692
ID Group Age Sex Kinship Condition First Method Total
Pivots Seen
Total Pushes Seen
Total Pivots at test
Total Pushes at test
Gele AK J F Dom D-Pivot Pivot 14 1 146 16
Gugu AK A F Dom D-Pivot Pivot 18 6 106 2
Hwa AK J M None D-Pivot Pivot 9 17 1 0
Isil AK A F None D-Pivot Pivot 7 9 105 24
Mun AK J M None D-Pivot Push 7 19 6 16
Afr AK A M None D-Pivot Pivot 0 3 174 4
Iji AK J M None D-Pivot Pivot 6 15 1 0
Inhl AK A F None D-Pivot Pivot 6 2 6 1
Mamo AK A F None D-Pivot Pivot 13 0 10 0
Asis BD A F None D-Push Pivot 3 0 0 1
Chou BD A F None D-Push Pivot 6 2 211 7
Poe BD J M None D-Push Push 3 24 16 10
Prin BD A F None D-Push Pivot 5 3 9 3
Zur BD A M None D-Push Push 2 4 1 10
Miel BD A F None D-Push Pivot 15 2 2 0
Onb BD J M Dom D-Push Pivot 1 9 102 21
Alsi BD J F None D-Push Pivot 4 13 2 0
Piep BD J F None D-Push Pivot 8 19 1 0
Gar NH J M Dom D-Pivot Pivot 7 0 81 11
M30 NH A M None D-Pivot Pivot 2 4 185 18
Pari NH A F None D-Pivot Pivot 5 6 8 0
Pue NH J M None D-Pivot Pivot 12 15 201 2
Xer NH J M None D-Pivot Pivot 12 7 3 0
Gla NH J M Dom D-Pivot Pivot 21 0 5 0
Troi NH A F None D-Pivot Pivot 1 4 1 0
39
Jun NH J M None D-Pivot Push 33 3 0 2
Pret NH A F None D-Pivot Pivot 8 0 1 0
Lom NH J M None D-Pivot Pivot 9 9 1 0
Ulu NH J M None D-Pivot Pivot 13 2 36 40
Bras NH A F Low D-Pivot Pivot 5 12 21 1
Reev NH J F None D-Pivot Pivot 6 3 3 1
Fluf NH A M None D-Pivot Pivot 0 0 1 0
Dar LT J M NA Control Push NA NA 1 3
Len LT J M NA Control Push NA NA 0 1
Liz LT A F NA Control Pivot NA NA 14 2
Mna LT A M NA Control Pivot NA NA 36 113
Noa LT J M NA Control Push NA NA 2 5
Vin LT A M NA Control Push NA NA 0 1
Avo KB J M None L-Push Push NA 8 15 15
Lif KB A M None L-Push Push NA 2 11 24
Tang KB A F None L-Push Push NA 1 1 8
40 Figures
694
695
Figure 1: The average number of demonstrations for which observers were watching within 5 696
metres of the (a & b) dominant demonstrators and (c & d) low-ranking demonstrators, as shown 697
by the observer’s (a) rank, (b) age, (c) kinship to the models (d) sex and age. Shaded area 698
represents 95% confidence interval. Boxplots show median, interquartile range, maximum and 699
minimum values and outliers represented by dots. 700