R E S E A R C H A R T I C L E
Open Access
Predicting
b-turns and their types using
predicted backbone dihedral angles and
secondary structures
Petros Kountouris, Jonathan D Hirst
*Abstract
Background:b-turns are secondary structure elements usually classified as coil. Their prediction is important, because of their role in protein folding and their frequent occurrence in protein chains.
Results:We have developed a novel method that predictsb-turns and their types using information from multiple sequence alignments, predicted secondary structures and, for the first time, predicted dihedral angles. Our method uses support vector machines, a supervised classification technique, and is trained and tested on three established datasets of 426, 547 and 823 protein chains. We achieve a Matthews correlation coefficient of up to 0.49, when predicting the location ofb-turns, the highest reported value to date. Moreover, the additional dihedral
information improves the prediction ofb-turn types I, II, IV, VIII and“non-specific”, achieving correlation coefficients up to 0.39, 0.33, 0.27, 0.14 and 0.38, respectively. Our results are more accurate than other methods.
Conclusions:We have created an accurate predictor ofb-turns and their types. Our method, called DEBT, is available online at http://comp.chem.nottingham.ac.uk/debt/.
Background
Secondary structure can provide important information about three-dimensional protein structure. Therefore, its prediction has been an area of intense research over the past three decades. To predict secondary structure many methods have been implemented, including different machine learning techniques, such as artificial neural networks (ANNs) [1,2] and support vector machines (SVMs) [3-5], and different input schemes, such as posi-tion specific scoring matrices (PSSMs) [2] and hidden Markov models [6]. Notably, the predictive accuracy reached 80% for three-state prediction, where residues are divided into helix, strand and coil. Helices and strands are repetitive, regular structures, while the remaining residues, which can be tight turns, loops, bulges or random coil, are all classified as coil; they are non-repetitive, irregular secondary structures [7]. Although the helix and strand classes are structurally well-defined, the third class, coil, does not provide any detailed structural information. Hence, further analysis
of the local structure is necessary, such as prediction of backbone dihedral angles [5,8] and prediction of tight turns [9].
Tight turns play an important role in protein folding and stability. They are partly responsible for the com-pact, globular shape of proteins, because they provide directional change to the polypeptide chain [10]. Depending on the number of constituent residues, tight turns can be classified as a-turns,b-turns, g-turns,δ -turns orπ-turns. A b-turn is formed by four adjacent residues, which are not in ana-helix, where the distance between Ca(i) and Ca(i+ 3) is less than 7 Å [9]. The
b-turns are the most common tight b-turns. On average, about a quarter of all residues are in a b-turn [11]. Moreover,b-turns are crucial components ofb-hairpins, the fundamental elements of anti-parallel b-sheets, whose prediction has recently attracted interest [12-14]. Furthermore,b-turn formation is an important step in protein folding [15], while improvedb-turn sequences can improve protein stability [16,17]. Additionally, their occurrence on the surface of proteins suggests their involvement in molecular recognition processes and their interactions between peptide substrates and
* Correspondence: [email protected]
School of Chemistry, University of Nottingham, University Park, Nottingham NG7 2RD, UK
receptors [18]. Recently, mimicking b-turns for the synthesis of medicines [19,20] or for nucleatingb-sheet folding [21] has also attracted interest. Thus, the predic-tion ofb-turns can facilitate three-dimensional structure prediction and can provide important information about the protein folding. Hutchinson and Thornton [22] clas-sified theb-turns into nine types based on the dihedral angles of residuesi + 1 andi + 2 in the turn (table 1). This is the most established classification ofb-turns.
Prediction ofb-turns has attracted interest in the past. The approaches can be divided into statistical methods and machine learning techniques. The former include early methods which used amino acid propensities [23-27] as well as more recent methods, like COUDES [28], which used probabilities with multiple sequence alignments. Over the past few years, machine learning techniques have been applied successfully to predict b-turns. Since their first use [29], ANNs have been fre-quently used for b-turn prediction [30-32]. Over the past decade, several studies used SVMs to predict b-turns [33-37] and other techniques, such as nearest neighbour, have been applied recently [38]. Through the use of evolutionary information and more sophisticated machine learning techniques, the correlation coefficient for turn/non-turn prediction is now as high as 0.47 [34]. Other methods predict the type ofb-turn, rather than the location of the turn in the chain, with significant success, even though this problem is challenging, due to the lack of examples for manyb-turn types. BTPRED [30], BetaTurns [39], MOLEBRNN [32] and the method of Asgary and colleagues [40] are ANN-based, whereas COUDES [28] uses amino acid propensities with multi-ple sequence alignments. In spite of its successful use for the prediction ofb-turn location [34,37], the SVM method has not been employed widely for b-turn type prediction.
Despite the success so far, there is a need for more accurate predictions of bothb-turn location andb-type, which could be realised through the use of additional information. Evolutionary information from multiple alignments [31] as well as predicted secondary struc-tures [30] can improveb-turn predictions dramatically. In this work, we show that the backbone dihedral angles can provide crucial information for turn/non-turn pre-diction and can also noticeably improve the prepre-diction ofb-turn types, since the types are defined by the dihe-dral angles of the central residues. Predicted dihedihe-dral angles have been used successfully for secondary struc-ture prediction [5,41]. The method presented here, called DEBT (Dihedrally Enhanced Beta Turn predic-tion), uses predicted secondary structures and predicted dihedral angles from DISSPred [5] and achieves the highest correlation coefficient reported to date for turn/ non-turn prediction, while the prediction of b-turn types is, in most cases, more accurate than other con-temporary methods. The method predicts b-turn type I, II, IV, VIII as defined by Hutchinson and Thornton [22], while all remaining types are classified as NS (non-specific). Moreover, we show that using a small local window of predicted secondary structures and dihedral angles, rather than using the predictions of one indivi-dual residue, is beneficial.
Methods
Datasets
[image:2.595.56.291.560.696.2]DEBT was trained and tested on four non-redundant datasets, which contain chains with at least oneb-turn and have X-ray crystallographic resolution better than 2.0 Å. All protein chains have less than 25% sequence similarity, to ensure that there is very little homology in the training set. The first dataset, denoted as GR426 in this paper, consists of 426 protein chains [42] and was used to study the impact of various training schemes and to tune the kernel parameters. GR426 has been used by the majority of recentb-turn prediction meth-ods and, therefore, we can use it to make direct compar-isons. In 2002, the GR426 dataset was used for the evaluation ofb-turn prediction methods [43] and was partitioned into seven subsets in order to perform seven-fold cross-validation. In this work, we utilised the same partition for the cross-validation. After finding the optimal input scheme and tuning the kernel parameters, we used two additional datasets, constructed for training and testing COUDES [28], to validate the performance of our method. The datasets consist of 547 and 823 pro-tein chains and are denoted as FA547 and FA823, respectively. Finally, DEBT’s web-server was trained using PDB-Select25 (version October 2008) [44], a set of 4018 chains from the PDB with less than 25% sequence similarity. From these chains, we have selected those Table 1 The dihedral angles ofb-turn types [22]
Turn type Dihedral angles (°)
ji+ 1 ψi+ 1 ji+ 2 ψi+ 2
I -60 -30 -90 0
I’ 60 30 90 0
II -60 120 80 0
II’ 60 -120 -80 0
IV -61 10 -53 17
VIa1 -60 120 -90 0
Via2 -120 120 -60 0
VIb -135 135 -175 160
VIII -60 -30 -120 120
that contain at least one b-turn and have an X-ray crys-tallographic resolution below 2.0 Å. This gave a dataset of 1296 protein chains, denoted as PDB1296 in this arti-cle, which is the largest training set used for ab-turn prediction server. The PDB codes and chain identifiers of the above datasets are listed at DEBT’s website http:// comp.chem.nottingham.ac.uk/debt/. The b-turns and their types were assigned using the PROMOTIF pro-gram [45]. In this work, we predictb-turn types I, II, IV, VIII, while all the remaining types are assigned to the miscellaneous class NS (non-specific). Table 2 shows the distributions ofb-turns and their types in each dataset.
DEBT method utilises PSSMs, constructed by the PSI-BLAST algorithm [46], to predict b-turns and their types. PSSMs haveN× 20 elements, where theNrows correspond to the length of the amino acid sequence and the columns correspond to the 20 standard amino acids. PSSMs represent the log-likelihood of a particular residue substitution, usually based on a weighted aver-age of BLOSUM62 [47]. We generated the PSSMs using the BLOSUM62 substitution matrix with an E-value of 0.001 and three iterations against a non-reduntant (nr) database, which was downloaded in February 2009. The data were filtered by pfilt[48] to remove low complexity regions, transmembrane spans and coiled coil regions. The PSSM values were linearly scaled simply by dividing them by ten. Typically, PSSM values are in the range [-7,7], but some values outside this range may appear. Linear scaling maintains the same distribution in the input data and helps avoid numerical difficulties during training.
Support Vector Machines
DEBT employs SVM [49], a state-of-the-art supervised learning technique. The SVM method has become an area of intense research, because it performs well with real-world problems, it is simple to understand and implement and, most importantly, it finds the global solution, while other methods, like ANNs, have several local solutions [50]. The SVM can find non-linear boundaries between two classes by using a kernel func-tion, which maps the data from the input space into a richer feature space, where linear boundaries can be implemented. Furthermore, the SVM effectively handles
large feature spaces, since it does not suffer from the
“curse of dimensionality”, and, therefore, avoids overfit-ting, a common drawback of supervised learning techniques.
A detailed description of the SVM algorithm can be found in various textbooks [50-52]. In brief, given input vectorsxiÎ Rnand output valuesyiÎ {-1, 1}, the
fun-damental goal of a binary SVM classifier is to solve the following optimisation problem:
minimise
subject to for
1 2
1 0
2
1
w w xi
+
+ ≥ −= >
∑
Cy b
i i
m
i i i
( . ) ,
(1)
wherewis a vector perpendicular to the hyperplane,b
is the offset from the origin and C is a penalty para-meter for each misclassification. Thus, it controls the trade-off between training error and the margin that separates the two classes. The kernel function used in our case is the radial basis function (RBF), shown in equation 2, which was successfully used for complex problems, such as secondary structure prediction [3] and dihedral prediction [5].
K(x xi, j)=exp(−(xi−xj) ),2 for >0 (2) where xi andxj are the input vectors for instances i
and j, respectively, and g is a parameter that controls the width of the kernel.
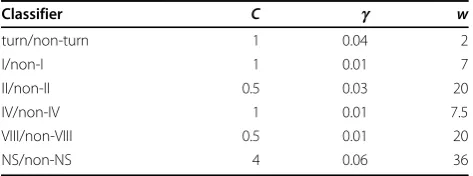
[image:3.595.304.541.634.722.2]LibSVM [53], a popular SVM software package, was employed for the training and testing of the SVM classi-fiers. In order to get the optimal predictive performance, we optimised three parameters: C (equation 1),g (equa-tion 2) andw. The latter controls the cost of misclassifi-cation for the minority class and, therefore, reduces the effect of the imbalance in the datasets. In other words, different penalty parameters costs are used for each class [54]. The optimised parameters for each classifier are shown in table 3. Seven-fold cross-validation was applied on datasets GR426, FA547 and FA823. For the former, we utilised the the same subsets used by Kaur and Raghava [55] to evaluate differentb-turn prediction
Table 2 Distribution of residues inb-turns and their types in different datasets
b-turn types
Dataset b-turns (%) I (%) II (%) IV (%) VIII (%) NS (%)
GR426 23.5 9.3 3.8 9.4 2.7 2.4 FA547 23.1 9.1 3.7 9.1 2.8 2.5 FA823 22.0 8.9 3.6 8.8 2.5 2.6 PDB1296 21.0 8.9 3.4 8.2 2.5 2.7
Table 3 Optimised parameters for each SVM classifier used in DEBT.
Classifier C g w
turn/non-turn 1 0.04 2
I/non-I 1 0.01 7
II/non-II 0.5 0.03 20
IV/non-IV 1 0.01 7.5
VIII/non-VIII 0.5 0.01 20
NS/non-NS 4 0.06 36
[image:3.595.57.292.656.731.2]methods, whereas the partition of the other two datasets was identical to the one used to train COUDES [28].
DEBT architecture
Figure 1 shows the architecture of the method. DEBT uses two different local windows around the residue to be predicted: one, l1, of nine residues for the PSSM
values and a second,l2, of five residues for the predicted
[image:4.595.60.538.86.540.2]secondary structures and dihedral angles, both centred around the residue to be predicted. DISSPred [5] is used to predict both three-state secondary structure and the dihedral angles. DISSPred uses different partitions of the j-ψspace created by two unsupervised clustering algo-rithms and both the algorithm and the number of clus-ters can be adjusted by the user. Subsequently, DISSPred predicts the secondary structure and the
Figure 1The architecture of ourb-turn location andb-turn type prediction method. An example of an input sequence is provided at the top. Around each residue to be predicted (shown in red), two local windows are used. One,l1, has a size of nine residues and is used for the
PSSM values, while the other,l2, takes in account the predicted secondary structures and dihedral angles for five residues. After running
PSI-BLAST [46], the PSSM values are linearly scaled and transformed into a vector of 180 attributes (i.e. a local window of nine residues,l1). DISSPred
[5] utilises PSSMs to predict three-state secondary structures and seven-state dihedral angles, which are transformed into a vector of 50 attributes using a window of five residues (l2). The two vectors are merged to create the final input vector for the SVM classifiers. Lastly, the predictions are
dihedral angles using an iterative process. For each resi-due in windowl2, the predicted secondary structures are
encoded using three binary attributes, one for each state: (1,0,0) for helix, (0,1,0) for strand and (0,0,1) for coil. The dihedral angles are predicted by DISSPred using a partition of seven clusters and, therefore, are encoded similarly using seven binary attributes. Thus, the input vectors of the SVM classifiers have 230 attri-butes: 180 attributes for the PSSM values, 15 attributes for the predicted secondary structures and 35 attributes for the predicted dihedral clusters. We used the same architecture for both turn/non-turn prediction and b-turn type prediction.
Filtering
Because the prediction is based on individual residues, the SVM outputs include someb-turns that are shorter than four residues, which is unrealistic. Turn predictions longer than four adjacent residues are acceptable, since there are manyb-turns in the dataset that are overlap-ping. In fact, about 58% are multiple turns [22]. To ensure that the predictions are at least four residue long, we applied some filtering rules similar to the
“state-flipping” rule described by Shepherd and collea-gues [30]. The rules are applied with the following order: (1) flip isolated non-turn predictions to turn (tnt ® ttt), (2) flip isolated turn predictions to non-turn (ntn® nnn), (3) flip isolated turn pairs of turn predic-tion to non-turn (nttn®nnnn) and (4) flip the adjacent non-turn predictions to turn for isolated three consecu-tive turn predictions (ntttn®ttttt).
Prediction accuracy assessment
Six different scalar measures were used to assess DEBT’s performance. All of them can be derived from two or more of the following quantities: (1) true positives,pi, is
the number of correctly classifiedb-turns or b-turn type
i, (2) true negatives, ni, is the number of correctly
classi-fied non-turns, (3) false positives, oi, is the number of
non-turns incorrectly classified asb-turns orb-turn type
i(over-predictions), (4) false negatives,ui, is the number
ofb-turns or b-turn type i incorrectly classified as non-turn (under-predictions) and (5) total number of resi-dues, t= pi +ni +oi +ui, where i = I, II, IV, VIII or
NS. The first measure used is the predictive accuracy, the percentage of correctly classified residues.
Q pi ni t
i=100× + (3)
Two measures, that are usually used together, are sen-sitivity (also labelled as Qobsin some articles) and
speci-ficity which give the percentage of observed b-turns or b-turn types that are predicted correctly and the
percentage of observed non-turns that are predicted cor-rectly, respectively. The optimal is to equalise the two measures.
Sensitivity= × +
100 pi
pi ui (4)
Specificity= × +
100 ni
ni oi (5)
We report the commonly used Matthews correlation coefficient (MCC) [56], which is the most robust mea-sure forb-turn prediction. The reason is that, when the dataset is unbalanced, it is possible to achieve high pre-dictive accuracy just by predicting all instances as non-turn. The MCC, defined by equation 6, is a number between -1 and 1, with perfect correlation giving a coef-ficient equal to 1. Therefore, a higher MCC corresponds to a better predictive performance.
MCC p n o u
p o p u n o n u
i i i i i
i i i i i i i i
= −
+ ⋅ + ⋅ + ⋅ +
⋅ ⋅
( ) ( ) ( ) ( ) (6)
Finally, we report Qpred, the percentage ofb-turn
pre-dictions that are correct:
Q p
p o
i i i
pred = ×
+
100 (7)
Another important consideration is whether the classi-fiers perform better than random prediction. Herein, we report a normalised percentage better than random (Si),
defined in equation 8, which was introduced by Shep-herd and colleagues [30]. Perfect predictions score Si=
100%, whereas Si = 0% shows that the prediction is no
better than random.
S p n R
t R
i= × + −
−
100 i i (8)
where R is the expected number of residues that would be predicted correctly by a random prediction and is defined as:
R p o p u n o n u
t
i= i+ i i+ i + i+ i i+ i
( )( ) ( )( )
(9)
(AUC) is calculated to provide a scalar measure of the ROC analysis and compare different methods. The tra-pezium rule is used to calculate the AUC, as described by Fawcett [58].
Results and Discussion
The effect of the input scheme
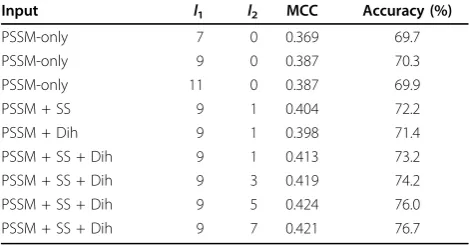
Before optimising the SVM classifiers, we tried different input schemes, which showed that the combination of evolutionary information (PSSMs), predicted secondary structures and predicted dihedral angles gives the most accurate predictions. Table 4 shows the results on the GR426 dataset from the experiments using various input schemes and different window sizes for the turn/non-turn classifier. Firstly, we changed the size of the PSSM window,l1, by using lengths of seven, nine and eleven
residues. The last two sizes give the highest MCC value. We selected a window size of nine residues, because the input vector is smaller and, therefore, the training time is shorter. Subsequently, we augmented the PSSM-only input vector with additional attributes only for the cen-tral residue (i.e.l2 = 1) using predicted secondary
struc-tures, predicted dihedral angles or both. The results show that, when used together, predicted secondary structures and dihedral angles achieve the best perfor-mance. Finally, we changed the size of the second win-dow,l2, using three, five or seven residues. The optimal
window size is five residues. The same window sizes,l1
andl2, were utilised for all classifiers.
Turn/non-turn prediction
Predicted dihedral angles and secondary structures improve the performance of the turn/non-turn classifier, as shown in table 5. In fact, the MCC shows an improvement of over 10% and reaches values of 0.48,
0.49 and 0.48 for datasets GR426, FA547 and FA823, respectively. Moreover, the overall accuracy is higher than 80% for datasets FA547 and FA823, while it is 79.2% for the GR426 dataset. Finally, Qpred,Qobs
(sensi-tivity) and the better-than-random score, S, also improved after using predicted dihedral angles and sec-ondary structures.
Table 6 compares the DEBT’s predictive performance with other turn/non-turn predictors in the literature on the established datasets GR426, FA547 and FA823, sorted by the reported MCC score. The comparison is based on the MCC value, because it is the most robust measure, particularly when the dataset is unbalanced. Our achieved MCC values are the highest reported to date on all datasets. Interestingly, the methods by Zheng and Kurgan [34] and by Hu and Li [37], which report the second highest MCC score (0.47) on the GR426 dataset, are also SVM-based, which highlights the super-iority of the SVM method compared to other machine learning techniques forb-turn prediction. Moreover, our method achieves a high MCC score by using a single SVM model, without any preprocessing, feature selec-tion or predicselec-tions from multiple secondary structure or dihedral prediction methods, which may, potentially, improve the results. DEBT’s performance using other measures is also one of the highest in the literature with overall accuracy around 80% and the Qpred and Qobs
scores around 55% and 70%, respectively. These mea-sures can vary depending on the balance of the dataset and the selected SVM parameters (table 3), which we optimised based on the more robust MCC score.
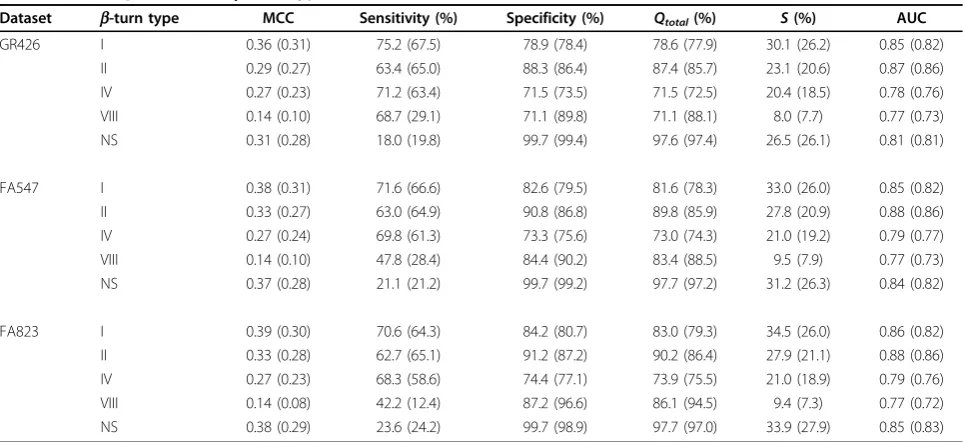
Prediction ofb-turn types
[image:6.595.56.291.549.672.2]Table 7 shows the performance of our method for the prediction ofb-turn types on three different datasets. Notably, the MCC score increases dramatically when we augment the input vector with a local window of pre-dicted dihedral angles and secondary structures. The improvement of the MCC score is at least 16%, 7%, 17%, 40% and 11% for types I, II, IV, VIII and NS, respectively, on all datasets. The explanation for the dramatic Table 4 Experiments on the GR426 dataset with different
input schemes.
Input l1 l2 MCC Accuracy (%)
PSSM-only 7 0 0.369 69.7
PSSM-only 9 0 0.387 70.3
PSSM-only 11 0 0.387 69.9
PSSM + SS 9 1 0.404 72.2
PSSM + Dih 9 1 0.398 71.4
PSSM + SS + Dih 9 1 0.413 73.2 PSSM + SS + Dih 9 3 0.419 74.2 PSSM + SS + Dih 9 5 0.424 76.0 PSSM + SS + Dih 9 7 0.421 76.7
[image:6.595.304.539.618.705.2]Window sizes,l1andl2, are the windows for PSSM values and predicted secondary structures and/or dihedral angles, respectively. PSSM-only: only scaled PSSM values are used in the input vector; PSSM + SS: the input vector is augmented with predicted secondary structures; PSSM + Dih: the input vector is augmented with predicted dihedral angles; PSSM + SS + Dih: the input vector is augmented with both predicted secondary structures and predicted dihedral angles.
Table 5 Performance of DEBT for the prediction ofb-turn location on three datasets.
Dataset MCC Qtotal
(%)
Qpred
(%)
Qobs(%) S AUC GR426 0.48 (0.43) 79.2 (78.6) 54.8 (53.9) 70.1 (61.6) 47.5 (43.2) 0.84 (0.83) FA547 0.49 (0.44) 80.0 (79.2) 55.9 (54.5) 68.7 (60.5) 48.3 (43.6) 0.85 (0.83) FA823 0.48 (0.42) 80.9 (79.9) 55.9 (54.1) 66.1 (56.5) 48.0 (42.3) 0.84 (0.82)
improvement of the prediction of some types, such as types I and VIII, can be derived from their dihedral angles (table 1). These types have negativejandψangles and, hence, their structure is closer to a helical conforma-tion, which is more accurately predicted by DISSPRED [5]. Therefore, more accurate secondary structure and dihedral predictions lead to more accurateb-turn type predictions. DEBT’s predictive accuracy is over 70% for all types, with the caveat that it is not a reliable measure when the dataset is unbalanced. The prediction of the NS class with the highest MCC score clearly reflects the under-predictions, since the specificity is high and the sensitivity is low. When we attempted to equalise the two measures on the GR426 dataset, the MCC value dropped to 0.22, with the sensitivity and specificity at 68.5% and 84.3%, respectively. For all datasets, the better-than-ran-dom scores,S, are higher than 20% for allb-turn types except type VIII. On the GR426 dataset, DEBT’s achieved
Sscores of 30.1%, 23.1%, 20.4% and 26.2% for types I, II, IV and NS, respectively, are noticeably higher than the scores reported by BTPRED [30] and BetaTurns [39]. The former achieved better-than-random scores of 18.1%, 18.9%, 4.5% and 2.6% for types I, II, VIII and IV, respectively, while BetaTurns reported values of 19.1%, 23.2%, 12.4%, 1.8% and 6.1% for types I, II, IV, VIII and NS, respectively.
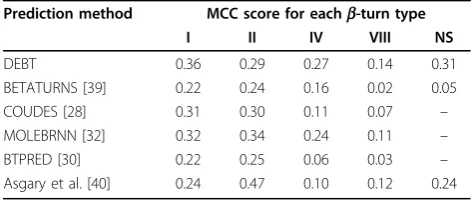
[image:7.595.56.291.111.402.2]Table 8 compares the performance of b-turn predic-tion with other methods in the literature based on the GR426 dataset. DEBT outperforms other contemporary Table 6 Comparison of DEBT with other turn/non-turn
prediction methods on three different datasets.
Dataset b-turn predictor MCC Qtotal
(%) Q(%)pred Q(%)obs
GR426 DEBT 0.48 79.2 54.8 70.1 Zheng and Kurgan
[34]
0.47 80.9 62.7 55.6
Hu and Li [37] 0.47 79.8 55.6 68.9 Zhang et al. [35] 0.45 77.3 53.1 67.0 BTSVM [36] 0.45 78.7 56.0 62.0 MOLEBRNN [32] 0.45 77.9 53.9 66.0 BETAPRED2 [31] 0.43 75.5 49.8 72.3 COUDES [28] 0.42 74.8 48.8 69.9 Kim [38] 0.40 75.0 46.5 66.7 BTPRED [30] 0.35 74.4 48.3 57.3
FA547 DEBT 0.49 80.0 55.9 68.7 Zheng and Kurgan
[34]
0.45 80.5 61.6 54.2
COUDES [28] 0.42 74.6 48.7 70.4 Hu and Li [37] 0.43 76.6 47.6 70.2
FA823 DEBT 0.48 80.9 55.9 66.1 Zheng and Kurgan
[34]
0.45 80.6 60.8 54.6
COUDES [28] 0.41 74.2 47.5 69.6 Hu and Li [37] 0.45 76.8 53.0 72.3
[image:7.595.57.540.492.713.2]The methods are sorted by their reported MCC score. DEBT achieves the highest value on all datasets.
Table 7 DEBT’s prediction ofb-turn types on three different datasets.
Dataset b-turn type MCC Sensitivity (%) Specificity (%) Qtotal(%) S(%) AUC GR426 I 0.36 (0.31) 75.2 (67.5) 78.9 (78.4) 78.6 (77.9) 30.1 (26.2) 0.85 (0.82)
II 0.29 (0.27) 63.4 (65.0) 88.3 (86.4) 87.4 (85.7) 23.1 (20.6) 0.87 (0.86) IV 0.27 (0.23) 71.2 (63.4) 71.5 (73.5) 71.5 (72.5) 20.4 (18.5) 0.78 (0.76) VIII 0.14 (0.10) 68.7 (29.1) 71.1 (89.8) 71.1 (88.1) 8.0 (7.7) 0.77 (0.73) NS 0.31 (0.28) 18.0 (19.8) 99.7 (99.4) 97.6 (97.4) 26.5 (26.1) 0.81 (0.81)
FA547 I 0.38 (0.31) 71.6 (66.6) 82.6 (79.5) 81.6 (78.3) 33.0 (26.0) 0.85 (0.82) II 0.33 (0.27) 63.0 (64.9) 90.8 (86.8) 89.8 (85.9) 27.8 (20.9) 0.88 (0.86) IV 0.27 (0.24) 69.8 (61.3) 73.3 (75.6) 73.0 (74.3) 21.0 (19.2) 0.79 (0.77) VIII 0.14 (0.10) 47.8 (28.4) 84.4 (90.2) 83.4 (88.5) 9.5 (7.9) 0.77 (0.73) NS 0.37 (0.28) 21.1 (21.2) 99.7 (99.2) 97.7 (97.2) 31.2 (26.3) 0.84 (0.82)
FA823 I 0.39 (0.30) 70.6 (64.3) 84.2 (80.7) 83.0 (79.3) 34.5 (26.0) 0.86 (0.82) II 0.33 (0.28) 62.7 (65.1) 91.2 (87.2) 90.2 (86.4) 27.9 (21.1) 0.88 (0.86) IV 0.27 (0.23) 68.3 (58.6) 74.4 (77.1) 73.9 (75.5) 21.0 (18.9) 0.79 (0.76) VIII 0.14 (0.08) 42.2 (12.4) 87.2 (96.6) 86.1 (94.5) 9.4 (7.3) 0.77 (0.72) NS 0.38 (0.29) 23.6 (24.2) 99.7 (98.9) 97.7 (97.0) 33.9 (27.9) 0.85 (0.83)
methods for the prediction of type I, IV, VIII and NS. Our achieved MCC score is higher by at least 12.5% for types I and IV and by at least 27% and 29% for types VIII and NS, respectively. The performance highlights the importance of predicted dihedral angles inb-turn type prediction, since they are defined by the dihedral angles of the central residues (table 1). The prediction of type II is the only one that does not achieve a MCC score as high as some other methods. MOLEBRNN [32] and - using different dataset - the method by Asgary and co-workers [40] report higher MCC values, while COUDES [28] reports an MCC of 0.30, which is slightly higher than our achieved value of 0.29. However, DEBT achieves a comparable MCC of 0.33 for the prediction of type II using datasets FA547 and FA823, which gen-erally give higher MCC values than GR426 forb-turn type prediction (see table 7).
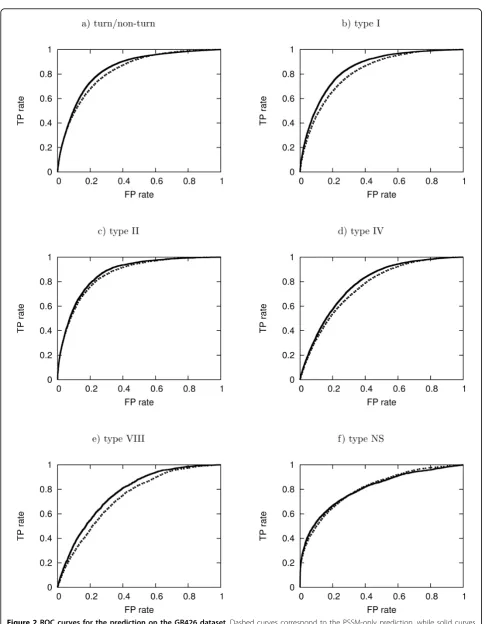
ROC analysis
Figure 2 illustrates the ROC curves for turn/non-turn prediction and b-turn type prediction before and after using predicted secondary structures and dihedral angles on the GR426 dataset. The ROC curves on datasets FA547 and FA823 are shown in additional file 1. The corresponding areas under the curves were calculated and are presented in tables 5 and 7 for turn/non-turn prediction and b-turn type prediction, respectively. The improvement in the results highlights the utility of pre-dicted dihedral angles and secondary structure in both turn/non-turn andb-turn type prediction methods.
DEBT web-server
Our method is freely available online at http://comp. chem.nottingham.ac.uk/debt/. The web-server was trained using a large training set of 1296 protein chains with at least oneb-turn to improve the performance of the method. It is written in Perl using a CGI interface. The user can either cut and paste the amino acid sequence or upload a FASTA file. Additionally, multiple FASTA files can be uploaded in an archive. Initially,
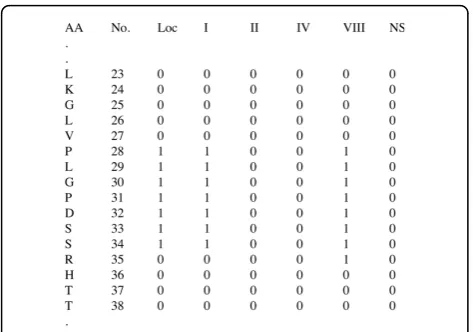
DEBT firstly runs the PSI-BLAST algorithm [46] to con-struct the PSSMs and DISSPred [5] to predict the sec-ondary structures and the dihedral angles. Subsequently, the results are merged to create the input file for six SVM classifiers. The output file, shown in figure 3, con-tains the number and the one-letter abbreviation of the amino acids with six binary prediction values: one for turn/non-turn prediction and five for theb-turn types. The prediction value can be “1” if the corresponding residues is predicted in a b-turn/b-turn type and “0” otherwise. Moreover, the user can ask for DISSPred’s results to be attached in the output file, which makes DEBT not only a b-turn prediction server, but also a three-state secondary structure prediction and a seven-state dihedral prediction interface. The output file, together with the log files, are sent to the user by e-mail, or can be downloaded, after the calculations are completed. The combination of DISSPred’s iterative pro-cess with the training on a large dataset makes DEBT web-server slightly slower, but more accurate, than otherb-turn prediction servers.
Conclusions
[image:8.595.55.291.111.211.2]In this article, we presented a method that predicts the location of b-turns and their types in a protein chain. Our method uses predicted dihedral angles from DISSPred [5] to enhance the predictions. Moreover, we improved the predictive performance by using a local window of predicted secondary structures and dihedral angles, rather than the predictions for one individual residue. The MCC of 0.48, achieved for turn/non-turn prediction on a set of 426 non-redundant proteins, shows that DEBT is more accurate than other b-turn prediction methods. Moreover, we report the highest MCCs of 0.49 and 0.48 on two larger datasets of 547 and 823 non-redundant protein chains. Additionally, the dihedrally enhanced prediction for b-turn types is more accurate than other methods. We report DEBT’s predic-tion on three datasets with achieved MCCs up to 0.39, 0.33, 0.27, 0.14 and 0.38 forb-turn types I, II, IV, VIII and NS, respectively. The prediction ofb-turn types has limitations derived from the observation that identical tetrapeptides may form different b-turn types. In fact, around 15% of all tetrapeptides that form b-turns in datasets GR426 and FA547 appear in multiple b-turn types. This number is close to 18% in the FA823 dataset. A detailed analysis of the fundamental limitation of b-turn prediction is a challenging future focus. In spite of the limitations, the performance might be improved further by applying techniques introduced by other stu-dies, such as feature selection techniques [34], or by using predicted secondary structures and dihedral angles from multiple predictors. Predictedb-turns can be used Table 8 Performance of DEBT and otherb-turn type
prediction methods based on the achieved MCC value.
Prediction method MCC score for eachb-turn type
I II IV VIII NS
DEBT 0.36 0.29 0.27 0.14 0.31
BETATURNS [39] 0.22 0.24 0.16 0.02 0.05 COUDES [28] 0.31 0.30 0.11 0.07 – MOLEBRNN [32] 0.32 0.34 0.24 0.11 – BTPRED [30] 0.22 0.25 0.06 0.03 – Asgary et al. [40] 0.24 0.47 0.10 0.12 0.24
to improve secondary structure prediction [59] and we are currently exploring this.
Additional material
Additional file 1: ROC curves for datasets FA547 and FA823. ROC curves for the predictions on datasets FA547 and FA823, before and after using predicted dihedral angles and secondary structures. Dashed curves correspond to the PSSM-only prediction, while solid curves correspond to the prediction after aumenting the input vector with predicted dihedral angles and secondary structures.
Acknowledgements
We thank the HPC facility at the University of Nottingham and the University of Nottingham for a PhD studentship.
Authors’contributions
PK carried out the experiments and wrote the manuscript. JDH conceived the study and assisted in writing the manuscript. Both authors read and approved the final manuscript for publication.
Received: 12 May 2010 Accepted: 31 July 2010 Published: 31 July 2010
References
1. Rost B, Sander C:Prediction of protein secondary structure at better than 70% accuracy.J Mol Biol1993,232(2):584-599.
2. Jones DT:Protein secondary structure prediction based on position-specific scoring matrices.J Mol Biol1999,292(2):195-202.
3. Hua S, Sun Z:A novel method of protein secondary structure prediction with high segment overlap measure: support vector machine approach. J Mol Biol2001,308(2):397-407.
4. Karypis G:YASSPP: Better kernels and coding schemes lead to improvements in protein secondary structure prediction.Proteins2006, 64(3):575-586.
5. Kountouris P, Hirst JD:Prediction of backbone dihedral angles and protein secondary structure using support vector machines.BMC Bioinformatics2009,10:437.
6. Karplus K, Barrett C, Cline M, Diekhans M, Grate L, Hughey R:Predicting protein structure using only sequence information.Proteins1999, ,Suppl 3:121-125.
7. Richardson JS:The anatomy and taxonomy of protein structure.Adv Protein Chem1981,34:167-339.
8. Dor O, Zhou Y:Real-SPINE: an integrated system of neural networks for real-value prediction of protein structural properties.Proteins2007, 68:76-81.
9. Chou KC:Prediction of tight turns and their types in proteins.Anal Biochem2000,286:1-16.
10. Marcelino AMC, Gierasch LM:Roles of beta-turns in protein folding: from peptide models to protein engineering.Biopolymers2008,89(5):380-391. 11. Kabsch W, Sander C:Dictionary of protein secondary structure: pattern
recognition of hydrogen-bonded and geometrical features.Biopolymers 1983,22(12):2577-2637.
12. de la Cruz X, Hutchinson EG, Shepherd A, Thornton JM:Toward predicting protein topology: an approach to identifying beta hairpins.Proc Natl Acad Sci USA2002,99(17):11157-11162.
13. Kuhn M, Meiler J, Baker D:Strand-loop-strand motifs: prediction of hairpins and diverging turns in proteins.Proteins2004,54(2):282-288. 14. Kumar M, Bhasin M, Natt NK, Raghava GPS:BhairPred: prediction of
beta-hairpins in a protein from multiple alignment information using ANN and SVM techniques.Nucleic Acids Res2005, ,33 Web Server:W154-W159. 15. Takano K, Yamagata Y, Yutani K:Role of amino acid residues at turns in
the conformational stability and folding of human lysozyme.Biochemistry 2000,39(29):8655-8665.
16. Trevino SR, Schaefer S, Scholtz JM, Pace CN:Increasing protein conformational stability by optimizing beta-turn sequence.J Mol Biol 2007,373:211-218.
17. Fu H, Grimsley GR, Razvi A, Scholtz JM, Pace CN:Increasing protein stability by improving beta-turns.Proteins2009,77(3):491-498. 18. Rose GD, Gierasch LM, Smith JA:Turns in peptides and proteins.Adv
Protein Chem1985,37:1-109.
19. Müller G, Hessler G, Decornez HY:Areb-turn mimetics mimics ofb-turns? Angew Chem Int Ed Engl2000,39(5):894-896.
20. Kee KS, Jois SDS:Design ofb-turn based therapeutic agents.Curr Pharm Des2003,9(15):1209-1224.
21. Fuller AA, Du D, Liu F, Davoren JE, Bhabha G, Kroon G, Case DA, Dyson HJ, Powers ET, Wipf P, Gruebele M, Kelly JW:Evaluating beta-turn mimics as beta-sheet folding nucleators.Proc Natl Acad Sci USA2009,
106(27):11067-11072.
22. Hutchinson EG, Thornton JM:A revised set of potentials forb-turn formation in proteins.Protein Sci1994,3(12):2207-2216.
23. Chou PY, Fasman GD:Conformational parameters for amino acids in helical,b-sheet, and random coil regions calculated from proteins. Biochemistry1974,13(2):211-222.
24. Wilmot CM, Thornton JM:Analysis and prediction of the different types ofb-turn in proteins.J Mol Biol1988,203:221-232.
25. Wilmot CM, Thornton JM:b-turns and their distortions: a proposed new nomenclature.Protein Eng1990,3(6):479-493.
26. Chou KC, Blinn JR:Classification and prediction ofb-turn types.J Protein Chem1997,16(6):575-595.
27. Zhang C, Chou K:Prediction ofb-turns in proteins by 1-4 and 2-3 correlation model.Biopolymers1997,41(6):673-702.
28. Fuchs PFJ, Alix AJP:High accuracy prediction ofb-turns and their types using propensities and multiple alignments.Proteins2005,59(4):828-839. 29. McGregor MJ, Flores TP, Sternberg MJE:Prediction ofb-turns in proteins
using neural networks.Protein Eng1989,2(7):521-526.
30. Shepherd AJ, Gorse D, Thornton JM:Prediction of the location and type ofb-turns in proteins using neural networks.Protein Sci1999, 8(5):1045-1055.
31. Kaur H, Raghava GPS:Prediction ofb-turns in proteins from multiple alignment using neural network.Protein Sci2003,12(3):627-634. 32. Kirschner A, Frishman D:Prediction ofb-turns andb-turn types by a
novel bidirectional Elman-type recurrent neural network with multiple output layers (MOLEBRNN).Gene2008,422(1-2):22-29.
33. Cai YD, Liu XJ, Li YX, Xu XB, Chou KC:Prediction ofb-turns with learning machines.Peptides2003,24(5):665-669.
[image:10.595.56.293.87.253.2]34. Zheng C, Kurgan L:Prediction ofb-turns at over 80% accuracy based on an ensemble of predicted secondary structures and multiple alignments. BMC Bioinformatics2008,9:430.
35. Zhang Q, Yoon S, Welsh WJ:Improved method for predictingb-turn using support vector machine.Bioinformatics2005,21(10):2370-2374. 36. Pham TH, Satou K, Ho TB:Prediction and analysis ofb-turns in proteins
by support vector machine.Genome Inform2003,14:196-205. 37. Hu X, Li Q:Using support vector machine to predictb- andg-turns in
proteins.J Comput Chem2008,29(12):1867-1875.
38. Kim S:Protein beta-turn prediction using nearest-neighbor method. Bioinformatics2004,20:40-44.
39. Kaur H, Raghava GPS:A neural network method for prediction ofb-turn types in proteins using evolutionary information.Bioinformatics2004, 20(16):2751-2758.
40. Asgary MP, Jahandideh S, Abdolmaleki P, Kazemnejad A:Analysis and identification ofb-turn types using multinomial logistic regression and artificial neural network.Bioinformatics2007,23(23):3125-3130. 41. Wood MJ, Hirst JD:Protein secondary structure prediction with dihedral
angles.Proteins2005,59(3):476-481.
42. Guruprasad K, Rajkumar S:b- andg-turns in proteins revisited: a new set of amino acid turn-type dependent positional preferences and potentials.J Biosci2000,25(2):143-156.
43. Kaur H, Raghava GPS:An evaluation ofb-turn prediction methods. Bioinformatics2002,18(11):1508-1514.
44. Hobohm U, Scharf M, Schneider R, Sander C:Selection of representative protein data sets.Protein Sci1992,1(3):409-417.
45. Hutchinson EG, Thornton JM:PROMOTIF-a program to identify and analyze structural motifs in proteins.Protein Sci1996,5(2):212-220. 46. Altschul SF, Madden TL, Schäffer AA, Zhang J, Zhang Z, Miller W,
Lipman DJ:Gapped BLAST and PSI-BLAST: a new generation of protein database search programs.Nucleic Acids Res1997,25(17):3389-3402. 47. Henikoff S, Henikoff JG:Amino acid substitution matrices from protein
blocks.Proc Natl Acad Sci USA1992,89(22):10915-10919.
48. Jones DT, Swindells MB:Getting the most from PSI-BLAST.Trends Biochem Sci2002,27(3):161-164.
49. Vapnik V:The Nature of Statistical Learning Theory.N.Y.: Springer 1995. 50. Cristianini N, Shawe-Taylor J:An Introduction to Support Vector Machines and
Other Kernel-based Learning MethodsCambridge University Press 2000. 51. Burges CJ:A Tutorial on Support Vector Machines for Pattern
Recognition.Data Min and Knowl Disc1998,2(2):121-167. 52. Scholkopf B, Smola AJ:Learning with Kernels: Support Vector Machines,
Regularization, Optimization, and BeyondCambridge, MA, USA: MIT Press 2001.
53. Chang CC, Lin CJ:LIBSVM: a library for support vector machines2001 [http:// www.csie.ntu.edu.tw/~cjlin/libsvm].
54. Osuna E, Freund R, Girosi F:Support Vector Machines: Training and Applications.Tech. rep., Cambridge, MA, USA 1997.
55. Kaur H, Raghava GPS:BetaTPred: prediction ofb-turns in a protein using statistical algorithms.Bioinformatics2002,18(3):498-499.
56. Matthews BW:Comparison of the predicted and observed secondary structure of T4 phage lysozyme.Biochim Biophys Acta1975, 405(2):442-451.
57. Sonego P, Kocsor A, Pongor S:ROC analysis: applications to the classification of biological sequences and 3 D structures.Brief Bioinform 2008,9(3):198-209.
58. Fawcett T:An introduction to ROC analysis.Pattern Recogn Lett2006, 27(8):861-874.
59. Frishman D, Argos P:Seventy-five percent accuracy in protein secondary structure prediction.Proteins1997,27(3):329-335.
doi:10.1186/1471-2105-11-407
Cite this article as:Kountouris and Hirst:Predictingb-turns and their types using predicted backbone dihedral angles and secondary structures.BMC Bioinformatics201011:407.
Submit your next manuscript to BioMed Central and take full advantage of:
• Convenient online submission
• Thorough peer review
• No space constraints or color figure charges
• Immediate publication on acceptance
• Inclusion in PubMed, CAS, Scopus and Google Scholar
• Research which is freely available for redistribution
![Table 1 The dihedral angles of b-turn types [22]](https://thumb-us.123doks.com/thumbv2/123dok_us/8717816.384138/2.595.56.291.560.696/table-dihedral-angles-b-turn-types.webp)
![Figure 1 The architecture of ourusing a window of five residues ([5] utilises PSSMs to predict three-state secondary structures and seven-state dihedral angles, which are transformed into a vector of 50 attributesPSSM values, while the other,BLAST [46], th](https://thumb-us.123doks.com/thumbv2/123dok_us/8717816.384138/4.595.60.538.86.540/architecture-ourusing-residues-utilises-secondary-structures-transformed-attributespssm.webp)