© 2017, IRJET | Impact Factor value: 5.181 | ISO 9001:2008 Certified Journal | Page 3159
Case study of LMD & HD trucks using Quality Function Deployment
Piyush Kumrawat
1, Dr. Devendra Verma
21
ME Scholar, Institute of Engineering & Technology, DAVV, Indore, M. P., India
2
Assistant Professor, Dept. Of Mechanical Engineering, Institute of Engineering & Technology, DAVV, Indore
---***---Abstract -
Various techniques are available to satisfy thecustomer requirement like QFD. Using the QFD house of quality model, we are able to understand the fundamental customer requirement. This paper represent a simple case using QFD on the design phase of commercial vehicle project as a tool of improvement of various features of the product. A questionnaire has been used in the survey for capturing the voice of the customer with the help of which chart is prepared that shows a comparative result of current performance between commercial vehicles. Thus no. factors have been identified for commercial vehicles which help them in improve their performance and service quality.
Automobile companies that operate in market are trying to improve the design and development phase in their products so that they can better satisfy the needs of customers and users, especially for commercial vehicles. Many companies dedicatedly working on commercial vehicles agree that most important aspect is the value that they can provide to their customers.
This case study apply QFD in the design improvement of commercial vehicle .Obtaining the final results of the importance of weight and relative weight of the technical requirements, it was possible for the design team to prioritize and implement the features in the specification and design.
Key Words: Quality Function Deployment, Analytic
Hierarchy Process, House of Quality Matrix.
1. Introduction
Quality Function Deployment (QFD) introduced in Japan by Yogi Akao in 1966 and used extensively by Toyota. QFD builds quality into a product by ensuring that customer requirements are integrated into every stage of the development life cycle. Additionally, QFD enables engineers to compare their products to those of their competitors. Further, it allows the company to become proactive when quality problems arise, instead of being reactive to problems by waiting for customer complaints (Zairi & Youssef, 1995) . All information is recorded in a QFD matrix form, making it easily to read and locate.
The customer tomorrow will have needs and expectation different from those of our present customer. For this reason, it is important to keep up with changing needs and
expectoration and to learn how to meet these...(Bergman and Klefsjo,2003) In today’s competition market , customer are main focus in product development to increase their market size but achieving success with new product development in markets is becoming more and more challenging due to two main reasons:-
1. Shorting the product life cycle
2. Customers are demanding the fulfilment of their faster and with customized new product.
Quality function deployment is a methodology to aid the planning and realization of the products to meet customer expectations by bridging the communication gap between customer and technical requirements that help to translate customer what’s to designer how’s. Since it inception QFD has proved that is able to improve product development processes and deliver products that are highly focused and responsive to customer requirements.
QFD (quality function deployment) is defined as a method for developing a design quality aiming at satisfying the consumer and then translating the consumer's demand into design targets and major quality assurance points to be used throughout the production phase. QFD can be seen as a process where the consumer’s voice is valued to carry through the whole process of production and services. There are six basic elements of QFD, which are:
1. Determining the customer requirements (The QFD what). 2. Meeting how the requirements can be achieved (The QFD
How) of the customers are critical to final product control.
3. Relationship between the requirements and how they are to be met.
4. Target values for the requirements.
5. Relationships between how the requirements are to be met.
6. A quantification of the importance of the requirements
2. Quality Function
© 2017, IRJET | Impact Factor value: 5.181 | ISO 9001:2008 Certified Journal | Page 3160
Attainment of quality requires performance of a wide varietyof identifiable activities or quality task. The term “Quality Function ’’ is used for those collection of activities through which we achieve fitness for use. The traditional scope of quality activities are undergoing a radical change from the historical emphasis on quality of physical goods in manufacturing industries to what is now emerging as the application of quality concept in all product ,all function activities and all the industries. Universal processes of managing quality are quality planning, quality control and improvement.
2.1 QFD Stands for
1. Understanding Customer Requirements.
2. Quality Systems Thinking + Psychology + Knowledge/Epistemology.
3. Maximizing Positive Quality That Ads Value.
4. Comprehensive Quality System for Customer Satisfaction. 5. Strategy to Stay Ahead of the Game.
2.2 Quality Function Deployment (QFD)
Quality function deployment (QFD) is a customer-driven quality management and product development system for achieving higher customer satisfaction. Quality function deployment (QFD) is one of the very practical quality systems tools commonly used to fulfil customer requirements and improve customer satisfaction for product development and production.
The “voice of customer’’ is the term to describe these stated and unstated customer needs and requirements. QFD process can be used to assist the planning at any or all of these stages. The decision to use QFD is a team judgement based on the customer priorities and tempered by any constraints within organization.
QFD is one of the very effective quality systems tools typically applied to fulfil customer requirements and, more importantly, improve customer satisfaction.QFD is designed to help planners focus on characteristics of anew orexisting product or service from the viewpoints of market segments, company, or technology-development needs. The technique yields graphs and matrices.
QFD is a tool which integrates three distinct voices, namely, Voice of Business (VOB), Voice of Customer (VOC) and Voice of Engineer (VOE).
a. Voice of Business
– deals with organizationalrequirements and resource limitations. It is satisfied by generating profits through new and improved products. It is about designing the right cycle times, thus, improving the time-to-market and reducing development rework.
b. Voice of Customers
– deals with customers’ needs andrequirements within budget constraints. This gets satisfied by generating the perceived value and delivering quality and functionality as demanded by the customers.
c. Voice of Engineers
– deals with technical requirementsand constraints. It is satisfied by designing a product that is compatible with manufacturing facilities and endures operating conditions. This enables the transfer of products from design to manufacturing with minimal production waste.
Fig- 1. Relations between VOB, VOC & VOE
3. HOUSE OF QUALITY
House of Quality is a graphic tool for defining the relationship between customer desires and the firm/product capabilities. It is a part of the Quality Function Deployment (QFD) and it utilizes a planning matrix to relate what the customer wants to how a firm (that produces the products) is going to meet those wants. It is based on "the belief that products should be designed to reflect customers' desires and tastes" (Hauser & Clausing 1988).
© 2017, IRJET | Impact Factor value: 5.181 | ISO 9001:2008 Certified Journal | Page 3161
Fig-2. Basic elements of QFDThe various benefits of QFD as follows
4. Provide documentation A knowledge base is built as the QFD process is
implemented. A historical record of the decision-making process is developed.
5. Present Design Errors It is a discipline approached to product design engineering
and production and process it thus reduces change of oversight during this design process in depth evaluation of a product. It also provides historic references to enhance future technology.
6. Reduce Development Cost The identification of required changes occurs early in the
project life cycle. Minimizing changes following production reduces warranty costs and product support costs.
7. Competitive analysis other products in the marketplace are examined, and the
company product is rated against the competition.
4. LITERATURE REVIEW
4.1 Elements of QFD
We can see the elements of QFD in fig the house of quality is the most commonly used matrix in QFD. Its purpose is to translate importance customer requirements regarding product or service quality into important end product quality characteristics. Shown in figure the house of quality include the following elements an objective statement , the voice of customer, importance rating, a customer competitive assessment, voice of supplier, target goals, a correlation matrix, a technical assessment, probability factors, a relationship matrix ,absolute score and relative score.
1. Voice of Customer 2. Importance of Rating 3. Technical Requirements 4. Relationship matrix 5. Correlation Matrix 6. Technical Assessment 7. Target Goals
8. Absolute score and relative score
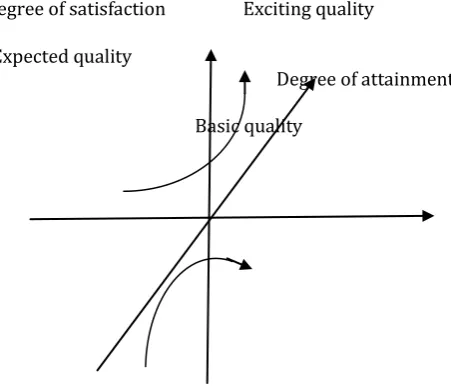
4.2 The Kano Model
The process of questioning people will not reveal everything involved in understanding the customer want and needs. The work of Noritaki Kano provides a model helps us understand the overall spectrum of customer expectations and satisfaction. The horizontal axis show the how well the customers thing the company’s product or service met their expectation. The vertical axis shows the degree of actual customer satisfaction with the product or service .
1. Customer driven The focus is on customer wants, not what the company
thinks the customer wants. The "Voice of the Customer" drives the development process.
2. Reduce Implementation time QFD process focuses on improvements to be made to
satisfy key customer requirements. Careful attention to customer requirements reduces the risk that changes will be required late in the project life cycle. Time is not spent developing insignificant functions and features.
3. Promotes Teamwork Improved Communication within the organization brings
together multifunctional teams and encourages team work
© 2017, IRJET | Impact Factor value: 5.181 | ISO 9001:2008 Certified Journal | Page 3162
Basic quality [image:4.595.44.270.195.390.2]
Fig -3: Kano Model
5. RESEARCH METHODOLOGY
QFD methodology was born out of Total quality control (TQC) activities in Japan during the 1960s. Deployment was motivated by two issues
1. How to design new product that meets the customer needs. 2. The desire provide Quality control process chart to manufacturing before production.
The QFD methodology provides a structured framework for concurrent engineering that propagate the “voice of customer” through all phase of product development. QFD utilizes a progression of matrices to link operational processes and decision to customer needs as depicted in figure The basic quality function deployment methodology involves four basic phase. During each phase one or more matrices are prepared to help plan and critical product and planning and design information.
The Four phases of QFD
1. Product planning (phase -1): This phase begins with customer requirements. A set of design requirements is determined, which, if satisfied, will result in achieving customer requirements.
2. Product development (phase -2): It involves design /redesign and fabrication of new or modified product and then testing it to find its usefulness. Product development is
essential in order to meet changing consumer needs, maintain sales position and profit margin etc. The various steps involved in developing a product are given below:
Fig -4: QFD methodology flow
3. Process planning (phase -3): Process planning is the systematic determination of the methods by which a product is to be manufactured economically and competitively. When a product is designed, certain specifications are established; physical dimensions, tolerances, standards, and quality are set forth. Then it becomes a matter of deciding the specific details of how to achieve the desired output. This decision is the essence of process planning.
4.Production planning (phase -4):In the phase the key manufacturing process and associated parameters are translated into work instruction, control and reaction plan and translating requirements necessary to ensure that the quality of key parts and processes is maintained. Finally, production requirements are determined from key process operation. This phase ends with prototyping and production launch.
6. Construction of House of Quality
a. Voice of Customer: Voice of customer is a structured list of requirements regarding the product and its attributes as a customer desire them together with a measure of importance the customer attach to each requirement. Quality may also be through of as attributes. Qualities attributes and customer requirements are all what’s. The voice of the customer is what the customer wants.
b. Importance of Rating: Customer Importance Rating: The importance rating is done on each and every customer attribute, by the customers. The information from the user and non-user are achieved through forced choice survey, which requires the customer to identify the importance of each of the requirements. Scale 1 to 9 (1=Least,9= Most)
Pro duct
Plan ning
Proc ess
Plan ning
Prod ucti
on
Plan ning Pro
duct
Dev elop men t A. Get new ideas
B. Evaluate ideas technically
C. Evaluate ideas from market’s point of view D. Take the final decision
E. Get into production
F. Introduce product into the market In the
Expected quality
fig. The Kano model categorizes customer needs into three groups basic, performance, and excitement. This model must be applied to a specific market segment; for example, customer expectations for a commodity masking product are significantly different from those for a high temperature automotive masking product. Basic needs are those that get a company in the market; they are not spoken unless violated.
Degree of satisfaction Exciting quality
© 2017, IRJET | Impact Factor value: 5.181 | ISO 9001:2008 Certified Journal | Page 3163
Customer Satisfaction Rating:. This data assessed therespondent’s satisfaction level against all the fifteen users’ .
Legend
⓪ = 9 ⃝ = 3
∆ = 1
Fig-5: Japanese symbols
c. The voice of the supplier or Technical requirements: This is all process of translating the customer requirements into design parameters in a way to force the team to define, using measurable and actionable statements. These are collected through a series of steps which included – structured and unstructured questionnaire and interview with the pertinent personnel.
d. The Relationship Matrix: The central body of the house knows as Relationship matrix provides a mechanism for analysis how each design parameters will help achieving each of the customer requirements. These are achieved through discussions and deliberations with the concerned technical personnel. The relationship scale used is: 3– Strong 2 - Average 1- Weak Blank – No Relationship.
e. The Correlation Matrix: The top of the house referred to as roof of the house is the correlation matrix. It is designed to show the correlation between one design parameter with the others and indicates the synergic impact changes in the technical attributes. The correlation data are defined with symbols for positive or negative relationship.
f. Technical Assessment: The technical assessment includes a technical competitive assessment and objective values or how much’. The technical competitive assessment is similar to the customer competitive assessment but involves technical details of the product or rather than the customer requirements. This is done to determine the inconsistencies between how the customer and the company are evaluating
the existing products are used to establish engineering specification.
g. Target Goals: Completed by technical team these are the “How much’s” of the technical “How’s” items. The customer and technical competitive assessments, the sales points the relationship room and the customer importance rating all contribute to determine the target values or “How much’s”. The target value present, in measurable terms, the level of performance for each end product characteristic the company has to provide in order to maximize customer satisfaction. They provide designer with specific technical guidance for what have to be achieved as well as objectively measuring the progress. The goal has to be quantified in order to be specific and measurable.
h. Absolute Score and relative score: The absolute score is the sum of the weighted relationship value for each how. The relative score is the rank. The numerical calculation is the product of the cell value and the customer importance rating. Number are then added up in their up in respective columns to determine the importance for each technical description. Absolute scores represent the importance of each How in relation to what’s.
The absolute weight of jth technical descriptor is given by [4] using given by aj = Σ Rij Ci
Where, aj = row vector of absolute weight of technical descriptors Rij = Weight assigned to relationship matrix (i = 1, 2 ...n, j = 1 ...m)
Ci = Column vector of importance to customer for the customer requirements (i = 1...n)
n = number of customer requirements
In the similar manner, the relative weight for the jth technical descriptor the given replace by degree of importance for the customer requirements.
It is calculated by using formula, bj = Σ Rij dj
bj = row vector of relative weight for the technical descriptors (j = 1...m) ,dj = column vector of absolute weight for the customer requirements (i = 1...n)
7. AHP Calculations
© 2017, IRJET | Impact Factor value: 5.181 | ISO 9001:2008 Certified Journal | Page 3164
Number of ComparisonsThe Number of comparisons is a combination of the number of parameters to be compared. Table below shows the number of comparisons.
Number of Parameters 1 2 3 4 5 6 n
Number of comparisons 0 1 3 6 10 15 n(n-1)/2
The scaling is not necessary 1 to 9 but for qualitative data such as preference, ranking and subjective opinion it is suggested to use scale 1 to 9.
The Fundamental Scale for Pair wise comparisons
Intensity of
Importance 1 3 5 7 9
Definition Importance Equal Moderate
Importance Importance Strong Very Strong Importance
Extreme importance
[image:6.595.39.550.158.206.2]Summary:
Table -1: Summary of Pair wise comparisons of primary parameters
Criteria More
Important Intensity
A B
Comfort Performance Performance 5
Comfort Economy Economy 5
Comfort Safety Safety 7
Comfort Extra Ordinary Feature EOF 5
Performance Economy Economy 5
Performance Safety Safety 5
Performance Extra Ordinary Feature Performance 5
Economy Safety Safety 5
Economy Extra Ordinary Feature Economy 5
Safety Extra Ordinary Feature Safety 5
Comparison Matrix (Primary Parameters)
Comfort Performance Economy Safety EO Feature
Comfort 1 1/5 1/5 1/7 1/5
Performance 5 1 5 1/5 5
Economy 5 1/5 1 1/5 5
Safety 7 5 5 1 5
© 2017, IRJET | Impact Factor value: 5.181 | ISO 9001:2008 Certified Journal | Page 3165
Sum each column of the matrix , we getComfort Performance Economy Safety EO Feature
Comfort 1 1/5 1/5 1/7 1/5
Performance 5 1 5 1/5 5
Economy 5 1/5 1 1/5 5
Safety 7 5 5 1 5
EO Feature 5 1/5 1/5 1/5 1
Sum 23 33/5 57/5 61/35 81/5
Divide each element of the matrix with the sum of its column, we have normalized relative weight. The sum of each column is 1.
Comfort Performance Economy Safety EO Feature Comfort 1/23 1/33 1/57 5/61 1/81 Performance 5/23 5/33 25/57 7/61 25/81 Economy 5/23 1/33 5/57 7/61 25/81 Safety 7/23 25/33 25/57 35/61 25/81 EO Feature 5/23 1/33 1/57 7/61 5/81
Sum 1 1 1 1 1
The normalized principal Eigen vector can be obtained by averaging across the rows. The Normalized principal Eigen vector is also called Priority Vector.
The Sum of all elements in priority vector is 1.
Comfort 15/404 0.037 3.71%
Performance 145/589 0.246 24.62%
W= 1/5 Economy 56/369 = 0.152 = 15.18%
Safety 458/961 0.477 47.66%
EO Feature 72/815 0.088 8.83%
© 2017, IRJET | Impact Factor value: 5.181 | ISO 9001:2008 Certified Journal | Page 3166
Table-2: Importance rating of customer requirements8. Results and discussion of “Deployment of Voice
of Customers”
1. The table depicts the various technical descriptors and their corresponding relative weight which were obtained from deployment of VOC.
2. The aspect of ‘Fuel Coaching’ has maximum importance Four Point Suspension and Head Lamp has minimum importance weight among all
Technical Requirements .
Table-3: Importance Weight
S.No. Technical
Requirements Importance Weight % Importance
1 Tilt able Cabin 11 2
2 Adjustable Seat 13 2
3 A C Cabin 9 1
4 Four Point Suspension 3 1
5 Spacious Cabin 18 3
6 Front Suspension 25 4
7 Rear Suspension 25 4
8 Fuel Coaching 94 14
9 Wheel Base 39 6
10 Ground Clearance 10 1
11 ABS 28 4
12 Grade ability 19 3
13 Engine Displacement 72 11
14 Max Speed 68 10
15 Torque 72 11
16 Power 17 3
17 Fuel Tank Cap. 9 1
18 Mileage 43 6
19 Battery 30 4
S.
No. Voice of Customer Composit
e Weight
Relative Importance
Rating Relative
Weight Relative Weight 1
Safety 47.66% ABS 69.65 33.21% 9
2 Speed Limiter 23.16 11.03% 3
3 High Strength Cabin 7.18 3.42% 1
4
Performance 24.62% Pick up 67.51 16.62% 5
5 Service Intervl 25.95 6.38% 2
6 Large Fuel Tank 6.54 1.61% 1
7
Economy 15.18% Better Mileage 69.65 10.57% 3
8 Warranty 23.16 3.51% 1
9 Maintainability 7.19 1.1% 1
10
Extra Ordinary Features
8.83% Cruise Control 63.76 5.63% 2
11 Fuel Coaching 28.13 2.5% 1
12 Telematics 7.19 0.63% 1
13
Comfort 3.71%
Sleeper Cabin 65.84 2.5% 1
14 4 Point Suspension 25.29 0.93% 1
© 2017, IRJET | Impact Factor value: 5.181 | ISO 9001:2008 Certified Journal | Page 3167
20 Warranty 9 1
21 Cruise Control 11 2
22 Head Lamp 8 1
23 Price 9 1
24 Weight 23 3
25 Low fuel Indicator 11 2
3. Due importance is to be given in next stage of QFD process for the parameters that are having high relative weight like Fuel Coaching , Engine Displacement, Torque etc.
4. After obtaining the final result of the importance weight and relative weight of the technical requirements, it was
possible for design team and implements the new solution and new features in the specification and design of the Commercial Vehicle.
9. CONCLUSIONS
QFD is a valuable and very flexible tool for design. The sequence of parts and steps during the QFD process can be changed according to the strategy adopt by the design team. The correlation matrix is the heart of the QFD process and stores precious information needed for design improvement. QFD helps prioritize the improvements and design specifications. QFD also helps translating the buyer and users’ needs into information that can be managed by the design team.
In a competitive market customers are the main focus in product development to increase the market size. QFD has been used as a tool to translate the customer’s requirements into the technical characteristics. QFD has achieved remarkable population around the world in wide variety of software, hardware and service sector. This is due to its systematic linking of customer requirements to and throughout the entire design, development and implement process as customer requirements and technological advancements rapidly change, it is necessary to assure that the customer satisfaction is achieved in quickest, least costly and most efficient way possible. QFD is a very effective means toward this end.
In this thesis, QFD approach have applied for identifying and analysing customer requirements for design and selection criteria, problem identification in the Commercial Vehicle development. QFD is a structured approach to defining customer requirements and translating them into specific design of a product to meets this requirements. QFD requires a step by step approach. The first step is to identify the basic customer needs. The questionnaire has been designed which includes 34 questions.
Visiting many Automobile showrooms and Industries to know needs related to customers. While conducting the survey since questionnaire provides to get qualitative data, there are a many situations in which it be supported by interviews to the research. From the result of the survey conducted, some of requirements of customers are ABS, Large Fuel Tank, Sleeper Cabin, Spacious Cabin etc.
In the summary, for increase the market size, fulfill the needs of customers and to create a high satisfied customer there is a need to improve the performance to the following parameters Mileage, Serviceability, Maintainability
10. Future Scope
1. Quality is the major achievement for any company to maintain their customer relationship and it provides extra reliability to company. If we apply QFD over any industries or service then the advantages of company such as scrap, rework, com plaints etc. may be minimized. QFD develop design quality to satisfy the customer and then translating the consumer demand into the design targets and major quality assurance point to be used throughout the production phase.
2. The quality function deployment planning process was the driving force behind the radical transformation of the Japanese auto industries throughout the 1980s. Mr. Akao described QFD as method to transform user demand into design quality, to deploy the function forming quality, and to deploy methods for achieving the design quality into subsystem and component parts and ultimately to specific elements of the manufacturing process.
3. Considering the literature review on QFD and its complete evolution, it is believed that the technique is flexibility enough to be integrated with other quality improvement tool and techniques therefore similar developments to the QFD approach could be considered in the proposed methodology in order to further develop its applicability and applicability’s
4. The future growth areas of this technique have also been identified. However the QFD house of the quality is quite difficult to construct on a sheet of paper or a chart with high number of requirements and technical characteristics, it is highly recommended to the classified the items on each sides of the matrix and cut down to matrices in to sub matrices, based on classified items.
© 2017, IRJET | Impact Factor value: 5.181 | ISO 9001:2008 Certified Journal | Page 3168
REFERENCES
1. Chan, L.K., Wu M.L.: Quality function deployment: a comprehensive review of its concepts and methods. Qual. Eng. 15(1), 23–35 (2002-03)
2. Luiz Anlonio Gargion, “Using Quality Function Deployment in the design phase of an apartment construction project”, University of California, Berkley, CA, USA, 26-28 July, 1996. 3. Low Sui Pheng, and Lorry Yeap, “Quality function Deployment in Design /Build projects” Journal of Architectural Engineering, 2001.
4. Ronald G. Day, “Quality Function Deployment” Tata McGraw-Hill Publishing Company Ltd, 1996.
5. Juran, J.M., Quality Control Handbook (3rd Ed.). New York, McGraw-Hill, 1974.
6. Hong Suk Lee, Kyeong Won Lee, “Practical Case Study of Revolving the physical contradiction in TRIZ: Super Water saving Toilet System Using Flexible Tube”.
7. Nikhil Chandra Shil, Abu Rashed Osman, “Quality Function Deployment for Customer Satisfaction in Banking Services”, Daffodil International University Journal of Business and Economics, Vol. 2, No. 2, July 2007
8. Mayank Maewall, Patrick Dumes "Quality Function Deployment: Health Care Improvement, 2012.
9. J.R. Sharma, Dr. A. R. Rawani, “Quality Function Deployment for service industries from customer requirement to customer satisfaction” Industrial Engineering Journal Vol. XXXV No. 11 pp 14-18, 2006.
10. HPD Design Guidelines for New Construction, Revised August 1, 2000.
11. Akao, Y. “An Introduction to Quality Function Deployment” Quality Function Deployment (QFD): Integrating Customer Requirement into product design. Akao, ed. Productivity Press, Cambridge, Massachusetts, 1 – 24, 1990.
12. Yogi Akao Asahi University, “QFD: Past, Present and Future” International Symposium on QFD 1997 – Linkoping, 1997.