ISSN Online: 2327-4379 ISSN Print: 2327-4352
DOI: 10.4236/jamp.2019.712204 Dec. 3, 2019 2941 Journal of Applied Mathematics and Physics
A New Numerical Method for DNA Sequence
Analysis Based on 8-Dimensional Vector
Representation
Dandan Zhang
Department of Mathematics, Jinan University, Guangzhou, China
Abstract
Background: The multiple sequence alignment (MSA) algorithms are the traditional ways to compare and analyze DNA sequences. However, for large DNA sequences, these algorithms require a long time computationally. Ob-jective: Here we will propose a new numerical method to characterize and compare DNA sequences quickly. Method: Based on a new 2-dimensional (2D) graphical representation of DNA sequences, we can obtain an 8-dimen- sional vector using two basic concepts of probability, the mean and the va-riance. Results: We perform similarity/dissimilarity analyses among two real DNA data sets, the coding sequences of the first exon of beta-globin gene of 11 species and 31 mammalian mitochondrial genomes, respectively. Conclu-sion: Our results are in agreement with the existing analyses in our litera-tures. We also compare our approach with other methods and find that ours is more effective.
Keywords
DNA Map, Zigzag Curve, Numerical Characterization, Similarity Analysis
1. Introduction
With the rapid growth in biological data, how to get more information from these big data is a challenge for scientists. For this purpose, an important prob-lem is to find a suitable way to digitize these DNA sequences so that the se-quence comparison can be applied. For computational time reason, beyond the traditional multiple sequence alignment (MSA), many alignment-free sequence comparison methods were introduced, for more details, please refer to [1][2][3] and the references therein.
How to cite this paper: Zhang, D.D. (2019) A New Numerical Method for DNA Sequence Analysis Based on 8-Dimensional Vector Representation. Journal of Applied Mathematics and Physics, 7, 2941-2949. https://doi.org/10.4236/jamp.2019.712204
Received: August 20, 2019 Accepted: November 30, 2019 Published: December 3, 2019
Copyright © 2019 by author(s) and Scientific Research Publishing Inc. This work is licensed under the Creative Commons Attribution International License (CC BY 4.0).
http://creativecommons.org/licenses/by/4.0/
DOI: 10.4236/jamp.2019.712204 2942 Journal of Applied Mathematics and Physics framework. In particular, in [27], in order to obtain the eigenvector representing the zigzag curve, it was necessary to calculate the maximum eigenvalue of the related matrix. So it took a long time to compute this value for a huge DNA se-quence. In [28], the polynomial curve of order 3 was used to fit the representa-tion curve. But the choice of the order for the funcrepresenta-tion was depended on their data sets. To improve these methods, we characterize the representation curve with the mean and the variance. Following some observations in [27] [28], we will provide a map from the space of DNA sequences to the 8-dimensional Euc-lidean space based on a 2D graphical representation of the sequence. By this mapping, the similarity/dissimilarity of the first exon of beta-globin gene of ele-ven species and 31 mammalian mitochondrial genomes will be studied respec-tively and very prospective results will be obtained.
The remainder of this paper is organized as follows. Section 2 presents the method of the graphical representation of DNA sequence, and explains the pro-cedure of the similarity analysis among these sequences. Section 3 presents the similarity results among the coding sequences of the first exon of beta-globin gene of 11 species and 31 mammalian mitochondrial genomes. Section 4 discusses our results with other literates and shows the effectiveness of our method.
2. Methods
Utilizing the fact that A, T and C, G are two base pairs, Liu [27][28] introduced two representations of DNA sequence by setting A, T and C, G to the same probability respectively. Following this idea, each nucleotide is assigned by a vector as follows.
(
)
(
)
(
)
(
)
1,0.2 A, 1, 0.2 T, 1,0.3 C, 1, 0.3 G.
→ − →
→ − →
Here the y-coordinates of A and T are assigned the same number with opposite sign for differing in the curve, so as to C and G.
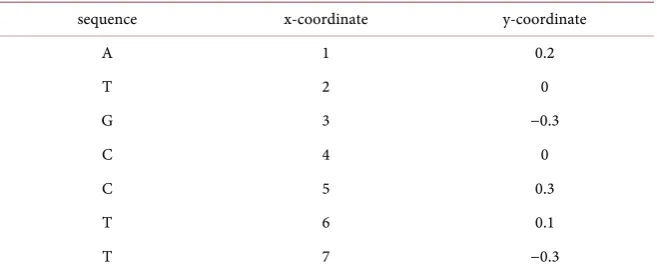
For a DNA sequence, we can get a zigzag curve by jointing with all the vectors one by one. For example, the representation of sequence ATGCCTT can be read as follows (Table 1).
DOI: 10.4236/jamp.2019.712204 2943 Journal of Applied Mathematics and Physics Figure 1. The curve corresponding to ATGCCTT.
Table 1. Representation of sequence ATGCCTT.
sequence x-coordinate y-coordinate
A 1 0.2
T 2 0
G 3 −0.3
C 4 0
C 5 0.3
T 6 0.1
T 7 −0.3
The coordinate x of the curve is increasing, and different nucleotides have different y values, so this representation is a one-to-one map between the DNA sequences and the curves, without loss of information and degeneracy [11].
Based on the assignments of the four nucleotides over there, Liu [27] intro-duced a representation of DNA sequence-based on four horizon lines, then showed a map from the curve to a vector in R4 by the maximal eigenvalue of a related symmetric matrix. In the rest of this section, we will present a map from a DNA sequence to an 8D vector. For two DNA sequences, we will compute the Euclidean distance between the two corresponding vectors, which could be re-garded as the similarity/dissimilarity between these two DNA sequences. Our method will be examined by two data sets ranging from small to medium size, as well as exons to genomes.
Given a DNA sequence with a length of n, we have a zigzag curve based on the map between the bases and numbers as assigned as above. Let (xi, yi) be the coordinates corresponding to the i-th nucleotide of the sequence, and zi= yi i, the slope of the line joining the origin with the point (xi, yi). Then we can get the mean and the variance of the slopes respectively,
(
)
21 1
1 n , 1 n
z i i z i i z
m z v z m
n = n =
[image:3.595.211.540.285.420.2]DOI: 10.4236/jamp.2019.712204 2944 Journal of Applied Mathematics and Physics is different a little bit with in [30], where the map is from DNA sequence to the representation zigzag curve.
Once the feature vector is determined, one can compare two sequences. Given two DNA sequences, we can get two corresponding vectors E1 and E2. Then
the distance d between them can be regarded as a similarity/dissimilarity meas-ure of these two sequences, where
1 2
d= E E− .
We can see that if two DNA sequences are the same, then d is equal to zero. Therefore, if the value of d is smaller, then the two DNA sequences should be more similar.
3. Results
In this section, we study the similarities among the coding sequences of the first exon of beta-globin gene of 11 species and 31 mammalian mitochondrial ge-nomes through the similarity/dissimilarity measure d.
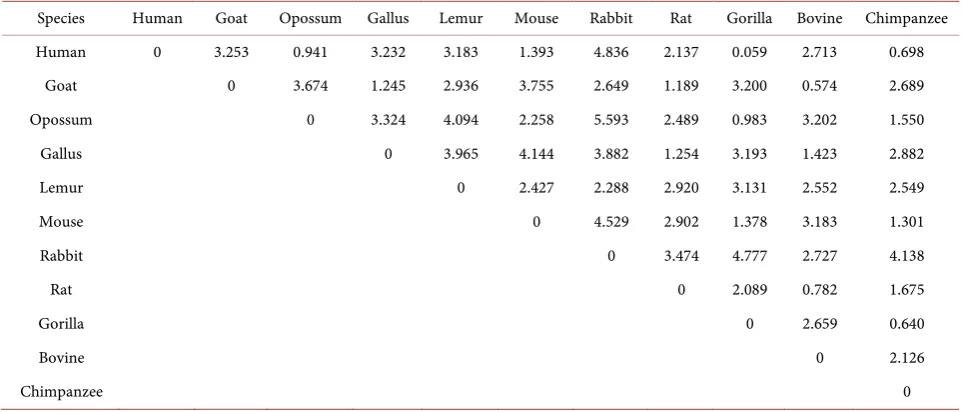
Let us first consider the sequences of beta-globin gene, whose information is listed in Table 2 from GenBank, which updates the information of Table 3 in [1]. The result is shown in Table 3. The table shows that the values d of Hu-man-Gorilla, Goat-Bovine and Gorilla-Chimpanzee are relative smaller, which indicates they are relative closer. In order to exam whether our method is effec-tive, we want to compare our results with those of others. Therefore, we list some highly cited similarity results between human beings and other species, as shown in Table 4. Following the idea in [27][28][31], for convenience, we also use the index normalized by the Human-Goat ratio. From Table 4, most results display that the normalized values of Human-Gorilla and Human-Chimpanzee are smaller, which is consistent with ours.
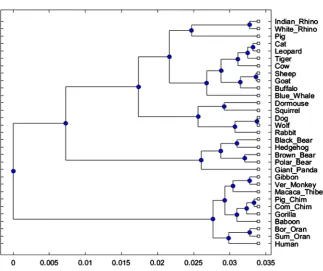
DOI: 10.4236/jamp.2019.712204 2945 Journal of Applied Mathematics and Physics Figure 2. The phylogenetic tree of 31 mammalian mitochondrial genomes with UPGMA.
Table 2. The coding sequences of the first exon of beta-globin gene of eleven species.
Species Coding sequence
Human ATGGTGCACCTGACTCCTGAGGAGAAGTCTGCCGTTACTGCCCTGT GGGGCAAGGTGAACGTGGATGAAGTTGGTGGTGAGGCCCTGGGCAG
Goat ATGCTGACTGCTGAGGAGAAGGCTGCCGTCACCGGCTTCTGGGG CAAGGTGAAAGTGGATGAAGTTGGTGCTGAGGCCCTGGGCAG
Opossum ATGGTGCACTTGACTTCTGAGGAGAAGAACTGCATCACTACCATC TGGTCTAAGGTGCAGGTTGACCAGACTGGTGGTGAGGCCCTTGGCAG
Gallus ATGGTGCACTGGACTGCTGAGGAGAAGCAGCTCATCACCGGCCTCT GGGGCAAGGTCAATGTGGCCGAATGTGGGGCCGAAGCCCTGGCCAG
Lemur ATGACTTTGCTGAGTGCTGAGGAGAATGCTCATGTCACCTCTCTGT GGGGCAAGGTGGATGTAGAGAAAGTTGGTGGCGAGGCCTTGGGCAG
Mouse ATGGTGCACCTGACTGATGCTGAGAAGTCTGCTGTCTCTTGCCTGT GGGCAAAGGTGAACCCCGATGAAGTTGGTGGTGAGGCCCTGGGCAGG
Rabbit ATGGTGCATCTGTCCAGTGAGGAGAAGTCTGCGGTCACTGCCCTGT GGGGCAAGGTGAATGTGGAAGAAGTTGGTGGTGAGGCCCTGGGCAG
Rat ATGGTGCACCTAACTGATGCTGAGAAGGCTACTGTTAGTGGCCTGT GGGGAAAGGTGAACCCTGATAATGTTGGCGCTGAGGCCCTGGGCAG
Gorilla ATGGTGCACCTGACTCCTGAGGAGAAGTCTGCCGTTACTGCCCTGTG GGGCAAGGTGAACGTGGATGAAGTTGGTGGTGAGGCCCTGGGCAGG
Bovine ATGCTGACTGCTGAGGAGAAGGCTGCCGTCACCGCCTTTTGGGGC AAGGTGAAAGTGGATGAAGTTGGTGGTGAGGCCCTGGGCAG
DOI: 10.4236/jamp.2019.712204 2946 Journal of Applied Mathematics and Physics
Rat 0 2.089 0.782 1.675
Gorilla 0 2.659 0.640
Bovine 0 2.126
[image:6.595.57.539.89.295.2]Chimpanzee 0
Table 4. The similarity indexes between human and other species. All indexes are normalized to Human-Goat ratio.
Methods Goat Opossum Gallus Lemur Mouse Rabbit Rat Gorilla Bovine Chimpanzee
Our work 1 0.29 0.99 0.98 0.43 1.49 0.66 0.02 0.83 0.21
Chi & Ding [34] 1 3.71 0.82 2.73 0.69 0.50 0.48 0.07 3.59 0.58
Randic et al. [29] 1 2.43 1.79 1.43 1.37 0.69 0.70 0.34 1.38 0.28
Zhang [12] 1 2.49 2.42 1.05 0.93 1.12 1.11 0.55 0.76 2.01
also closing similar. Our results are also consistent with that in [28], where they considered 11 species of them.
4. Discussions
Our method provides a map from the space of DNA sequences to the 8-dimensional Euclidean space. We focus the slope of the line jointing the origin and representation point for the nucleotide, which reflects the speed of the change of y-coordinate.
Different from other probabilistic methods [14][35], where they regarded the sequence as a sample space, we read a DNA sequence as a random result. Com-paring to the method in [27], our method relies on the mean and variance of the slopes of the corresponding lines only, not the eigenvalues. These arrive at more pure statistics, and save computing time.
[image:6.595.57.538.326.412.2]DOI: 10.4236/jamp.2019.712204 2947 Journal of Applied Mathematics and Physics reflects the usefulness of our novel method.
In this work, we provide an alternative map from DNA sequence to a vector in R8 based on two basic statistical quantities. The idea of our method can be ap-plied to analyze the protein sequences. Even the zigzag curve representation of DNA sequence is one-to-one, but not for the map from curves to R8. That is, two DNA sequences may have the same feature vector. In future research, we try to develop our method to study more biological data, for example, to find more suitable vectors so that it can keep more information of DNA sequence.
Conflicts of Interest
The author declares no conflicts of interest regarding the publication of this pa-per.
References
[1] Jin, X., Jiang, Q., Chen, Y., et al. (2017) Similarity/Dissimilarity Calculation Me-thods of DNA Sequences: A Survey. Journal of Molecular Graphics and Modelling, 76, 342-355. https://doi.org/10.1016/j.jmgm.2017.07.019
[2] Zielezinski, A., Vinga, S., Almeida, J. and Karlowski, W.M. (2017) Alignment-Free Sequence Comparison: Benefits, Applications, and Tools. Genome Biology, 18, Ar-ticle No. 186. https://doi.org/10.2174/157489361002150518150716
[3] Ren, J., Bai, X., Lu, Y.Y., et al. (2018) Alignment-Free Sequence Analysis and Ap-plications. Annual Review of Biomedical Data Science, 1, 93-114.
https://doi.org/10.1146/annurev-biodatasci-080917-013431
[4] Hamori, E. and Ruskin, J. (1983) H Curves, a Novel Method of Representation of Nucleotide Series Especially Suited for Long DNA Sequences. The Journal of Bio-logical Chemistry, 258, 1318-1327.
[5] Hamori, E. (1985) Novel DNA Sequence Representations. Nature, 314, 585-586. https://doi.org/10.1038/314585a0
[6] Gates, M.A. (1985) Simpler DNA Sequence Representations. Nature, 316, 219. https://doi.org/10.1038/316219a0
[7] Zhang, R. and Zhang, C.T. (1994) Z Curves, an Intutive Tool for Visualizing and Analyzing the DNA Sequences. Journal of Biomolecular Structure & Dynamics, 11, 767-782. https://doi.org/10.1080/07391102.1994.10508031
[8] Nandy, A. (1994) A New Graphical Representation and Analysis of DNA Sequence Structure: I. Methodology and Application to Globin Genes. Current Science, 66, 309-314.
[9] Leong, P.M. and Morgenthaler, S. (1995) Random Walk and Gap Plots of DNA Se-quences. Computer Applications in the Biosciences Cabios, 11, 503-507.
https://doi.org/10.1093/bioinformatics/11.5.503
[10] Tang, X.C., Zhou, P.P. and Qiu, W.Y. (2010) On the Similarity/Dissimilarity of DNA Sequences Based on 4D Graphical Representation. Chinese Science Bulletin, 55, 701-704. https://doi.org/10.1007/s11434-010-0045-2
[11] Yau, S.S.T., Wang, J.S., Niknejad, A., Lu, C., Jin, N. and Ho, Y.K. (2003) DNA Se-quence Representation without Degeneracy. Nucleic Acids Research, 31, 3078-3080. https://doi.org/10.1093/nar/gkg432
DOI: 10.4236/jamp.2019.712204 2948 Journal of Applied Mathematics and Physics [16] Zhang, Z.J., Li, J.Y., Pan, L.Q., et al. (2014) A Novel Visualization of DNA Se-quences, Reflecting GC-Content. MATCH Communications in Mathematical and in Computer Chemistry, 72, 533-550.
[17] Li, Y.S., Liu, Q. and Zheng, X.Q. (2016) DUC-Curve, a Highly Compact 2D Graph-ical Representation of DNA Sequences and Its Application in Sequence Alignment. Physica A, 456, 256-270. https://doi.org/10.1016/j.physa.2016.03.061
[18] Yu, J.F., Sun, X. and Wang, J.H. (2009) TN Curve: A Novel 3D Graphical Represen-tation of DNA Sequence Based on Trinucleotides and Its Applications. Journal of Theoretical Biology, 261, 459-468. https://doi.org/10.1016/j.jtbi.2009.08.005
[19] Liao, B., Xiang, Q.L., Cai, L.J. and Cao, Z. (2013) A New Graphical Coding of DNA Sequence and Its Similarity Calculation. Physica A, 392, 4663-4667.
https://doi.org/10.1016/j.physa.2013.05.015
[20] Yu, C.L., Deng, M., Zheng, L., He, R.L., Yang, J. and Yau, S.S.T. (2014) DFA7, a New Method to Distinguish between Intron-Containing and Intronless Genes. PLoS ONE, 9, e101363. https://doi.org/10.1371/journal.pone.0101363
[21] Yu, C.L., He, R.L. and Yau, S.S.T. (2014) Viral Genome Phylogeny Based on Lem-pel-Ziv Complexity and Hausdorff Distance. Journal of Theoretical Biology, 348, 12-20. https://doi.org/10.1016/j.jtbi.2014.01.022
[22] Siegel, K., Altenburger, K., Hon, Y.-S., Lin, J. and Yu, C. (2015) PuzzleCluster: A Novel Unsupervised Clustering Algorithm for Binning DNA Fragments in Meta-genomics. Current Bioinformatics, 10, 225-231.
https://doi.org/10.2174/157489361002150518150716
[23] Yau, S.S.T., Yu, C.L. and He, R. (2008) A Protein Map and Its Application. DNA and Cell Biology, 27, 241-250. https://doi.org/10.1089/dna.2007.0676
[24] Wu, Z.C., Xiao, X.A. and Chou, K.C. (2010) 2D-MH: A Web-Server for Generating Graphic Representation of Protein Sequences Based on the Physicochemical Prop-erties of Their Constituent Amino Acids. Journal of Theoretical Biology, 267, 29-34. https://doi.org/10.1016/j.jtbi.2010.08.007
[25] Yu, C.L., Cheng, S.Y., He, R.L. and Yau, S.S.T. (2011) Protein Map: An Align-ment-Free Sequence Comparison Method Based on Various Properties of Amino Acids. Gene, 486, 110-118. https://doi.org/10.1016/j.gene.2011.07.002
[26] Randic, M., Zupan, J., Balaban, A.T., Vikic-Topic, D. and Plavsic, D. (2011) Graph-ical Representation of Proteins. Chemical Reviews, 111, 790-862.
https://doi.org/10.1021/cr800198j
[27] Liu, H.L. (2018) 2D Graphical Representation of DNA Sequence Based on Horizon Lines from a Probabilistic View. Bioscience Journal, 34, 1344-1350.
DOI: 10.4236/jamp.2019.712204 2949 Journal of Applied Mathematics and Physics [28] Liu, H.L. (2018) A Joint Probabilistic Model in DNA Sequences. Current
Bioinfor-matics, 13, 234-240. https://doi.org/10.2174/1574893613666180305161928
[29] Randic, M., Vracko, M., Lers, N. and Plavsic, D. (2003) Analysis of Similari-ty/Dissimilarity of DNA Sequences Based on Novel 2-D Graphical Representation. Chemical Physics Letters, 371, 202-207.
https://doi.org/10.1016/S0009-2614(03)00244-6
[30] Randic, M. (2004) Graphical Representations of DNA as 2-D Map. Chemical Phys-ics Letters, 386, 468-471. https://doi.org/10.1016/j.cplett.2004.01.088
[31] Peng, Y. and Liu, Y.W. (2015) An Improved Mathematical Object for Graphical Representation of DNA Sequences. Current Bioinformatics, 10, 332-336.
https://doi.org/10.2174/157489361003150723135559
[32] Hoang, T., Yin, C.C., Zheng, H., Yu, C.L., He, R.L. and Yau, S.S.T. (2015) A New Method to Cluster DNA Sequences Using Fourier Power Spectrum. Journal of Theoretical Biology, 372, 135-145. https://doi.org/10.1016/j.jtbi.2015.02.026
[33] Deng, M., Yu, C., Liang, Q., He, R.L. and Yau, S.S. (2011) A Novel Method of Cha-racterizing Genetic Sequences: Genome Space with Biological Distance and Appli-cations. PLoS ONE, 6, e17293. https://doi.org/10.1371/journal.pone.0017293 [34] Chi, R. and Ding, K.Q. (2005) Novel 4D Numerical Representation of DNA
Se-quences. Chemical Physics Letters, 407, 63-67. https://doi.org/10.1016/j.cplett.2005.03.056