Effect of Vapour Force at the Blow-Open
Process in Double-Break Contacts
Stanislav Kharin, Hassan Nouri
, Senior Member, IEEE
, and Martin Bizjak
Abstract—This paper presents results of a theoretical and experimental investigation of the phenomena of electrical con-tact repulsion and its associated blow-off characteristics at high current. The voltage and current waveforms as well as contact’s displacement oscillograms are recorded for analysis. The mathe-matical model of the phenomena based on differential equations for the arc, forces, contact heating and evaporation and dis-placement of the movable contact piece is elaborated to describe repulsion dynamics. All stages of contact separation including opening start, Joule explosion of the constriction zone and arcing are considered in series. It is found that side by side with electro-magnetic force, which is responsible for the initiation of contact opening, thermal force due to vapour pressure, which develops further contact separation, is also very important and should be taken into consideration. Dependence of thermal force on voltage, current, circuit parameters and properties of contact material are calculated theoretically and examined against data obtained experimentally for the asymmetric contact pair AgC-AgNi.
Index Terms—AgC-AgNi double break contacts, blow open process, vapour force.
I. INTRODUCTION
D
YNAMICS of contact blow-open forces are very impor-tant to provide the desired opening conditions during a short circuit current for a reduction in arc duration and welding probability. It is suggested [1] as a rule that two forces ap-pearing in closed contacts at the inrush of short circuit current are mainly responsible for characteristics of contact separation at the blow-off process. The first of these is electromagnetic force and the second is arc plasma pressure force. The influ-ence of magnetic force on contact repulsion is investigated in detail experimentally [2] and by numerical simulation [3]–[5]. The dynamics of blow-open contact repulsion is explained in the following way [6]–[8]. Increasing electrical current produces magnetic force, which reduces the load of contact spring and the radius of the contact spot. It results in a rise of magnetic force. When magnetic force becomes equal to contact spring force, contact separation starts, which accompanied by an in-crease of current density and temperature up to melting point and the liquid bridge formation. The arc igniting after bridge rupture produces intensive evaporation of contact material and gas pressure in the contact gap; this creates a repulsion impulseManuscript received September 13, 2006; revised June 26, 2007 and April 28, 2008. First published February 13, 2009; current version published February 27, 2009. This work was recommended for publication by Associate Editor J. McBride upon evaluation of the reviewers comments.
S. Kharin and H. Nouri are with the University of the West of England, Bristol BS16 1QY, U.K. (e-mail: [email protected]).
M. Bizjak is with Iskra Stikala dd, Kranj 4000, Slovenia.
Color versions of one or more of the figures in this paper are available online at http://ieeexplore.ieee.org.
Digital Object Identifier 10.1109/TCAPT.2009.2013986
and the blow-open process. The main problem with this is the evaluation of plasma pressure that can be achieved using some indirect methods. The method described for this aim in the paper [6] is based on the dependence of arc electrical conductivity on the arc temperature, which is different for different pres-sures, but it enables one to estimate average values of blow-open force using their experimental data and Yos’s theory for arc con-ductivity-temperature relationship [7]. However, as mentioned by the authors, a more accurate method for calculating the arc dynamics pressure needs to be developed taking into account anode and cathode phenomena, and time dependence of all pa-rameters. The method used in [8] deals with the relationship between plasma emission coefficient and plasma pressure. The analytical model, which is based on the force balance equation, was elaborated to calculate the dynamics of contact gap. Some noticeable discrepancy between results of calculation and ex-perimental data due to simplification of this model indicate that a more detailed time-dependent description of all phenomena at the blow-open process which includes the arc and contact temperature, phase transformation, forces interaction have to be considered.
II. EXPERIMENTALSETUP ANDMEASUREMENTSMETHODS
This investigation has concentrated on the pre-breaking phenomena occurring at short-circuit conditions in the double-break contact system of low-voltage three-pole cir-cuit breakers for motor protection. Circir-cuit breakers of a high breaking capacity are able to interrupt the short-circuit current within the first AC half-cycle. The experimental rig which com-prises of a typical commercially available double-break contact was arranged in a way to provide facilities for simulation of such conditions and in particular the blow-open phenomena of contacts.
Experiments were performed on a double-break asymmetric pairs of AgC-AgNi contacts that is incorporated with the arc chutes of commercial switching devices. The contact radius was mm. The movable contact piece was firmly ce-mented into the contact holder on which a helical spring of de-termined characteristics was attached in order to provide the required contact force directly on contacts. The contact mass was 16.6 g. No other driving means for switching or loading of the contact was attached. A lightweight screen was mounted on the contact holder to provide a feasible measurement of contact displacement. The test circuit breaker was connected into the test circuit by screw terminals, which permitted connecting the stranded conductor of effective cross-section 6 mm .
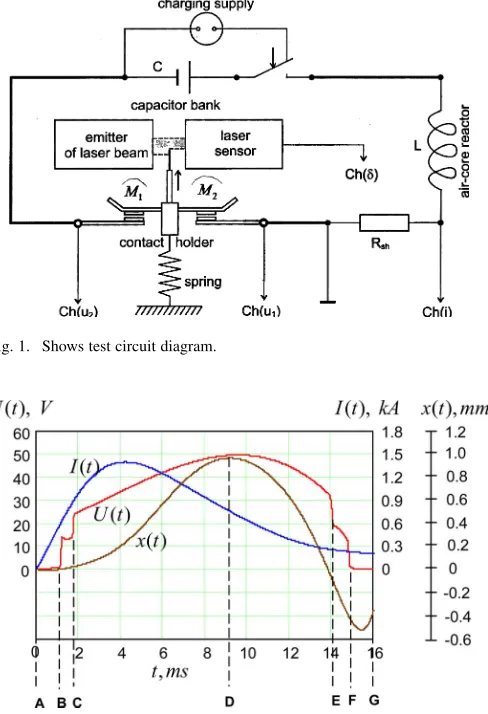
The test circuit includes the current source in series with the make switch, multi-tap air core reactor, precision shunt resistor, and tested device as shown in Fig. 1.
A capacitor bank of 10 electrolytic capacitors 2200 F % 350 V with a charging accessory was used for the supply of test current. The discharge was initiated by closing the make switch and this way an aperiodic current waveform of exponential time rise and fall characteristics was obtained. Air core reactor is applied in order to adjust the time-to-peak of the test current with the waveform in its rising part and around its maximum essentially similar to the AC half-wave of power supply 50 Hz. The maximal achieved peak value was 2 KA.
All the desired quantities are measured by a 100 MHz digital Oscilloscope. A dedicated and precision method (Two-probe method) is adopted for measurement of current, voltage drop and the arc voltage across the double-break contact pairs.
The position of the movable contact bridge was measured with an optical sensor. A screen firmly attached onto the holder of the movable contact bridge was placed in a gap between the source of the laser beam, which emits a 1 mm thick and 10 mm wide beam, and a laser-light sensor with an orifice of the same cross-section as the receiver for the laser beam. The sensor’s ori-fice was partially shadowed by the movable screen regarding the instantaneous position of the movable contact piece. The output of the sensor unit is directly proportional to the unscreened area of the orifice with the rate 1,02 V/mm of contact travel. The fre-quency response and linearity of the laser emitter-sensor system was confirmed by measurements as adequate to follow move-ments at velocity of more than 8 m/s without distortion of its response.
It should be noted, that the total voltage drop measured as the sum of both contact voltage drops in series does not give us any information of asymmetry of the double break. By measurement of contact movement only translation motion was recorded al-though in the case of double-break contacts the presence of a rotational component is reported [2], [6]. The rotational com-ponent is remarkably reduced but not eliminated by guiding the contact holder as per actual design of regular circuit breaker type. The actual asymmetry was indicated at the end of the ex-periment by dismantling the contact system.
III. EXPERIMENTALRESULTS
Measurements were carried out in test circuits with circuit pa-rameters maintained at constant values. In fact ohmic resistance, which was actually less than 0,3 , could vary to a certain ex-tent due to variable contact resistance of the test device. When the capacitor battery loaded on voltage was discharged, a waveform of transient current was obtained, which simulates the AC current half-wave. The magnitude of test current wave was adjusted for experiment by charge voltage in the range up to 350 V. The contact system was loaded by tensile force of a helical spring. It is the only external force determining the dynamics of a movable contact due to the negligible gravita-tion force. The initial value of this force in closed contacts is
[image:2.594.309.544.68.237.2]N with spring constant N/mm.
Fig. 2 depicts typical oscillograms of current, voltage and contact gap at blow-open repulsion during half-wave current with 1.5 KA peak.
[image:2.594.307.551.70.427.2]Trace of contact displacement starts from the beginning of blow-open to its maximum and returns back into the position of reclose. As the graphs illustrate, the reclose position does not
Fig. 1. Shows test circuit diagram.
Fig. 2. Dynamics of voltageU(t), currentI(t), and contact displacementx(t).
coincide with the initial closed position due to certain burnout of contact tips during the blow-open cycle.
Analysis of repulsion dynamics enables one to conclude that the blow-open process should be divided into several consecu-tive stages. At the first stage of contact separation , which duration is ms, voltage increases from 0 to its boiling value 0.75 V. This is due to an increase of current and contact temperature. The magnetic force, which should reduce contact load force and increase current density also contributes to this voltage increase, however its role is less significant due to the relatively small current at this time. Transition to the next stage at the point (Step 1) lasts from ms to ms. It is accompanied by an abrupt voltage rise to the value 13.5 V required for arc ignition on the contact (Fig. 1), while the second contact remains in good electrical conductance. This voltage is approximately constant for the whole arc duration BC in the contact from the time of arc ignition ms to the time ms. The power of this transition is consumed for melting and vaporization of a zone in the constriction region and for the cathode fall formation required, providing minimum arc voltage.
[image:2.594.301.550.262.425.2]Next the voltage jump from 13.5 V to 24 V (Step 2) occur-ring at the point from ms to ms indicates the similar phenomena of Joule explosion and arc formation on the second contact of bridge pair . Now the resulting force of vapour pressure and magnetic repulsion in sum on both con-tacts plus magnetic force exceeds spring force, and concon-tacts start to move. Arc temperature and heat fluxes into contacts become greater provoking an increase of the evaporation rate, rise of gas pressure and acceleration of contact motion at the beginning of the next stage of separation. However, after some time the gas pressure decreases due to an increase of contact gap and a de-crease of current, and when it becomes equal to spring pressure at point ( ms) the direction of contact motion changes to reverse. The voltage also decreases to the point , at which it steps down from ms to ms indicating the arc is extinguishing and closure of one contact, while the second contact is still arcing. It closes later at point stepping down
from ms to ms. A bounce may be
ob-served sometimes at the final stage of contact closure from ms to ms. The negative travel after con-tact closure shown in Fig. 2, is related to intensive erosion of the contact surface in which the initial “zero” reference position of contact travel differs after closure. This is confirmed through in-spection of fixed and moveable contacts. Better instrumentation will overcome problems associated with the reference position. The object of this paper is the clarification of the mechanism of the blow-open process, especially the dynamics of forces at contact opening. Therefore, the information about dynamics of current, voltage and displacement will be used directly from the experimental data, rather than derived from the equations to es-timate each force component during separation. The mathemat-ical model should describe dynamics of blow-open phenomena as a chain of consecutive stages before and after arc ignition, including the pre-arcing stage of contact separation, which con-tinues from the start of opening to arc ignition at the first contact pair , transition stage up to arc ignition at the second contact pair , and arcing stage. Each stage should be considered sep-arately.
IV. PRE-ARCINGSTAGE OFCONTACTSEPARATION
A. Dynamics of Forces
The duration of the pre-arcing stage of contact separation can be obtained from the oscillogram (the zone in Fig. 2). This stage should be divided into two periods. The first period lasts from the start of current passing into attainment of the melting temperature on the contact surface. The second period continues from melting temperature to arc ignition at .
The total force acting on the contacts at the pre-arcing stage can be represented as the sum of components
(1)
The force of the contact spring is defined by the expression
(2)
where is the initial value of this force in closed contacts, and is the spring constant.
In the case of a double-break bridge contacts the force exerted on each contact is
(3)
The force of elastic-plastic deformation of contact zones acting in both contacts, and , which compensates the spring force in the state of closed contact (after melting it becomes to equal zero), is defined by the formula
(4)
where is the radius of contact spot, is the coefficient of surface treatment (in considered case ), and is the contact hardness [1] depending on the temperature.
The electrodynamic magnetic force acts initially on both contacts of double break contact system, therefore the Holm’s expression for the force [1] should be multiplied by the factor 2 and the resulting formula is
(5)
where is the current, is radius of the contact cross-sec-tion.
The force appearing due to pinch pressure from the electrode jet can be estimated from the expression [15]
(6)
The gravitation force is equal to for vertical orien-tation of the contact system and to 0 for horizontal orienorien-tation. In the considered case, the force components and are negligible in comparison with the other force components in the (1).
Electrodynamic force , which appears in both con-tact constriction zones at the first period simultaneously with rising current, reduces the contact force and develops a micro-motion of contacts. Strictly speaking it is decompression of elastic-plastic deformation in the constriction zone rather than the motion of contacts. This displacement occurs only away from the contact zone, and laser sensors mounted on contact members record it, while the contact plane remains unmoved in the axial direction. The reduced contact load is counterbalanced by the elastic-plastic force . The dependence of on displacement at this micro-motion is negligible , thus one can derive from (2), (4) and (5) the equation
(7)
which should be solved with respect to taking into account the dependence of hardness on temperature which can be found in handbooks.
B. Dynamics of Contact Radius and Temperature
to Fig. 1 ( m /s, s, m ) one can conclude that Fourier criterion is very large, thus the quasi-stationary approach (A9) is correct. Attainment of the melting temperature at the centre of the contact spot occurs at the time that can be calculated from the equation
(8)
giving the value ms.
The second period of the pre-arcing stage consists of two steps. The first one is the melting of contact spot, which starts from and continues up to the time of boiling attain-ment ms that can be found from Fig. 2 (point ). The second step is boiling with a duration from to the time of arc ignition ms at the contact , which can easily be found from oscillogram (point ). It is interesting to note that the solution of the equation
(9)
gives the same value of , that confirms the correctness of the applied model.
The temperature distribution in liquid and solid zones at melting step can be represented by the expressions (A16) and (A19). The contact radius and the melting isotherm can be found from the conditions (A7) and (A8).
All three zones and should be considered at the boiling step. The temperature fields in liquid and solid zones are described by the (A22) and (A19). The boiling isotherm can be found by the solution of the (A5). The main problem at model-ling is to find the temperature distribution in vaporized zone because of insufficient information about electrical and thermal conductivities of contact material in the vapour state. Therefore, it is reasonable to suggest that the spatial temperature -pro-file, which is defined by the expressions (A3) and (A14), is a parabola with a top maximum at the contact spot , which increases in time from boiling temperature to the tempera-ture of metallic vapour ionization , while the temperature at the boundary is equal to boiling value
(10)
The duration of the boiling stage is very short (a few hundred microseconds), thus we may assume the linear rise of tempera-ture maximum in time
(11)
where is the temperature of metallic vapours ionization oc-curring at the time . In considered case the corresponding po-tential of ionization is 7.72 V, thus ms in Fig. 2.
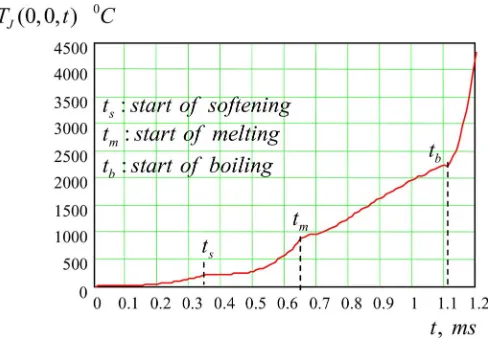
[image:4.594.307.549.66.230.2]Dynamics of the contact radius at the pre-arcing stage at the conditions of Fig. 2 is presented in Fig. 3. Corresponding temperature at the centre of the contact spot is shown in Fig. 4.
[image:4.594.305.549.262.431.2]The oscillogram shows that no motion of the contact oc-curs up to the time ms because the contact force is counterbalanced at this time by the elastic force in the contact
Fig. 3. Calculated dynamics of contact radiusr (t)at the pre-arcing stage.
Fig. 4. Dynamics of contact spot temperature due to Joule heating at pre-arcing stage.
pair . The radius of the contact spot decreases at the pre-soft-ening stage from to ms due to electrodynamic force . However, this decrease is very small (from 23 m to 22.8 m) and can be neglected. At the next stages one can see an increasing rate of contact radius due to the reduction of con-tact hardness accompanied by a corresponding decreasing rate of contact temperature at the softening point ms and melting point ms.
The axial distribution of temperature just before arc ignition is shown in Fig. 5.
The high temperature gradient in the vaporized zone indicates the importance of heat transfer inside the contact that should be taken into account in the power balance at arcing.
V. TRANSITIONSTAGE
A. The First Step of Transition
Fig. 5. Axial temperature distribution at the time of arc ignition in vaporized zoneD, melted zoneD and solid zoneD.
Joule heating is very important to clarify the mechanism of con-tact repulsion. The partial metallic vapour pressure can be esti-mated using formula
(12)
where is absolute gas constant, is atomic weight of contact metal, is the density of metallic vapour and is the vapour temperature (10) averaged over the volume of vapour
zone , i.e.
(13)
To find the law of power dependence of vapour electrical conductivity on vapour density at isochoric heating of non-ionized metallic vapour [14] was used
(14)
where ohm m and for silver if is
measured in kg/m . Therefore, if and are the values of vapour density, and are the values of electrical conduc-tivity of the vaporized zone at respective values of tempera-ture and , then
(15)
The law (15) remains to be correct for very high values of tem-perature and pressure, when the values and for metallic vapour approach corresponding values for solid metal, therefore the expression (15) can be written in the form
(16)
where and are density and electrical conductivity of the solid metal. In terms of electrical resistance of vaporized zone
this expression can be represented in the form
(17)
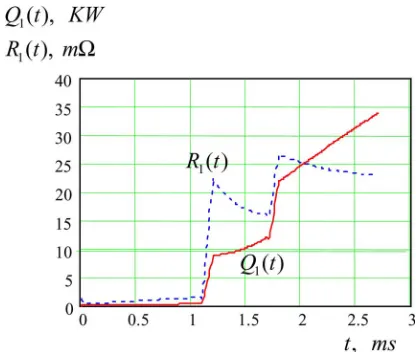
Fig. 6. ResistanceR (t)and powerQ (t)at the transition steps.
where and are the values of electrical resistance of the zone before and after vaporization. These values are determined from experimental data for power and resistance, which can be calculated as product and ratio between measured voltage and current. Results are presented in Fig. 6.
At both transition steps, step 1 (1.1 ms ms) and step 2 (1.7 ms ms) power and resistance can be considered linearly dependent on the temperature. Then metallic vapour pressure can be evaluated using formula (12) and corresponding force can be represented in the form
(18)
where is the surface area of vaporized zone which is the semi-ellipsoid of revolution about -axis (See the (A3) in Appendix)
This area can be calculated by the standard formula for a surface area of revolution of the curve
about -axes
Evaluating the integral we get
(19)
where . The calculation of vapour force at the arc ignition using expressions (12), (19) gives the value
N. The electrodynamic force at this time is
[image:5.594.323.531.64.240.2]Fig. 7. Dynamic of current density at transition stage.
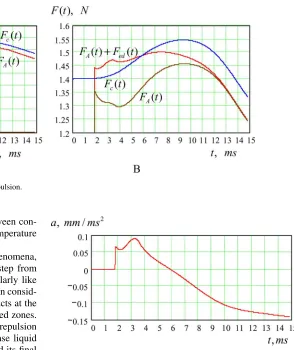
Fig. 8. Dynamics of forces at the transition stage.
Since the sum N is less than the
spring force N no contact motion occurs still at this time.
B. The Second and Third Steps of Transition
The two next steps of the transition stage are the melting of the second contact pair from s to s and its boiling from s to s. All characteristics for these steps can be calculated similarly like for the contact pair above. The contact is in the arcing state this time and its temperature should be calculated as the sum of two com-ponents (A23) taking into account both causes of heating, to vol-umetric Joule sources and surface source by arc heat flux. The Fourier criterion at this time ceases to be large due to increasing of contact radius at arcing. Therefore the quasi-stationary solu-tion of heat equasolu-tion should be replaced by non-stasolu-tionary so-lution with components defined by the expressions (A10) and (A26) similarly like it has been described in the paper [17].
The main peculiarity of this model is the expansion of the contact radius , i.e., arc root radius, during arcing. It is reasonable to suggest [9] that the arc root is attached to the expanding vaporized zone in the course of further arc evolution. Thus it is identified with the radius of boiling isotherm , which can be found as above from the condi-tions (A4)–(A5). Calculation shows that when arc ignites, the contact radius increases abruptly from 122 m to 570 m, thus
[image:6.594.83.246.236.402.2]the current density at the contact decreases significantly (Fig. 7).
It explains the appearance of high vapour pressure at explo-sion in contact zone due to Joule heating, which is however is not sufficient still to initiate contact motion. But estimation shows that for a current density greater than A/m contact repul-sion may start even at this first step.
The heat flux entering contact from arc should be cal-culated taking into account positive components due to arc ra-diation, electron (or ion) bombardment of anode (cathode) con-tact surface, inverse electrons from the arc column, and nega-tive components due to power losses for evaporation, radiation, electron emission cooling and heat conduction inside the contact body. The expressions for all these components can be found in the paper [11]–[13]. However the model in considered case can be simplified because the information about current, voltage and displacement is available from experiment. Therefore it is more convenient to use the arc power balance equation
(21)
Here, is the total power density generated by arc in a unit volume, which can be calculated directly from the measured values of arc voltage , arc current and contact dis-placement as
(22)
is power density consumed for contact heating and phase transformation. The last term in the right side of (21)
corresponding to the power density due to change of arc pressure is small and can be neglected. It can be easily estimated from the
expression .
The force due to arc plasma pressure consists of two components during arcing
(23)
The first component on the right side is caused by partial pressure of metallic vapours in plasma, while the second one appears due to partial pressure of heated gas (air). The relation (14) is not valid for plasma, thus Clapeyron equation should be used to calculate both components
(25)
(26)
Here, is the gas constant, is the volume averaged gas temperature, and are the atomic weights and mass of evaporated metal (index ) and gas (index ) in the
arc column, and is the arc volume. It
Fig. 9. Dynamics of forces for the whole duration of blow-off repulsion.
be identified with the region of evaporated zone between con-tact surface and isothermal surface of boiling temperature
(see Fig. 12).
The calculation of all parameters for consecutive phenomena, which occur on the contact pair at the second step from ms to ms, can be performed similarly like for the contact pair above. It should be noted that in consid-ered case no liquid metal bridge exists between contacts at the start of contact separation because of formed vaporized zones. However in the range of more high current the contact repulsion may be initiated by electromagnetic force. In this case liquid bridge appears at the initial stage of repulsion [8] and its final length should be added to the length of contact gap. This bridge length can be found as the product of bridge duration and opening velocity. The bridge duration may be calculated as the time corresponding to the boiling temperature. Alternatively it may be found directly from an oscillogram. Above described mathematical model can be applied in this case as well if the contact gap in the expressions (25) and (26) is replaced by
the sum .
Results of calculation the force components are shown in Fig. 8.
One can see that the metallic plasma force appearing due to Joule heating at the transition stage is much greater than the magnetic force . It becomes equal to the spring force due to Joule explosion in the second contact pair at ms, and then contacts begin to move. However the magnetic force being relatively small contributes as well into start of con-tact repulsion because the plasma force alone is not sufficient to overcome the spring force.
VI. ARCINGSTAGE. GASPRESSUREDUE TOARCHEATING
Further extension of contact gap and current rise increase the arc heat flux entering contact, rate of evaporation and gas pressure. Calculation of contact temperature using expression (23) shows that now arc component becomes much greater than Joule component and motive power is caused already by the gas plasma force, which is predominant in comparison with magnetic force [Fig. 9(A)]. It is interesting to note that in contrast to results published in [6] and [7], where the arc heat flux for radiation was 70%, in our case it is
calcu-Fig. 10. Acelerationa(t), mm/ms , versus timet, ms.
lated to be 35% only, while heat flux component due to electron and ion bombardment amounts to 65%. It seems that the sug-gestion concerning 70% portion of arc heat flux for radiation may be correct only for high current which was used in above referred papers. At the time when current ceases to increase, gas pressure becomes to decrease and at critical time ms it is equalized with spring force. However reverse motion begins later at ms (the point D in Fig. 2) due to inertia of con-tact motion.
VII. EXPERIMENTAL VERIFICATION OF
FORCESDYNAMICSMODELLING
Verification of above considered modelling of force dynamics could be achieved by comparison of calculated contact motion due to resulting force with measured values of contact displace-ment. The resulting motive force can be obtained from the expression
(27)
Corresponding acceleration is
pre-sented in Fig. 10.
The contact displacement can be calculated by the for-mula
[image:7.594.88.307.62.235.2]Fig. 11. Measured (solid) and calculated (dashed) contact displacement.
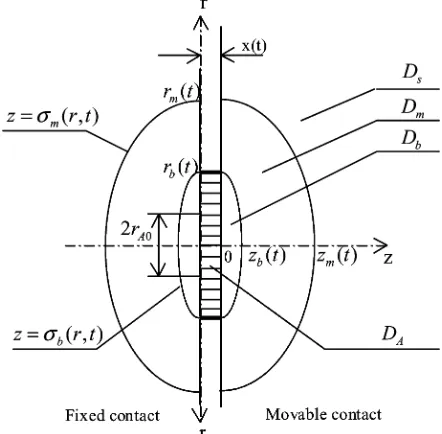
Fig. 12. The arc and contacts geometry: arc regionD , evaporated zoneD, melted zoneD and solid zoneD.
Results of calculation using MathCad and data in Fig. 10 in comparison with experimental data from oscillogram in Fig. 2 are presented in Fig. 11.
One can see a good agreement of measured and calculated values of contact displacement. It should be noted that presented above mathematical model may be simplified significantly if we use the experimental information about contact displacement for direct calculation of acceleration and total force rather than for verification of the model.
The mechanism of blow-open repulsion and dynamics of forces in the range of high current may be different. In this case above considered model can be applied, but now elec-tromagnetic force may be responsible for initiation of contact separation with appearance of liquid metal bridge, while vapour force becomes important at further stages of repulsion.
VIII. CONCLUSION
Contact separation at blow-open repulsion in a double-break contact pair in the current range about 1 KA may be initiated by metallic vapour pressure due to contact material explosion at Joule heating before arc ignition. The current density at the pre-arcing stage may be a few orders greater than during arcing. No liquid bridge appears at the pre-arcing stage.
Electromagnetic force being relatively small in comparison with the force of vapour pressure inputs contribution neverthe-less to the initiation of contact blow-off process at the pre-arcing stage (see Fig. 12).
Further stage of repulsion is caused by increasing of arc heat flux and plasma gas pressure due to intensive evaporation of contact material. Magnetic force at this stage plays a minor role. Quasi-stationary model of heat transfer can be applied at the pre-arcing stage due to great values of Fourier criterion. The temperature fields in contacts during arcing should be described by non-stationary heat equations for solid, liquid and vaporized zones with moving boundaries of phase transformations.
Above considered model can be applied for the range of high current with some modification.
APPENDIXI
TEMPERATUREFIELD INELECTRICALCONTACTS
Each member of a contact pair can be considered as a body occupying the cylindrical half-space region
.
The region occupied by arc at blow-off repulsion can be con-sidered as a cylindrical disk
interacting with contact surface, which radius is much greater than contact gap (see Fig. 12). This interaction re-sults into phase transformations of contact material and forma-tion of three zones:
1) the zone of evaporated material ;
2) the zone of melted material
if and if
;
3) the solid zone , if ,
and if .
The free moving boundaries of phase transformation between solid and liquid zones and between liquid and vapour zones can be considered in quasi-sta-tionary approximation as ellipsoids of revolution around -axis
with half-axes along axial
direction and along radial direction correspond-ingly. The values can be calculated from the
and . Then the volume of
evaporating atoms can be identified with half-ellipsoid
and the rate of evaporation required for calcula-tion of metallic vapours pressure can be found. Finally we can calculate the metallic vapour pressure in the arc column which volume is equal to . We assume here that the arc root coincides with the zone of boiling on the contact surface: . That is a well known ordinary assump-tion [7], [9], [14].
The dynamics of contact heating can be described by the heat equations for temperature (indexes and 2 correspond to the zones and relatively)
[image:8.594.53.274.222.439.2]where , and are thermal capacitance, thermal conduc-tivity and electrical resisconduc-tivity respectively. The electrical poten-tial can be expressed as [5], [12]
(A2)
where is the electrical current, and is the current con-ducting contact radius. The function can be found from the equation
i.e.
(A3)
The boundary conditions on the interface can be expressed as
(A4)
(A5)
Here, is the boiling temperature of contact material,
is the total heat flux (arc power per unit contact area) entering the surface from heated vapour. It consists of many components, such as heating due to ion bombardment, electron emission cooling, radiation etc. which are different for anode and for cathode. They are described and defined in [12]. To a first approximation one can suggest that total arc power should be divided into equal parts for anode and for cathode [1]. In
this case . The flux component
is the portion of total flux consumed for evaporation of contact material, which can be found by the expression [16]
(A6)
where and is specific heat for evaporation, is density of contact material. It is well known Stefan’s condition for the liquid-gas phase transformation [16].
The boundary conditions on the interface are similar if we replace boiling index by melting index
(A7)
(A8)
with heat flux consumed for melting
(A9)
It is the Stefan’s condition for solid-liquid phase transformation [16].
Each stage of contact separation should be considered sepa-rately.
1) Initial Stage of Contact Separation: At this stage zones
and vanish, no arcing occurs, thus the right side of (A5)
is equal to zero. The solution of the (A1) for averaged values of and in the temperature range before melting can be pre-sented for this stage in the form [16]
(A10)
where is the Green’s function defining by the for-mula
(A11)
and is the thermal diffusivity of contact material. In a time range, for which dimensionless time (Fourier
cri-terion) is sufficiently large, , the
quasi-stationary model for Joule heating can be applied, and then the formula (A6) transforms into more simple expression [5], [10]
(A13)
where
(A14)
(A15)
is electrical resistivity before heating and is its temper-ature coefficient for the solid material. It should be noted that the introduction of the new variable (A14) transforms the
half-infi-nite region into segment .
The initial stage comes to the end at the time
when the temperature at the contact surface reaches the melting value . This time can be found from the equation or from oscillograms as the time corresponding to the melting voltage.
The estimation of Fourier criterion shows that quasi-sta-tionary model can be applied as well for following contact separation up to arc ignition.
2) Melting: The melting stage of contact separation is
char-acterized by appearance of two zones, melted and solid . The quasi-stationary solution of the (1) gives the temperature distribution in the melted zone in the form
(A16)
This function satisfies the stationary heat equation and the con-ditions
(A17)
Similarly the expression (A19), shown at the bottom of the page, satisfies the stationary heat equation for the solid zone and the conditions
(A20) (A21)
The melting isotherm can be found from the (A8) by sub-stitution of the expressions (A16) and (A19) and replacing of
by .
3) Evaporation: The temperature distribution in melted zone
after the time , when the temperature at the contact spot becomes equal to boiling value , becomes the form (A22), shown at the bottom of the page, while the temperature in the solid zone describes by the previous expression (A19).
The boiling isotherm should be calculated using the (A5).
4) Arcing: The Fourier criterion at arcing is not sufficiently
large due to sharp increase of current conducting radius, there-fore the quasi- stationary model ceases to remain correct and non-stationary solution of the (A1) should be found. It can be represented in the form
(A23)
where and are the temperature
components due to volumetric Joule heating and due to heating of contact surface by arc heat flux. The first term in the right side is defined by the expressions (A19) and (A22) for solid and liquid zones, while the second term can be written as
(A24)
with the Green’s function defined by the ex-pression (A11). Calculation shows that the role of con-tact heating by flux is more significant. If the heat fluxes obeys the normal Gauss’s radial distribution (this assumption is accepted by many authors: [7], [9], [14])
(A25)
then the integral with respect to in the formula (A24) can be calculated and the expression for the contact temperature be-comes more simple form
(A26)
APPENDIXII
PROPERTIES OFCONTACTMATERIALS
Fixed contact AgC DF. Composition: 3.8 wt% of (2.3% of
-fibres, 1.5% of -particles),Ag the rest
Density kg.m
Heat capacity J.m
Electrical conductivity
Softening temperature C
Melting temperature C
Boiling temperature C
Potential of metal ionization V
Work function V
Young’s modulus N.m
Thermal conductivity W m C
Temperature conductance
m s Its temperature coefficient C
Hardness N m
Latent heat of melting J m
Latent heat of evaporation J m Potential of gas ionization V
Electric field coefficient V m
Movable contact Ag (80%)–Ni(20%)
Density kg m
Heat capacity
J m C
(A19)
Electrical resistivity m
Softening temperature C
Melting temperature C
Boiling temperature C
Potential of metal ionization
V
Work function V
Heat conductance W m C
Temperature conductance
m s
Its temperature coefficient C
Hardness N m
Latent heat of melting J m
Latent heat of evaporation J m
Potential of gas ionization V
Electric field coefficient V m
REFERENCES
[1] R. Holm, Electric Contacts, 4th ed. New York: Springer Verlag, 1981, pp. 316–337.
[2] E. M. Belbel and M. Lauraire, “Behaviour of switching arc in low-voltage limiter circuit breaker,”IEEE Trans. Comp., Hybrids, Manu-fact. Technol., vol. CHMT-8, no. 1, pp. 3–12, Mar. 1985.
[3] S. Ito, Y. Kawase, and H. Mory, “3-D finite element analysis of repul-sion forces on contact system in low voltage circuit breakers,”IEEE Trans. Magnetics, vol. MAG-32, no. 3, pp. 1677–1680, May 1996. [4] Y. Kawase, H. Mory, and S. Ito, “3-D finite element analysis of
electrodynamic repulsion forces in stationary electric contacts taking into account asymmetric shape (invited),”IEEE Trans. Magnetics, vol. MAG-33, no. 2, pp. 1994–1999, Mar. 1997.
[5] S. N. Kharin, “Transient thermo-physical phenomena at the pre-arcing period during opening of electrical contacts,” inProc. 37th IEEE Holm Conf. Elect. Contacts, Chicago, IL, 1991, pp. 53–65.
[6] J. J. Shea, B. De Vault, and Y.-K. Chien, “Blow-open forces on double-break contacts,”IEEE Trans. Comp., Hybrids, Manufact. Technol. A, vol. 17, no. 1, pp. 32–37, Mar. 1994.
[7] J. M. Yos, “Transport properties of nitrogen, hydrogen, oxygen, and air to 30 000 K,” AVCO Corp., Tech. Memo RAD-TM-63-7, 1963. [8] X. Zhou and P. Theisen, “Investigation of arcing effects during contact
blow open process,” inProc. 44th IEEE Holm Conf. Elect. Contacts, Arlington, VA, 1998, pp. 100–108.
[9] G. V. Butkevich, G. S. Belkin, N. A. Vedeshenkov, and M. A. Zhavoronkov, Electrical Erosion of High Current Contacts and Electrodes. Moscow, Russia: Energya, 1978, pp. 256–, in Russian. [10] M. Bizjak, S. N. Kharin, and H. Nouri, “Influence of vapour pressure
on the dynamics of repulsion by contact blow-off,” inProc. 21st Int. Conf. Elect. Contacts, Zurich, Switzerland, 2002, pp. 268–275. [11] S. N. Kharin, H. Nouri, and T. Davies, “Influence of inductance on the
arc evolution in AgMeO electrical contacts,” inProc. 48th IEEE Holm Conf. Elect. Contacts, Orlando, FL, 2002, pp. 108–119.
[12] S. N. Kharin, “Mathematical model of the short arc phenomena at the initial stage,” inProc. 43rd IEEE Holm Conf. Elect. Contacts, Philadel-phia, PA, Oct. 20–22, 1997, pp. 289–305.
[13] S. N. Kharin, “Post bridge phenomena in electrical contacts at the initial stage,”IEEE Trans. Comp., Packag., Manufact. Technol. A, vol. 19, no. 3, pp. 313–319, Sep. 1996.
[14] I. G. Panevin and V. I. Khvesuk, “Low-temperature plasma,” inTheory and Calculation of Near-Electrode Processes. Novosibirsk, Russia: Nauka, 1992, vol. 10, pp. 139–167.
[15] P. G. Slade, Electrical Contacts. Principles and Applications. New York: Marcel Dekker, Inc., 1999.
[16] L. I. Rubinstein, Stefan Problem. Riga, Latvia: Zvaigzne, 1980. [17] S. N. Kharin, H. Nouri, and T. Davies, “The mathematical models of
welding dynamics in closed and switching electrical contacts,” inProc. 49th IEEE Holm Conf. Elect. Contacts, Washington, DC, Sep. 2003, pp. 107–123.
Stanislav N. Kharinreceived the Ph.D. degree in mathematical physics from Institute of Thermo-physics, Russian Academy of Sciences, Novosibirsk, Russia, in 1990.
From 1991 to 1996, he was Professor and Head of the Laboratory of Mathematical Physics Equations, Institute of Mathematics, Kazakstan Academy of Sci-ences, Timiriazev. From 1996 to 2001, he was a Vis-iting Professor at the GIK Institute of Engineering Sciences and Technology, Topi, Pakistan. Since 2001, he has been a Visiting Professor at the University of the West of England, Bristol, U.K. He is a Specialist in mathematical modeling of phenomena in electrical contacts and low-temperature plasma. He has written more than 200 research papers, three books, and 10 patents.
Dr. Kharin was elected as Foreign Fellow of the Pakistan Academy of Sci-ences, in 1998.
Hassan Nouri(M’00–SM’04) received the B.Sc. degree from the University of Nottingham, Not-tingham, U.K., the M.S.c., degree from the Univer-sity of Strathclyde, Glasgow, U.K., and the Ph.D. degree from the University of Plymouth, Plymouth, U.K., all in electrical and electronic engineering.
He is a Reader in electrical power and energy at UWE Bristol UK. He is currently the Chairman of the European Electromagnetic User Group EEUG and the Director of the Power Systems and Elec-tronics Research Group at the University of the West of England (UWE), Bristol, UK. Dr Nouri is active in the review of a number of books and IET/IEEE journals as well as conference proceedings. He is also an editorial board member for a number of international electrical journals. His research interests include the analysis of power systems, electric arc phenomena and the application of power electronics, neural networks, fuzzy logic and FE in power engineering.
Dr. Nouri is a Member of the IEEE Power Engineering Society and various International Power Engineering Committees. In 2004, he received the IEEE PES Chapter Outstanding Engineer Award in recognition of outstanding service in Power Engineering Research and to the UKRI Chapter.
Martin Bizjakreceived the Diploma, M.Sc., and Ph.D. degrees from the Fac-ulty of Science and Technology, University of Ljubljana, Slovenia.