(Un)bounded: Rethinking “The Border” with New Visualization Technologies By
Ellen Currin
Senior Honors Thesis Department of Geography
University of North Carolina at Chapel Hill
March 30, 2015
Approved:
John Pickles, Thesis Advisor
Elizabeth Olson, Reader
Altha Cravey, Reader
Abstract
Western state cartography has produced the common understanding of “the border” as the line between two sovereign areas, but this simplistic view is now being challenged by practices of critical cartography and geography. Academics, activists, artists, and government institutions are developing new understandings of the border as multifaceted phenomena of performance, experience, movement, and conflict. These modern understandings require more complex methods of representation. This thesis investigates how new cartographic and visualization technologies can contribute to a new, more complex understanding of “the border.”
IMPORTANT NOTE: This thesis contains many dynamic and interactive figures and
should be viewed in digital format. Please read and explore this thesis project at
http://ellencurrin.github.io/unbounded/. Thanks!
Contents
List of Figures -- 4 Preface -- 5
Introduction
MAPPING IT ALL OUT -- 7 Chapter One
CARTOGRAPHY AND THE CREATION OF THE BORDER -- 9 What is “The Border”?
Sovereignty: Not as Simple As You Think The Power of Maps
The Rise of Nation-States and The Rise of Cartography Counter Cartography
Drawing and Interpreting Lines Chapter Two
UNDERSTANDING THE BORDER -- 22 Border As Wall
Border Regime No Border
Border Externalization
Border as Experienced/Performed Conclusion
Chapter Three
REPRESENTING THE BORDER WITH NEW VISUALIZATION TECHNOLOGIES -- 42 An Introduction to Digital Geovisualization
Mapping Temporally Dynamic Borders Mapping Spatially Concurrent Borders
Exploring and Creating New Border Landscapes Mapping the Performed Border
Mapping Non-Cartesian Borders Conclusion
Conclusion -- 57 References – 60
Digital Version -- http://ellencurrin.github.io/unbounded/
List of Figures
1-1 South Asian Territorial Claims, The Economist -- 11 1-2 Map of Coochbehar -- 12
1-3 Territory of the US: a patchwork of jurisdictions and rights, by Bill Rankin -- 14 1-4 McArthur’s Universal Corrective Map of the World -- 19
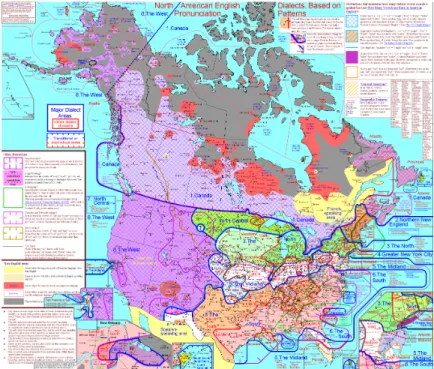
2-1 North American English Dialects, by Rick Aschmann -- 23 2-2 NPR’s Borderland Project -- 24
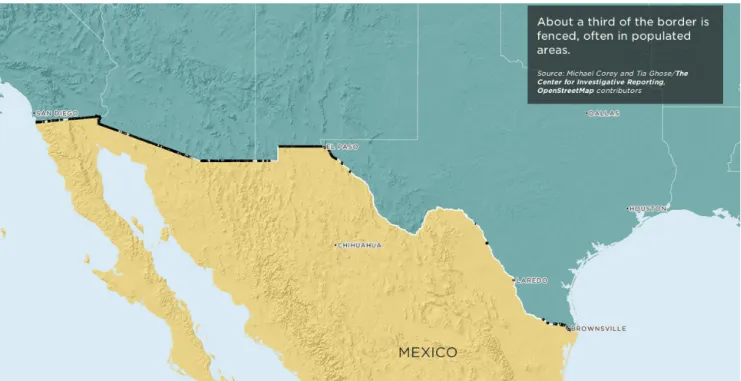
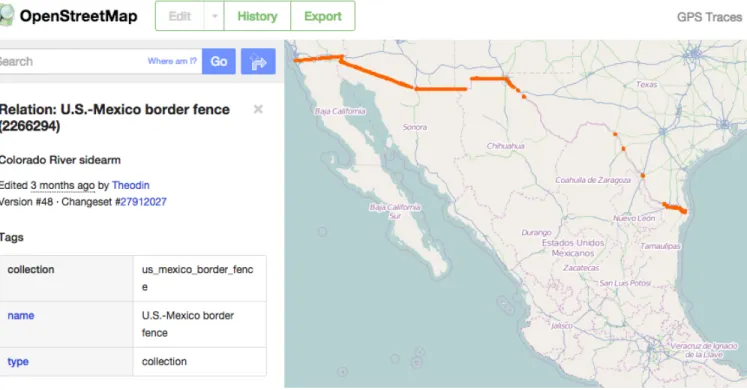
2-3 OpenStreetMap data on the US-Mexico border fence -- 25 2-4 Thin White Line, by Bill Rankin -- 26
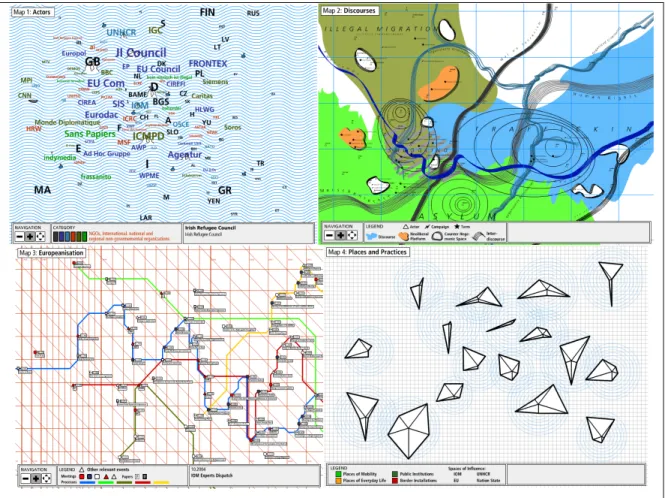
2-5 The Midwests, by Bill Rankin -- 27 2-6 MigMap, by Transit Migration -- 29
2-7 Transborder Map 2012, by the no border network -- 30
2-8 Cartografia Critica Del Estrecho Gibraltar, by Hakitectura -- 31 2-9 i-Map, by ICMPD -- 33
2-10 Dying At the Gates of Europe, Le Monde Diplomatique -- 34 2-11 Erase the Border, by The Institute for Infinitely Small Things -- 36 2-12 The Border Crossed Us, by The Institute for Infinitely Small Things -- 37 2-13 The US Mexico Border Project, by Susan Page -- 38
2-14 Latino/a America, by Pedro Lasch -- 39 3-1 US-Mexico Border History 1 -- 44 3-2 US-Mexico Border History 2 -- 45 3-3 British Geographies -- 46
3-4 UNC Solar Dashboard -- 48 3-5 Twin Cities -- 50
3-6 Twin Cities -- 52
3-7 Non-Cartesian Geographies of Religion -- 55
Preface
This thesis came about as a means to two separate ends. First, I wanted a chance to explore a deeply rooted interest in borders. This interest began in fifth grade, where our social studies curriculum included world geography. I remember thinking that the division of countries was so arbitrary and I wondered if we couldn’t simply redraw them or abolish them all together.
This led to several arguments with my classmates who were much more willing to accept the natural existence of borders than I was, but my skepticism persisted. While I never quite
accepted that borders needed to exist, I never thought to question what exactly “the border” was until my second semester as a Geography major.
In the Fall of 2012, I attended a presentation about the political enclaves and exclaves along the Indian-Bangladeshi border. The existence of these small land-locked islands made me question everything I thought I knew about sovereignty, territory, and borders. Regardless of their necessity or natural existence, I had always assumed these sorts of geographic entities were clear-cut. Sovereignties suddenly became blurry, and the lines that once divided them ceased to exist. At least, they ceased to exist in the way I had always assumed. I undertook this thesis with the hope of using my theoretical education in geography to answer a few of my personal
questions about borders.
I also undertook this thesis with the hope of researching and applying new digital
mapping practices. My interest in interactive mapping developed out of frustration with the
limits of traditional and often outdated GIS practices, and a desire to expand my spatial analysis
and data communication toolsets. For the past year I have immersed myself in the world of web
design, coding, and open source data in order to gain the skills I need to begin making the sort of
digital cartographies that I imagine. Practicing and perfecting new my own technological skills
became an important part of this project, thus while I could have relied solely on the (more advanced) work of others to conduct my analyses, I chose to build own examples. While my visualization examples might not be technically perfect, my understanding of the technologies I discuss is much deeper now that I have tried them out myself.
In addition to borders and visualization technology, my fascination with and coursework in linguistics has been an influencing factor in the direction of this paper. Linguistics has
impacted the way I think about discrete categorization and meaning, both of which are relevant not only to language but also to the discussion of mapping and borders. Not only do maps use language, but they are a sort of language of their own. Denis Wood, a cartographer and scholar whose ideas have greatly influenced my work, also uses linguistic theories as a way to
understand how maps make meaning and myth. As Wood explains, “Every map is at once a synthesis of signs and a sign in itself,” (Wood and Fels, 1986:54).
Looking back on the process of this thesis, I have accomplished both the theoretical and
technological goals I set out to achieve, but in ways I had never predicted. I learned that all
borders, not just the borders of political enclaves, are complex and contradictory. I also learned
that technology is not necessarily as important as perspective when trying to generate and
communicate new understandings.
Introduction MAPPING IT ALL OUT
For centuries, borders have been thought of, and represented, as static, linear, and black- and-white, but recent studies and practices of critical cartography and geography are
complicating this simplistic view. Just as cartography has been key in constructing this prevailing understanding of “the border”, it can also challenge, disrupt, and supplant “the border.” This thesis investigates how digital cartographic and visualization technologies can contribute to a new, more complex understanding of “the border.”
Before directly addressing this central question, it is important to explore what exactly the prevailing understanding of “the border” is and where this understanding came from. Chapter One identifies and problematizes the traditional explanation of the border as the line between two sovereign areas, and it traces the practice of bounding land back to the rise of the nation-state and the coterminous rise of Western state cartography. Chapter One also addresses why maps, by their propositional nature, are well positioned to create and enforce borders.
Chapter Two then asks: Who/what is challenging the traditional understanding of the
border, and where/how are these challenges being developed? It looks at a broad sample of
cartographies that each approach and/or expose the border in different ways. The examples,
which come from academics, activists, artists, and government institutions, serve as a survey of
diverse border perspectives. Additionally, they provide glimpses into the different techniques
and technologies that are being used to explore and expand the border. I do not argue that any
particular understanding is better than the rest, but rather suggest that the border is made up of
the culmination and co-occurrence of many understandings and the simultaneous spectacles that
they produce.
Chapter Three investigates how new cartographic and visualization technologies can help represent, produce, and explore a complex and multi-spectacled understanding of the border.
Using my own work as examples, I present and evaluate the use of several digital technologies in border-related cartographies. Chapter three finds that interactivity, animation, customization, and multimedia integration make digital maps better suited than paper maps for the representation of multifaceted, multidimensional data. Additionally, the chapter confronts the assumption that spatial attributes necessarily have Cartesian locations, and it concludes that digital and paper cartographies alike should critically consider and accordingly represent the relationship between
“the border” and Cartesian space.
Borders are increasingly being understood as a complex phenomenon of performance, experience, movement, and conflict. While technology is not necessary for creating new
understandings of “the border,” it does support the sort of advanced and complex representations of space that new understandings of “the border” demand. While this thesis does draw from many theoretical and conceptual sources, it is first and foremost a practical exploration and demonstration of the role of visualization, especially digital visualization, in constructing and understanding borders. I hope that this thesis can convince others to incorporate new
visualization technologies into their attempts to overturn historical cartographic convention and
redefine “the border” in meaningful ways.
Chapter 1
CARTOGRAPHY AND THE CREATION OF “THE BORDER”
What is “The Border”?
In 1976, Raymond Williams wrote “Keywords: A Vocabulary of Culture and Society” in order to describe and discuss words which, he says, “are significant, binding words in certain activities and their interpretation” and “significant, indicative words in certain forms of thought.”
The word “border” was excluded from his work, but modern geography scholars, arguing that this term now demands a critically deconstructive analysis just as much as William’s keywords, have remedied this in a new piece of work titled “New Keywords: Migration and Borders,”
(Casas-Cortes, et al. 2014). According to the authors, “the discursive currency of these terms, and much of what has come to be commonplace in popular understandings about borders and migration, is the product of a rather short (global) history,” (1-2).
Consider the definition below from the Oxford English Dictionary:
bor·der ˈbôrdəәr/ noun 1. a line separating two political or geographical areas, especially countries. "the German border with Denmark" 2. the edge or boundary of something, or the part near it. "the northern border of their distribution area"
This definition seems to capture the popular understanding about borders, but it is far from
adequate. As Raymond Williams explains in the beginning of “Keywords”, “When we come to
say ‘we just don’t speak the same language’ we mean [...] that we have different immediate
values or different kinds of valuation, or that we are aware, often intangibly, of different
formations and distributions of energy and interest,” (11). In other words, “particular terms and
phrases acquire quite discrepant and even contrary meanings over time and across space, such that the same words – and the conceptual categories that they index – can be so variously deployed, from one idiomatic usage to the next, as to appear to no longer refer to the same things,”(Casas-Cortes, et al. 2014: 2). The O.E.D. definition tells us that a border is “a line separating two political or geographical areas,” but what is a “geographical area” except a piece of the earth demarcated by a border? This definition tells us that a border is the edge of
something. But what thing?
Sovereignty: Not As Simple As You Think
Modern sovereignty-related research generally relies on the basic assumption that the world’s territory exists in “non-overlapping, juridical autonomous spaces” (Murphy, 2005: 281) and that the only question is how authority in those spaces is exercised (R. Jones, 2009: 376).
But, as Reece Jones reminds us, “the traditional definition of sovereignty as the unambiguous
connection between a single sovereign entity and a clearly defined territory is, of course,
increasingly contested,” (376).
Pakistan’s Claims China’s Claims India’s Claims
Figure 1-1. “South Asian Territorial Claims,” The Economist.
For one, territory is not always so “clearly defined,” as Figure 1-1 illustrates. A Pakistani man and an Indian woman might have very different ideas about the “line” which separates their
“two political or geographical areas.” A Kashmiri insurgent would likely disagree with them
both, siting the “edge or boundary” of a space that neither the Pakistani man nor the Indian
woman recognizes as legitimate.
A border dispute happens when two (or more) powers claim the same land. Sometimes, however, two powers really do have ownership over the same land. According to West’s
Encyclopedia of International Law, a condominium is “a non-self-governing territory over which two states share administrative control.” Other times, a single sovereign territory contains
“exclaves”- pieces of land that are politically attached to a larger piece but not physically conterminous with it because of surrounding foreign territory (Webster's Encyclopedic Unabridged Dictionary of the English Language, 1989).
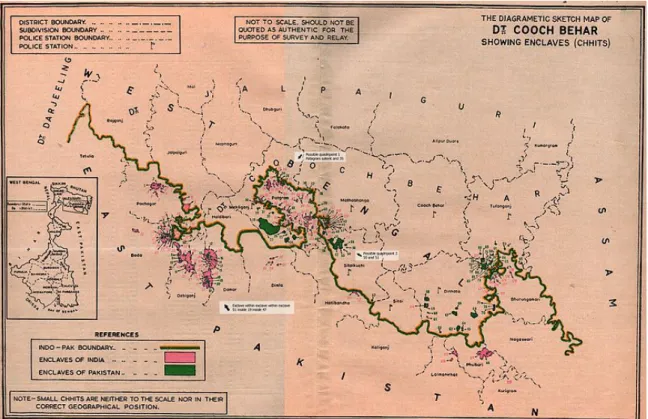
Figure 1-2. “Coochbehar map” by Cyberpunk7282, Wikimedia Commons.
Along the India-Bangladeshi border, there are 198 enclaves/exclaves. 92 are Indian
exclaves, surrounded by Bangladesh, and 106 are Bangladeshi exclaves, surrounded by Indian
territory (see Figure 1-2). There are 24 “second-order” exclaves, which sit within an enclave, and
enclave within an exclave within an enclave (Whyte, 2002). In many of the Indian exclaves, residents are dependent on Bangladeshi infrastructure, and the Bangladeshi Taka is used as the sole currency (R. Jones, 2009: 377). As Jones points out, “the existence of the enclaves
undermines the claim of an unambiguous connection between a sovereign authority, a particular territory, and a single people,” (377). There are hundreds more of these political
exclaves/enclaves around the world.
Harder to define yet similar in nature to the existence of exclaves are embassies, military bases, special economic zones, even international airports. The legal and political regulations that govern sovereignty and rights in these spaces are often quite different from those in the surrounding area. If you ask someone to draw “The United States,” you would most likely receive an image of the 48 contiguous states. But if we take into account the reality of overseas territories (as Bill Rankin has done in his map titled “The Territory of the United States: a
patchwork of jurisdictions and rights”, Figure 1-3), “The United States” looks quite a bit messier.
Figure 1-3. Excerpts from “The Territory of the United States: a patchwork of jurisdictions and
rights,” by Bill Rankin, from radicalcartography.net.
Sometimes the “line” between two geographical areas is neither cleaved (as it is with enclaves) nor contested (as it is with disputed borders). Sometimes the line is just plain shifty.
Tides move in and out on coastlines, changing the continental shapes our desk globes suggest.
Polar ice caps are receding and expanding by the season despite their static white presence sandwiching our world maps. It is convenient to consider sovereignty in black-and-white terms, because then we can define “border” as the crisp line between one jurisdiction and another. But the truth is, sovereignty is a gray area, and “border” is a gray area, too. As Denis Wood preaches,
“land isn’t divided except in our heads and on our maps,” (Wood, Fels, and Krygier, 2010:49)
The Power of Maps W=F*d
Work= Force*distance
Maps work. They help us get where we are going, they tell us what school district we are
assigned to, they declare international boundaries that (most) people accept and respect. If you
know the shape of Texas, you probably know it because of a map. Cartographer and scholar
Timothy Stallmann explains that the question “How do maps work?” can be answered in two
ways (2012: 11). The first way is psychological, concerning itself with how readers perceive and
interpret maps. The second and perhaps more important way is concerned with the power of
maps and their role in society. As Denis Wood reminds us, “work is the application of a force
through a distance, and force is an action that one body exerts on another to change the state of
motion of that body,” (Wood, Fels, and Krygier, 2010:1). Indeed, maps don’t only work, they do
work. Maps have a powerful ability to persuade and propose. They are “engines that convert social energy into social space, social order, knowledge,” (Wood, Fels, and Krygier, 2010:6).
Until the work of J.B. Harley in the 1980s, maps tended to be understood as records of geographic fact (Stallman, 2012). Harley was one of the first people to bring critical theory to the study and deconstruction of maps, encouraging others to think of maps not as mirror
representations of ‘the world’, but as representations of the context and environment in which maps are produced. By reading “between the lines”, Harley argued that the context of the map could be discovered, providing clues to what was included on the map as well as what was omitted (2001: 45). Building off of Harley’s work, Denis Wood argues that maps are not only not representations of the world, but that they are in fact propositions. Wood explains that maps make their propositions through “postings,” which are visual and linguistic claims that ‘this is here,’ (Wood, Fels, and Krygier, 2010).
In the introduction to the Rethinking the Power of Maps, Wood uses a Wake County school district map to illustrate power of maps. First, a map is needed to create- to propose- the existence of school districts. Before they are drawn, the districts literally don’t exist! But who requires residents of Wake County to abide by the proposition of the districts? The map is backed up by the force of the school board, which is backed up by the law, which is backed up by the police and the military. While this logic might seem a bit extreme, Wood reminds us of when the National Guard had to enforce the rights of black students to attend integrated schools in the south.
Usually, however, the use of force to defend what is drawn on a map is not needed. This
is because we tend to accept the communications of a map as fact, and arguing with reality
doesn’t seem worthwhile. To quote Wood, “The most fundamental cartographic claim is to be a
system of facts, and its history has most often been written as the story of its ability to present those facts with ever increasing accuracy,” (Wood and Fels, 1986: 63). In the past century, cartographers and scholars have constructed this fundamental cartographic claim through the professionalization of cartography (Wood, Fels, and Krygier, 2010:132). Ultimately, the attempt to separate Cartography (as an academic science) from the “handicraft” of map-making has been quite successful, thus further masking the indexical (or context-dependent) nature of maps (Turnbull and Watson, 1993). “Naturalizing” the map (i.e. defining it as a mere representation of the earth’s surface) has universalized it and helped “obscure the map’s origin in the rise of the state,” (Wood, Fels, and Krygier, 2010:19).
The Rise of Nation-States and The Rise of Cartography
Another source of the map’s power, hardly separable from it’s propositional logic, is its ability to “give us a reality beyond our reach,” (Wood, Fels, and Krygier, 2010:15).
“Ultimately,” says Wood, “the map presents us with the reality we know as differentiated from the reality we see and hear and feel,” (Wood, Fels, and Krygier, 2010:16). Maps tell us what our country looks like and where we are within it. Maps are what tell us that a physical country exists at all!
Maps are so common in our daily lives that it is hard to imagine a time without them.
Wood reminds us, however, that Genghis Khan, Charlemagne, the Roman emperors, and the
pharaohs all ruled without maps, and that the Bible was written without ever referring to one
(Wood, Fels, and Krygier, 2010:18). Wood’s extensive research on the history of map making
has shown that maps have really only been around since the sixteenth century. “People create
maps only when their social relations call for them,” says Wood, “and the social relations that
most insistently call for maps are those of the modern state,” (Wood, Fels, and Krygier, 2010:
19). Modern states require a territory to rule over, and maps provide them exactly that.
The common understanding of maps is that they simply abstract and represent things that already objectively exist, but Thongchai Winichakul’s study of Siam (now Thailand) revealed a relationship that was entirely reversed. According to Thongchai, the map “was a model for, rather than a model of, what it purported to represent,” (1994:310). Ultimately, Thongchai argues that the formation of Thailand as a modern nation-state would have been impossible without the map. Richard Helgerson claims a similar thing about Elizabethan England: that the cartographic representation of England had an ideological effect that strengthened national identity and loyalty (1992:144). The map’s ability to construct the spaces that it eventually seems to merely represent is what Matt Sparke calls “the recursive proleptic effects of mapping,” (1998:466).
Thongchai Winichakul (1994) has coined the term “geo-body” to describe the bounded spaces that maps construct. Geobodies, with their concrete edges, are controllable and ownable.
They present themselves as “visually and territorially unified constructs,” creating national unity between people who might otherwise be disjointed by geographic, political, or ideological distances, (Wood, Fels, and Krygier, 2010:31).
In sum, maps are not mirror representations of reality. Rather, as Wood eloquently puts it,
“maps are an argument about existence,” (Wood, Fels, and Krygier, 2010:34). Geobodies, and
by extension borders, are created through mapping, which means that borders are nothing more
than arguments about a particular space. Anyone can use a map to make an argument, but the
arguments that become ‘naturalized’ as common sense in our society are the ones that come from
those with the loudest voices, those with the most power.
Counter Cartography
In this thesis, I borrow Tim Stallman’s use of the term “Western state cartography,” to describe a type of cartography which purports to be objective and ‘expert’; contains a state-ist and capitalist viewpoint which sees the Earth as a patchwork of bounded and ownable territorial units; and presents cartography as an empirical science (2012: 141).
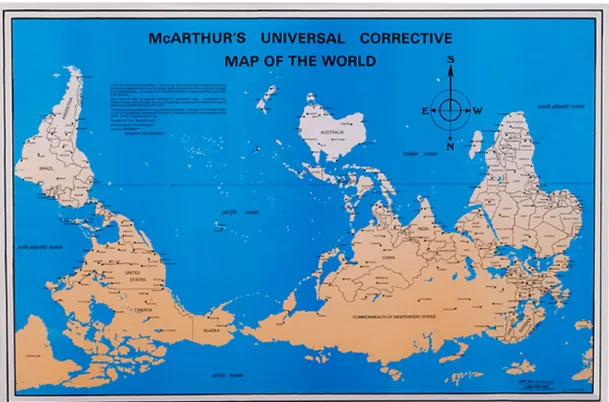
Counter mapping (also called “counter cartography” or “critical cartography”) has been questioning the hegemonic effects of Western state cartography for decades. In 1979 McArthur published his “Universal Corrective Map of the World” (Figure 1-4) to protest the prejudice for North-as-up orientation. His purpose is written plainly on the map: “Never again to suffer the perpetual onslaught of "downunder" jokes -- implications from Northern nations that the height of a country's prestige is determined by its equivalent spatial location on a conventional map of the world.”
Figure 1-4. "McArthur’s Universal Corrective Map of the World" by Stuart McArthur, copyright
ODT.
While McArthur literally turned cartographic convention on its head, others have employed strict cartographic norms to gain recognition for their counter-hegemonic causes. For example, since the early 1970s, indigenous mapping movements have questioned the control of the state and reclaimed titles to tribal lands using the same cartographic weapon that was used against them in the first place (Wood, Fels, and Krygier, 2010:147). As Bernard Nietschmann has said, “More indigenous territory has been claimed by maps than by guns. And more Indigenous territory can be reclaimed and defended by maps than by guns,” (1995: 34).
Indigenous counter-maps, for example, played a fundamental role in the creation of Nunavut out of Inuit land formerly considered part of British Colombia (Wood, Fels, and Krygier, 2010). In a map-obsessed society like our own, bounding historically unbounded territories is a precursor to them being recognized by the State.
Other counter cartographies are more concerned with exploring space and finding new ways to orient ourselves within it. As the Cartac collective writes, “Even though the map is not the territory, to make maps is to organize oneself, to generate new connections and to be able to transform the material and immaterial conditions in which we find ourselves immersed. It isn’t the territory but it definitely produces territory,” (,qtd. in Mendez de Andes et al. 157).
Cobarrubias and Cortes point out that this idea resonates with Fredric Jameson’s (1991)
suggestion that we need a new sort of “global cognitive mapping” to reorient ourselves in a
postmodern world (qtd. in Casas-Cortes and Cobarrubias 2007: 63). Other groups, such as
Hakitectura (which I discuss later), have taken this idea even further, using cartography as a tool
to actually create and enforce new physical spaces.
Counter cartography is a tool used by many different groups for vastly different causes, but intentionally or not, nearly all of them argue against the objectiveness of maps by demonstrating their subjectiveness.
Conclusion: Drawing and Interpreting Lines
Swedish Geographer Gunnar Olson once asked, “What is a geography if it is not the drawing and interpreting of a line?” In the introduction to A History of Spaces, John Pickles builds off of this question by asking, “What is the drawing of a line if it is not also the creating of new objects?” (Pickles, 2004: 3).
1Western state cartography, both influencing and influenced by the rise of nation-states, has drawn many lines and created many objects. Ultimately, it is responsible for our common understanding of “the border” as the line between two discrete sovereignties. This understanding is wrapped up in state-ist and capitalist viewpoint that sees the Earth as a patchwork of bounded and ownable territorial units (Stallman, 2012: 142). But maps and borders are contestable, and new ideas about the border are now being created and explored. A central part of this creation and exploration is redrawing the border on the map or even erasing it all together. Building off of the knowledge that maps have the power to define “the border”, Chapter Two will investigate a diverse array of cartographies and the equally diverse stories that they tell about where and what “the border” is.
1
Gunnar Olsson, cited in Pickles, A history of spaces, p. 3. The quotation is from a presentation
entitled ‘On persuasion and power’, to the Committee on Social Theory, University of Kentucky, 29
March 1991.
Chapter 2
UNDERSTANDING “THE BORDER”
“Land isn’t divided except in our heads and on our maps.” -Denis Wood
Wood’s quote intends to show that the division of land is artificial, but it also admits that the division is real. The power of maps is that they can create divisions- districts, territories, even borders- through their propositions. Borders, as manufactured as they may be, do exist, and they have real impact on politics, economics, societies, and individual lives. And if the map creates the border, then understanding the border is simply a matter of deciding what the map says about it.
Border as Wall
The rise of the nation-state required that land (as well as the people living on the land) be discretely bound, organized, and controlled. This produced a modern capitalist space that, Lefebvre (1991) explains, is “abstracted and organized as decorporealized, bureaucratized, and commodified,” (Sparke, 1998: 464). The international political and economic climate at the turn of the century, emphasized by World War I, further necessitated the participation of discrete nation-states.
2State cartography (and the militant enforcement of that cartography) produced these bounded bodies and thus produced their borders. Rather, it could be said that it produced a spectacle of their borders. According to Casas-Cortes, et al., a border spectacle is a social relationship between people that is mediated by images (2014:12). Western state cartography
2