Modelling the Drying Kinetics of Canola
in Fluidised Bed Dryer
Hamid Reza GAZOR and Ahmad MOHSENIMANESH
Agricultural Engineering Research Institute, Ministry of Agriculture, Karaj, Iran
Abstract
Gazor H.r., Mohsenimanesh A. (2010): Modelling the drying kinetics of canola in fluidised bed dryer. Czech J. Food Sci., 28: 531–537.
Canola, one of the new oil seeds in Iran, is investigated for drying in Batch fluidised beds. Experiments were con-ducted to assess the kinetics of drying in the temperature range of 30–100°C. The drying rate was found to increase significantly with increasing temperature. The drying rate was compared with various exponential time decay models and the model parameters were evaluated. The approximate diffusion and logarithmic models were found to match the experimental data very closely with the maximum root Mean Square Error (rMSE) less than 0.02. Considering fewer differences in the model evaluation factors and friendly use, logarithmic model was recommended for model-ling canola drying. The experimental data were also modelled using Fick’s diffusion equation, the effective diffusivity coefficients having been found to be from 3.76 × 10⁻¹¹ m2/s to 8.46 × 10⁻¹¹ m2/s in the range of experimental data
covered in the present study. For the process, the activation energy was calculated to be 11.03 kJ/mol assuming an Arrhenius type temperature reliance.
Keywords: canola; fluidised bed; drying kinetics; food grain drying; activation energy
Canola oil is one of the good vegetable oils that have been developed rapidly in many parts of world such as Iran. The plants are generally harvested before fruits are fully ripe to reduce shattering. Conventionally, canola is harvested when seeds have 12–14% (d.b.) moisture content. The north provinces of Iran have high relative humidity and rainfall in the harvesting season, thus the moisture content of canola can reach more than 16% (d.b.) during harvesting. For safe storage, the moisture content of the harvested canola oil seeds needs to be reduced to less than 8% (d.b.) (Ward et al. 1985). Batch, continuous flow, and bin drying are the methods which have been employed for canola drying (Mujumdar 1995). However, they are slow and with high energy consumption, therefore it is necessary to study some other methods to improve the drying process of canola.
Due to a better heat and mass transfer, shorter drying time, better quality of the products obtained,
The knowledge of drying kinetics is important in the design, simulation, and optimisation of drying processes. Drying curves are usually modelled by defining the drying rate constants based on first order kinetics. Numerous mathematical models have been developed to calculate the time of drying under the given operating conditions (Mujumdar 1995; Turner & Mujumdar 1996). This range of analytical models solved with a variety of simplifying assumption leads to purely empirical models often built by regression on experimental data. An example is the exponential equation to model time-tempera-ture variation of the reduced moistime-tempera-ture content for various seeds and vegetables dried in the pulsed FB dryer (Gawrzynski & Glaser 1996).
A series of empirical models based on exponen-tial time decay have been developed to represent the drying kinetics of agricultural materials in FB dryer (Senadeera et al. 2003; Bauman et al. 2005; Srinivasakannan 2008). The Page model was found to match the experimental data very closely for mustard drying (Srinivasakannan 2008). It was found that the drying takes place only in the falling rate period for beans, potato, and peas. Both the simple (exponential) and Page models could be used to describe the drying behaviour, but the Page model was shown to describe the drying be-haviour more accurately (Senadeera et al. 2003). Therefore, the objectives of this study are: – to study the effect of temperature on air drying
kinetics of canola seed samples in a fluidised bed dryer,
– to fit the drying curves with six empirical mod-els,
– to calculate the diffusivity coefficients of the samples and the activation energy.
MATERIALS AND METHODS
Experimental procedure.Canola seeds used in the experiments were collected randomly from an Agricultural Engineering research Institute (AErI) farm in Karaj and transferred to the laboratory in PE plastic bags in order to conduct the drying experiments. Table 1 shows the physical charac-teristics of Canola seed as well as the experimental conditions covered in the present study.
The drying experiments were conducted using a fluidisation column with the internal diameter of 0.2 m and a height of 0.3 m and were replicated three times. The air distributor was 1.5 × 10⁻³ m
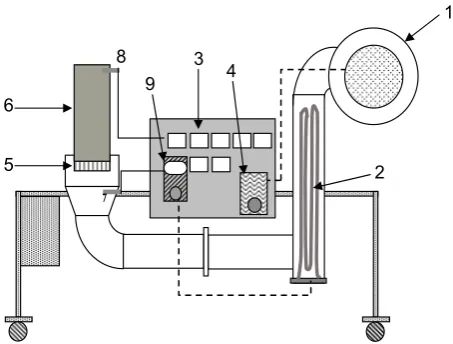
thick with 5 × 10⁻³ m perforations having 40% free area. A fine wire mesh was attached over the distributor plate to arrest the flow of solids from the fluidised bed into the air chamber. Air blower with the volumetric discharge capacity of 500 m3/h was used. The outlet air from the dryer column was metered using a calibrated anemometer (Lutron AM-4205, Taipei, Taiwan) after the fluidisation column. The electrical heater consisted of three 1 kW rating heating elements. A temperature controller, provided to the air chamber, facilitated the control of the air temperature within ± 1°C of the temperature set (Figure 1).
[image:2.595.305.533.114.278.2](1) blower, (2) electrical heters, (3) thermometers, (4) blower regulator, (5) air distributor, (6) dryer column, (7) inlet thermocouple, (8) out let thermocouple, (9) inlet air ther-mostat
[image:2.595.304.531.499.671.2]Figure 1. Schematic of fluidized bed dryer
Table 1. Characteristics of the seed and the range of ex-perimental parameters
Seeds parameter (Brassica napusCanola seed L.)
Shape of seeds spherical Size, dp × 10–3 (m) 1.90 Particle density (kg/m3) 670 Initial moisture content
of seeds* (% d.b.) 20
Temperature of fluidizing
air (°C) 30, 40, 50, 60, 70, 80, 90, 100 Fluidising air velocity (m/s) 1.0 Solid hold up (kg) 2.2
*for more uniformity of moisture content, seeds were conditioned
7 8
6
5
9 3
4
1
Air at the desired temperature and flow rate was allowed to flow through the fluidisation column. 2.2 kg canola with 20% (d.b.) of the initial mois-ture content was introduced into the column after ensuring steady temperature and air flow rate. The moisture loss was recorded in 30 min inter-vals with a digital balance of 1 g accuracy (Tozin Electric, Teheran,Iran). The pressure drop was measured by differential pressure meter (Testo 506 – Testo, Lenzkirch, Germany) blow of the drying column. The drying was continued until each sample reached the constant weight. The final moisture content of each sample was determined with the help of an atmospheric drying oven using AOCS (2003) method.
Analysis of process and modelling.The moisture ratio of the samples during drying was expressed by the following equation:
MR = M – Me (1)
Mi – Me
During drying, the samples in the FBD were not continuously exposed to uniform relative humidity and temperature. Therefore, the moisture ratio was simplified according to Pala et al. (1996), Doymaz (2004a), and Goyal et al. (2007), and expressed as:
MR = M (2)
Mi
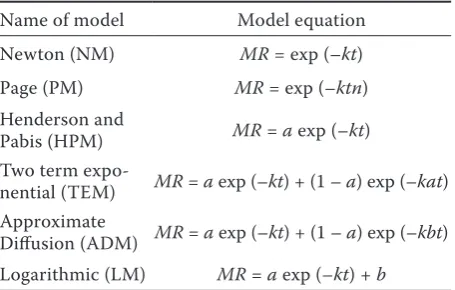
To select a suitable model for describing the drying process of canola seed, drying curves were fitted with six thin-layer drying equations (Table 2). Non-linear regression analysis was performed using Statistica 6.0 software package. The coefficient of determination (R2) was one of the main criteria for selecting the best equation. In addition to the
coefficient of determination, the goodness of fit was determined by other statistical parameters such as reduced mean square of the deviation (X2) and root mean square error (rMSE). For goodness fitting, R2 value should be higher and X2 and rMSE values should be lower (Sarsavadia et al. 1999; Togrul & Pehlivan 2002; Demir et al. 2004; Erenturk et al. 2004; Goyal et al. 2006; Akpinar & Bicer 2006; Srinivasakannan 2008). These parameters are calculated as follows:
(3)
(4)
Moisture diffusivity. Fick’s diffusion equation for the particles spherical in shape was used for the calculation of effective moisture diffusivity (Mujumdar 2000; Senadeera et al. 2003). Since the Canola seeds have spherical geometry, the equation is expressed as:
(5)
The effective diffusivity was calculated using the slopes method. The diffusion coefficient was typically calculated by plotting the experimental drying data in terms of ln(Mr) versus the drying time (Maskan et al. 2002; Goyal et al. 2006; Srinivasakannan 2008). Effective diffusivity can be expressed by using an Arrhenius type equation (Falade & Abbo 2007) as follows:
(6)
The Ea and Do coefficients can be subsequently related to the drying air temperature by applying non-linear regression analysis.
RESULTS AND DISCUSSION
Fluidisation
[image:3.595.64.292.613.758.2]A good fluidisation behaviour in terms of perfect mixing of the bed material was clearly observed. This was substantiated with a low fluctuation in the bed pressure drop, which was an indication for smooth fluidisation without slugs formation. As Figure 2 shows, pressure drop below of the seed Table 2. List of various simple models tested with the
drying data (Akpinar & Bicer 2006; Srinivasakan-nan 2008)
Name of model Model equation Newton (NM) MR =exp (–kt) Page (PM) MR =exp (–ktn) Henderson and
Pabis (HPM) MR = a exp (–kt) Two term
expo-nential (TEM) MR = a exp (–kt) + (1 – a) exp (–kat) Approximate
Diffusion (ADM) MR = a exp (–kt) + (1 – a) exp (–kbt) Logarithmic (LM) MR = a exp (–kt) + b
n N
MR
MR prei
n i i − − =
∑
= 2 , 1 exp, 2 ) ( χ 2 1 1 2 pre, exp, ) ( 1 RMSE » ¼ º « ¬ª
¦
ni MR i MR i N » » ¼ º « « ¬ ª 2 2 2exp 6 r t D
MR S eff
known and the experimental data are in concurrence with the basic concepts of the mass transfer. A higher bed temperature increases the moisture diffusion rate, resulting in an increased drying rate. All the observa-tions are in qualitative agreement with most of the earlier observations (Syahrul et al. 2002: Kudras & Efremov 2003; Topuz et al. 2004).
The experimental drying data were converted to the dimensionless moisture ratio (M/Mi) for the sake of comparison with various models. The simple exponential time decay models listed in Table 2, were compared with the experimental data.
Table 3 compares the model parameters along with the R2, X2, and rMSE values for all models. The rMSE values were found to be above 0.02 for all the models except the Approximation of Dif-fusion model (ADM) and the Logarithmic model (LM). It can be seen from the table that ADM matches the experimental data very closely, with the rMSE error equal 0.0126.
[image:4.595.303.530.82.228.2]The standard deviation between the experimental data and the model prediction was smaller than 0.0004 Figure 2. Pressure drop changes vs. air flow speeds Figure 3. Effect of temperature on drying process (Vout:
[image:4.595.62.288.83.231.2]1.0 m/s; W: 2.2 kg).
Table 3. Evaluated model parameters at operating conditions
Models Evaluated model parameters and coefficients
b k n A rMSE X2 R2
NM 0.792 0.0116 0.1041 – – 0.017500 –
PM 0.944 0.0035 0.0546 – 0.520637 0.131005 –
HPM 0.825 0.0107 0.0965 0.864356 – 0.014294 –
TEM 0.865 0.0082 0.0845 0.272140 – 0.047495 –
ADM 0.997 0.0002 0.0126 0.885148 – 0.030828 –0.086850
LM 0.995 0.0003 0.0165 0.835414 – 0.035451 0.179319
NM – Newton model; PM – Page model; HPM – Henderson and Pabis model; TEM – Two term exponential model; ADM –Approximation of Diffusion model; LM – Logarithmic model
bulk has increasing trend by rise up the air flow rate until moment of fluidising. It decreases from 596 Pa to 583 Pa after the threshold of fluidising and outlet air velocity of 1 m/s (Bauman et al. 2005; Srinivasakannan 2008).
Drying kinetics and modelling
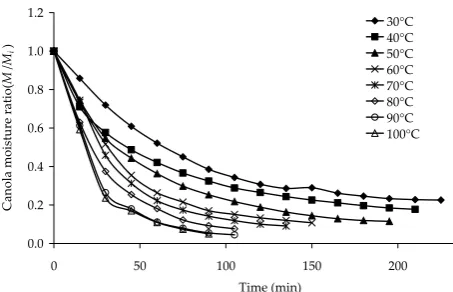
The experimental data generated in the present study are depicted in Figure 3as plots of canola moisture ratio (M/Mi) vs time. In general, it can be observed in Figure 3 that the duration of the constant drying rate period is insignificant as compared to the total drying time. The rate of drying was high at the early stage of drying and became low as the moisture content decreased. An increase in temperature increased the drying rate and that can be attributed to the higher bed temperature of the particles in the bed, which increases the intra particle moisture diffusion leading to a higher drying rate. The increased transport properties of the fluids with the increase in temperature has been well
0 100 200 300 400 500 600 700
0.0 0.2 0.4 0.6 0.8 1.0 1.2 Outletȱairȱvelocityȱ(m/s)
Pre
ss
ur
eȱ
dorp
ȱ(P
a)
0.0 0.2 0.4 0.6 0.8 1.0 1.2
0 50 100 150 200 250
Timeȱ(min)
C
an
ol
a
ȱ
m
oi
stu
re
ȱ
ratio(
M
/
Mi
)
[image:4.595.66.531.590.725.2]for ADM and LM. The comparison between ADM and LM showed that LM had a simpler form than ADM due to less difference between them. It follows that LM can be introduced as a suitable model for describing the drying kinetic of canola in FB.
Considering less difference between ADM and LM models evaluation factors and friendly use, LM has been recommended for modelling canola drying. Table 4 shows the specified coefficients of LM at different temperatures. Figure 4shows the proximity of the logarithmic model with the experimental data. The model parameters esti-mated the drying time as well as the designing and scaling up of the drying process.
Calculation of effective moisture diffusivity
[image:5.595.306.533.86.226.2]The effective diffusivity was calculated using the slopes method (Maskan et al. 2002; Doymaz 2004b). Table 5 shows the effective moisture diffusivity for Table 4. Specified coefficients at experimental tempera-tures for the logarithmic model
Temperature
(ºC) R2 a K b
[image:5.595.64.290.114.276.2]30 0.999 0.822350 0.015413 0.192238 40 0.996 0.775869 0.021012 0.189018 50 0.999 0.877656 0.021233 0.110473 60 0.999 0.923380 0.026423 0.089113 70 0.997 0.957696 0.028384 0.064102 80 0.999 0.950969 0.034426 0.051497 90 0.996 0.986383 0.041044 0.027275 100 0.995 0.982796 0.043 0.029348
Figure 4. Comparison of Logarithmic model prediction with the experimental data (40, 60, 80 and 100°C).
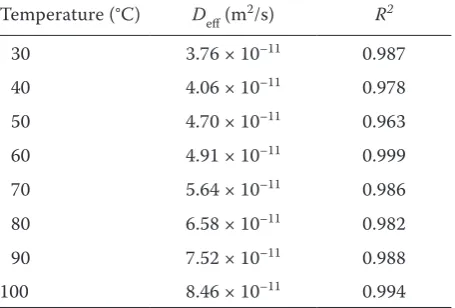
Table 5. Effective moisture diffusivity for drying of canola seeds
Temperature (°C) Deff (m2/s) R2
30 3.76 × 10⁻¹¹ 0.987
40 4.06 × 10⁻¹¹ 0.978
50 4.70 × 10⁻¹¹ 0.963
60 4.91 × 10⁻¹¹ 0.999
70 5.64 × 10⁻¹¹ 0.986
80 6.58 × 10⁻¹¹ 0.982
90 7.52 × 10⁻¹¹ 0.988
100 8.46 × 10⁻¹¹ 0.994
canola seeds drying. The values of the moisture diffusivity were found to vary in the range of 3.76 × 10⁻¹¹ m2/s to 8.46 × 10⁻¹¹ m2/s and were close to 1.69 × 10⁻¹¹ m2/s to 3.26 × 10⁻¹¹ m2/s given by Srinivasakannan (2008) for Mustard seeds. The effective diffusivity increases with the increase in dry-ing temperatures. These values are within the range of 10–8–10–12 m2/s for the drying of food materials (Uckan & Ulku 1986; Zogzas et al. 1994; Maskan
et al. 2002; Akpinar et al. 2003; Senadeera et al. 2003). In the present study, the estimated effective diffusion coefficient is compared with those for other grains reported in the literature and found to be within the same order of magnitude.
Plots of lnDeff versus reciprocal of absolute temperature (1/T) indicated a good fit with a high coefficient of determination (r2 = 0.977). The cal-culated activation energy showed that canola seeds required low activation energy for mass diffusion during FBD (11.03 kJ/mol). That was near to the activation energy for the drying of breadfruits seeds in the range of 40–70°C (Shittu & raji 2008).
CONCLUSION
The drying rate in FBD was found to be high at increased temperatures. In addition, the drying time decreased with increasing temperature.
The kinetics of drying was tested with various simple exponential decay models, Approximate Dif-fusion and logarithmic models having been found to match with the experimental data very closely.
The experimental data were modelled using fundamental Fick’s diffusion equation. The effec-tive diffusivity coefficients were estimated to be
0.0 0.2 0.4 0.6 0.8 1.0 1.2
0 50 100 150 200 250 Time (min)
C
an
ol
a
mo
is
tu
re
ra
tio
(
M
/
Mi
)
[image:5.595.64.292.604.758.2]from 3.76 × 10⁻¹¹ m2/s to 8.46 × 10⁻¹¹ m2/s for the entire range of the experimental data with R2 above 0.96. For the process, the activation energy was calculated as 11.03 kJ/mol assuming an Arrhenius type temperature reliance.
Nomenclature
M – moisture content of canola at any time (kg of moisture/kg of dry solid)
Mi – initial moisture content of canola (kg of moisture/ kg of dry solid)
Me – equilibrium moisture content of canola (kg of moisture/kg of dry solid)
Deff – effective diffusion coefficient (m2/s)
Do – pre-exponential factor of Arrhenius equation for effective
Ea – activation energy (kJ/mol)
MR – Moisture ratio diffusion coefficient MRexp. i – ith experimental moisture ratio
MRpre. i – ith predicted moisture ratio
R2 – coefficient of determination
X2 – reduced mean square of the deviation
rMSE – root mean square error r – canola radius (m)
T – temperature (K)
t – time (s)
N – number of observations
n – number of the drying model constants a, b, k – constants of the drying models
References
Akpinar E., Midilli A., Bicer Y. (2003): Single layer drying behavior of potato slices in a convective cyclone dryer and mathematical modeling. Energy Conversion and Management, 44: 1689–1705.
Akpinar E., Bicer Y. (2006): Mathematical modeling and experimental study on thin layer drying of strawberry. International Journal of Food Engineering, 2(1): Art 5. AOCS (2003): Official Methods and recommended
practices of the AOCS. Ba 2a-38.
Bauman I., Bobic Z., Dakovic Z., Ukrainczyk M. (2005): Time and speed of fruit drying on batch fluid beds. Sadhana, 30: 687–698.
Bobic Z., Bauman I., Curic D. (2001): rehydration ratio of fluid bed-dried vegetables. Sadhana, 27: 365–374. Borgolte G., Simon E.J. (1981): Fluid bed processes in
the manufacture of snack products. CEB review for Chocolate, Confectionary and Bakery, 6: 7–8, 10.
Demir V., Gunhan T., Yagcioglu A.K., Degirmen-cioglu A. (2004): Mathematical modeling and the determination of some quality parameters of air dried bay leaves. Biosystems Engineering, 88: 325–335. Diamattia D.G. Amyotte P.r., Hamdullahpur F.
(1996): Fluidized bed drying of large particles. Trans-actions of the ASAE, 39: 1745–1750.
Doymaz I. (2004a): Effect of pre-treatments using potas-sium metabisulphite and alkaline ethyl oleate on the drying kinetics of apricots. Biosystems Engineering,
89: 281–287.
Doymaz I. (2004b): Convective air drying characteristics of thin layer carrots. Journal of Food Engineering, 61: 359–364.
Erenturk S., Gulaboglu M.S., Gultekin S. (2004): The thin layer drying characteristics of rosehip. Bio-systems Engineering, 89: 159–166.
Falade K.O., Abbo E. (2007): Air-drying and rehydra-tion characteristics of date palm (Phoenix dactylifera L.) fruits. Journal of Food Engineering, 79: 724–730. Gawrzynski Z., Glaser r. (1996): Drying in pulsed- fluid bed with relocated gas stream. Drying technol-ogy, 14: 1121–1172.
Gibert H., Baxerres J.L., Kim H. (1980): Blanching time in fluidized beds. In: Linko P., Malkki Y., Olkku J., Larinkari J. (eds): Blanching Time in Fluidized Beds. Food Process Engineering; 1: Food Processing Systems. Applied Science Publishers, London: 75–85.
Giner S.A., Calvelo A. (1987): Modeling of wheat drying in fluidized beds. Journal of Food Science, 52: 1358–1363.
Goyal r.K., Kingsly A.r.P., Manikantan M.r., Ilyas S.M. (2006): Thin layer drying kinetics of raw mango slices. Biosystems Engineering, 95: 43–49.
Goyal r.K. Kingsly A.r.P., Manikantan M.r., Ilyas S.M. (2007): Mathematical modeling of thin layer dry-ing kinetics of plum in a tunnel dryer. Journal of Food Engineering, 79: 176–180.
Kalwar M.I., Kudra T., raghavan G.S.V., Mujumdar A.S. (1991): Drying of grains in a drafted two-dimen-sional spouted bed. Journal Food Process Engineering,
13: 321–332.
Kudras T., Efremov G.I. (2003): A quasi-stationary approach to drying kinetics in fluidized particulate materials, Drying Technology, 21: 1077–1090. Maskan A., Kaya S., Maskan M. (2002): Hot air and
sun drying of grape leather (pestil). Journal of Food Engineering, 54: 81–88.
Mujumdar A.S. (1995): Handbook of Industrial Drying. Marcel Dekker, New York.
Pala M., Mahmutoglu T., Saygi B. (1996): Effects of pre-treatments on the quality of open-air and solar dried products. Nehrung/Food , 40: 137–141. Sarsavadia P.N. Sawhney r.L. Panghavane D.r.,
Singh S.P. (1999): Drying behavior of brined onion slices. Journal of Food Engineering, 40, 219–226. Senadeera W., Bhandari B.r., Young G., Wijesinghe
B. (2003): Influence of shapes of selected vegetable ma-terials on drying kinetics during fluidized bed drying, Journal of Food Engineering, 58: 277–283.
Shittu T.A., raji A.O. (2008): Thin layer drying of african breadfruit (Treculia africana) seeds: Model-ing and rehydration capacity. Food and Bioprocess Technology. DOI 10.1007/s11947-008-0161-z. Srinivasakannan C. (2008): Modeling Drying Kinetics
of Mustard in Fluidized Bed. International Journal of Food Engineering, 4(3) Art 6.
Syahrul S., Hamdullahpur F., Dicer I. (2002): Exergy analysis of fluidized bed drying of moist particles. Exergy, 2: 87–98.
Togrul I.T., Pehlivan D. (2002): Mathematical mod-eling of solar drying of apricots in thin layers. Journal of Food Engineering, 55: 209–216.
Topuz A., Gur M., Gul M.Z. (2004): An experimental and numerical study of fluidized bed drying of hazel-nut. Applied Thermal Engineering, 24: 1534–1547. Turner I., Mujumdar A.S. (eds) (1996):
Mathemati-cal Modeling and NumeriMathemati-cal Techniques in Drying Technology. Marcel Dekker, New York.
Uckan G., Ulku S. (1986): Drying of corn grains in batch fluidized bed. Drying of Solids, Wiley Eastern Limited: New York: 91–96.
Ward J.T., Basford W.D., Hawkins J.H., Holliday J.M. (1985): Oilseed rape. Farming Press LTD, Nor-way.
Zogzas N.P., Maroulis Z.B., Marinos-Kouris D. (1994): Moisture diffusivity methods of experimen-tal determination. A review. Drying Technology, 12: 483–515.
received for publication October 4, 2009 Accepted after corrections February 4, 2010:
Corresponding author:
Dr. Hamid reza Gazor, Ministry of Agriculture, Agricultural Engineering research Institute, P.O.Box 31585-845 Karaj, Iran