Fertilization is a major factor in human activities to change soil environment under agricultural use. For a long time, a lot of researches attempted to explore the influence of fertilization on physical and chemical soil properties (Cao 2003, Wei et al. 2003). Recently, it was reported that soil quality can be well described by structure and function diversity of microbial community and form of the soil-microbial systems (Zhang and Chen 1998). According to Elton’s hypothesis, the diversity is higher as the ecosystems are more stable, which is recognized by most scholars (Marcel and John 1998, Xu 2001). Many research studies (Ananyeva et al. 1999, Simek et al. 1999) were carried out on the impact of fertilization on soil microbes in
agricultural systems. Microbial diversity became an indicator of soil situation (Luo 2003).
Dissolved organic nitrogen (DON) is likely a plex mixture of nitrogen-containing organic com-pounds with a wide range of sources, which can be passed through 0.45 μm membrane and which are soluble in water (Westerhoff and Mash 2002). In soil-microbial systems, despite the small proportion, DON is the most active chemical composition of soil nitrogen (Nsholm 1998). It can be interchangeable with other components of soil nitrogen under certain conditions, and always in a state of dynamic equi-librium; it has high bioavailability, and is easy to be decomposed by microorganism, which is an important source of soil nutrients (Perakis and Hedin 2002).
Effect of fertilization on composition and spatial distribution
of dissolved organic nitrogen in paddy soil-microbial systems
H. Zhang
1,2, Z. Zhao
2, X. Yi
3, Y. Lu
2, L. Cao
21
School of Environmental Science and Engineering, Shanghai Jiao Tong University,
Shanghai, P.R. China
2
Key Laboratory of Urban Agriculture, Ministry of Agriculture, P.R.C, Shanghai,
P.R. China
3
Shanghai Exit and Entry Inspection & Quarantine Bureau, Technical Center For Food,
Animal and Plant Inspection and Quarantine, Shanghai, P.R. China
ABSTRACT
Dissolved organic nitrogen (DON) has high bioavailability and is an important source of soil nutrients. In or-der to determine the concentrations and the composition of DON in different depths (0–30 cm), and provide a theoretical basis for further deep research into the paddy soil nitrogen supply, experiments based on the lysimeter method were carried out to investigate the effect of fertilization on composition and spatial distribution of DON in paddy soil. Paddy soil was treated under chemical fertilization treatment (CT) and mixed fertilization treatment (MT). With methods of PCR-DGGE and HPLC-MS, the results of the experiments suggested that the samples in 10–20 cm and 20–30 cm under MT had significantly higher bacterial diversity than those under CT except in 0–10 cm. DON had a high percentage (63.1–79.9%) in Ntot of soil solution. The results of the correlation analysis revealed that DON had a significant positive correlation with organic matter content, Shannon-Wiener diversity index (H') and a significant negative correlation with pH. The possible results of HPLC-MS identification of DON from paddy soil solution were that (a) 3-(4-thiazolyl)-l-alanine; (b) 2-phenylbenzimidazole-5-sulfonic acid; (c) 4-(2, 4-difluorophenyl)-3-nitrobenzene carbaldehyde; (d) fendizoic acid.
Keywords: microbial diversity; paddy soil; correlation analysis; HPLC-MS
In recent years, a considerable amount of research was carried out about DON, such as extraction, source, content, composition, structure and behavior (adsorption and degradation) in forest soil (Tipping et a1. 1999, Kalbitz et a1. 2000, McHale et a1. 2000) and many important results were achieved. However, there are fewer reports in agricultural systems. Paddy soil is special under long-term hydroponic use in China. Environmental problems caused by blind pursuit of rice yield catches the scientific community and the government’s growing concern (Zhao 2002). Therefore, the research on the effect of fertilization on composition and spatial distribution of dissolved organic nitrogen has great theoretical and practical significance.
In this study, based on the lysimeter method, the Polymerase Chain Reaction and Denaturing Gradient Gel Elecrophoresis (PCR-DGGE) and HPLC-MS analysis were conducted to determine the effect of fertilization on composition and spatial distribution of dissolved organic nitrogen in paddy soil-microbial systems. The purpose is to determine the content and the composition of DON in different depths (0–30 cm), and provide a theoretical basis for further deep research into the paddy soil nitrogen supply.
MATERIAL AND METHODS
Soil characterization and fertilization. The soil was collected from three layers (0–10 cm, 10–20 cm, 20–30 cm) in a closed volumetric lysimeter system
consisting of 6 experimental plant growth units (200 cm wide × 300 cm long × 250 cm deep) in the Irrigation Technology Extension Station in Qingpu District, Shanghai, China.
The soil is purple paddy soil originated from the swamp, and it belongs to heavy soils. The design for two fertilization treatments in the closed volu-metric lysimeter system is described in Table 1 and has been practiced for 4 years. The commercial organic fertilizer used was from Shanghai Yuanjian organic fertilizer plant, and the nutrients content were as follows: organic matter content 329 g/kg, total nitrogen 15.3 g/kg.
The soil samples were collected on 30th July,
2010 in baking period. Some of the soil proper-ties are described in Table 2. The experiment was replicated in a randomized split plot design. Soil samples (0–10 cm, 10–20 cm, 20–30 cm) taken randomly from three replicates of each treatment over the entire area were mixed.
[image:2.595.65.533.76.151.2]PCR-DGGE analysis. Total soil DNA was ex-tracted and purified from 1.0 g soil using a bead beating method (D5625-01 Soil DNA Kit (50), OMEGA). The DNA extracted was PCR-amplified with two primers as Muyzer et al. (1993). PCR was run using 25 μL reaction volumes. The reaction with landing strategy (Erik et al. 1999) was carried out as follows: 6 min initial denaturation at 95°C, followed by 20 cycles of denaturation at 94°C for 60 s, annealing at 65°C decreasing 0.5°C every step of the cycle for 45 s, and DNA extension at 72°C for 45 s; then another 20 cycles of denaturation Table 1. Design for two fertilization treatments (kg/ha)
Treatment Fertilizing species Amount of fertilizer Amount of pure N Total amount of pure N Chemical treatment
(CT) urea 830.8 382.5 382.5
Mixed treatment (MT)
urea 665.2
12142.8 306.076.5 382.5
commercial organic fertilizer
382.5 kg/ha is the average amount of nitrogen in rice field in the Shanghai region
Table 2. Physico-chemical properties of the soil tested after fertilization
Soil tested Depth (cm) Total organic carbon (g/kg) (mS/cm)EC Total nitrogen (g/kg) pH Soil bulk density (g/kg)
Chemical treatment
0–10 22.45 ± 1.28 1.56 ± 0.08 1.28 ± 0.15 6.65 ± 0.15 1.41 ± 0.12 10–20 20.16 ± 1.45 1.21 ± 0.13 0.95 ± 0.08 6.72 ± 0.08 1.37 ± 0.05 20–30 19..43 ± 1.92 0.94 ± 0.09 0.87 ± 0.03 6.78 ± 0.13 1.35 ± 0.03
Mixed treatment
0–10 22.87 ± 2.14 1.62 ± 0.05 1.33 ± 0.12 6.54 ± 0.06 1.26 ± 0.07 10–20 21.63 ± 1.63 1.33 ± 0.11 1.05 ± 0.13 6.63 ± 0.04 1.33 ± 0.01 20–30 20.28 ± 1.14 1.01 ± 0.02 0.94 ± 0.04 6.69 ± 0.11 1.34 ± 0.09
[image:2.595.62.538.617.746.2]at 94°C for 60 s, annealing at 65°C for 45 s, and DNA extension at 72°C for 45 s.
Sequence separation of the amplified mixture was operated by the DcodeTM Universal Mutation
Detection system (Bio-Rad, Hercules, USA). Electrophoresis was performed in a 0.8-mm-thick polyacrylamide gel (8% [wt/vol] acrylamide-bisacryl-amide [37.5:1]), which contains 30% to 60% ureafor-mamide denaturing gradient. The 40 μL of amplified mixture was subjected to a constant voltage of 60 V for 12 h at 60°C in 1 × TAE buffer (pH 8.0). After electrophoresis, it was stained by silver nitrate.
DON extraction and determination. Soil samples (0–10 cm, 10–20 cm, 20–30 cm) were treated with high speed centrifugation method to extract soil solution rapid soil liquid and solid separation equip-ment (Patents No. 200710041707.7). The soil was centrifuged at 5000 rpm for 30 min and the solution extracted was filtered through 0.45 μm membrane. Ntot, NH4+-N and NO3–-N of the soil solution were determined by the Kjeltec 2300 Analyzer Unit, and the concentration of DON from soil solution was calculated as the difference between Ntot and dissolved inorganic N.
HPLC-MS conditions. The soil solution ex-tracted was filtered through 0.45 μm membrane (organic microporous filter membrane). All solu-tions were stored at –20°C to prepare for HPLC-MS.
Instruments and reagents: Agilent 6410B Liquid chromatography – mass spectrometry, with Electrospray ion source (Agilent, Santa Clara, USA), solid phase extraction device (Supelco, Bellefonte, USA), homogenizer (Sang Yi Technology Co., Ltd. Beijing, China), Vortex shaker (Vortex Genie, New York, USA), and Nitrogen blowing instrument (Organomation, Worcester Berlin, USA). Acetonitrile was HPLC grade, and water was ultra-pure water (Millipore, Billerica, USA).
HPLC. Chromatographic separation was performed by: Agilent XDB-C18 HILIC (50 mm × 4.6 mm i.d., 1.8 μm particle size). The mobile phases consisted of 2% 5 mmol/L ammonium formate + 0.1% formic acid in water (A) and acetonitrile (B). The follow-ing isocratic elution program was used: 2% B for 1 min, increase to 99% at 4 min, held from 4 to 13 min, returned to 2% A at 13.1 min, and allowed to re-equilibrated for additional 7 min. The flow rate is 0.3 mL/min. Injection volume of sample was 10 μL and column temperature was set at 25°C.
MS parameters were as follows: capillary voltage, 4000 V; multiple reactions monitoring mode (MRM); nebulizer gas pressure 40 psi; drying gas temperature, 350°C; gas flow (N2), 10 L/min. The instrument was operated in positive ion mode scanning from m/z 100 to 1900.
Statistical analysis. Pictures of the DGGE gels were digitized with Quantity One Software (Bio-Rad, USA). The Shannon-Wiener diversity index (H') and homogeneous degrees index (E') nused to analyze the different treatments on the microbial communities were calculated from DGGE band data as:
(
Ni N) (
Ni N)
Pi Pi
H s
i s
i
ln ln
1
1
∑
∑
= =
− = −
= ′
Where: S – richness or total number of bands; Ni – intensity accounted for by the ith band, N=
∑
NiAll statistical analysis was performed with SPSS, version 13.0. Differences with values of *P < 0.05 (Paired-Samples t-test) were considered statisti-cally significant.
RESULTS AND DISCUSSION
[image:3.595.311.508.434.712.2]Diversity analysis of DGGE banding patterns. To determine the microbial diversity, PCR-DGGE was used. During the process of optimizing running conditions, DGGE profiles of triplicate samples were highly reproducible, and one random sample was selected in running DGGE to separate the microbial mixed DNA of paddy soil (Figure 1). Every band was highlighted with a line.
Figure 1. DGGE profiles of 16S rDNA fragments am-plified from DNA extracted from paddy soil under different fertilization treatment
S H E′= ′ ln
Chemical treatment
To compare DGGE patterns, Shannon-Wiener diversity index (H') and homogeneous degrees index (E') were determined for comparisons of all profiles (Table 3). There were significant differ-ences (P < 0.05) between the samples in 0–10 cm and 10–20 cm, 20–30 cm. The samples under CT had lower microbial diversity than those under MT except for CT 0–10 cm. According to the results of Table 3 and Figure 1, with increasing soil depth, microbial diversity under CT decreased.
A small subunit rRNA gene-based approach by Zhou et al. (1997), Tiedje et al. (2001) suggested that the contact among microhabitats only lasts for a very short time immediately after rain, when water bridges are formed in the soil. Rapid drainage in paddy soil drying maintains the spatial isolation among the various microhabitats of soil, and our experiments confirmed that microbial diversities were different from each other in different soil depths. Another hypothesis by Tiedje et al. (2001) to explain the large microbial diversity of surface soil is based on the presence of a greater variety and con-tent of organic compounds there than deeper. The results of Table 2 and Table 3 showed that H’ and E’ have not only positive correlation with organic matter content but also negative correlation with pH under both fertilization treatments when pH < 7. Different fertilizers affected soil nutrition and the
way to fertilize may also lead to such spatial distri-bution. Urea was applied in the surface while the organic fertilizers were mixed with soil in 0–30 cm and more fertilizer was stored in deep soil.
DON spatial distribution. The concentrations of nitrogen forms in soil solution were deter-mined (Table 4). NO3–-N was consistently in a small range (0.26–0.35 mg/L) and contributed 8.5–15.8% of Ntot from paddy soil under both treat-ments. NH4+-N were also low and in a small range
(0.36–0.44 mg/L) and contributed 10.7–21.9% of Ntot. In contrast to inorganic forms of nitrogen, DON was the dominant part in both treatments, accounting for 62.9–80.2% of Ntot.
Compared to other ecosystems, the DON con-centrations found in our experiments were higher than those in temperate forests (0.08–0.8 mg/L; Michalzik et al. 2001) and also higher than some agricultural sites in Germany (0.4–0.23 mg/L; Siemens and Martin 2002), and the higher pure N in fertilizations may lead to this; but the re-sults were lower than some grassland soil solu-tions (2.5–10 mg/L; Jones et al. 2004). The results presented here also confirmed previous studies showing that DON represents a major N pool in soil solutions of ecosystems (Murphy et al. 2000).
[image:4.595.64.532.86.207.2]To find the connection between DON and other facts in soil-microbial systems, correlation analysis Table 3. The number of DGGE bands; Shannon-Wiener diversity index (H') and homogeneous degrees index (E') of bacteria influenced by different treatments
Treatment Depth (cm) Band number H' E'
Mixed treatment
0–10 14ab 1.78 ± 0.02b 0.694 ± 0.003b
10–20 12a 1.60 ± 0.01ab 0.624 ± 0.002ab
20–30 13a 1.72 ± 0.01b 0.652 ± 0.002bc
Chemical treatment
0–10 15b 2.01 ± 0.02c 0.744 ± 0.005c
10–20 12a 1.45 ± 0.01a 0.584 ± 0.002a
20–30 12a 1.31 ± 0.02a 0.527 ± 0.004a
Data in the table are means ± SE; different letters represent a significant difference at P < 0.05
Table 4. Contents of nitrogen forms in soil solution extracted under different treatments and depths (mg/L)
Treatment Depth (cm) TN NH4+-N NO3–-N DON
Mixed treatment
0–10 1.78 ± 0.15a 0.39 ± 0.09a 0.27 ± 0.09a 1.12 ± 0.13a
10–20 3.63 ± 0.20b 0.41 ± 0.05a 0.31 ± 0.04ab 2.91 ± 0.05b
20–30 3.24 ± 0.12c 0.44 ± 0.12a 0.26 ± 0.08a 2.54 ± 0.08c
Chemical treatment
0–10 1.83 ± 0.08a 0.36 ± 0.06a 0.29 ± 0.05ab 1.18 ± 0.22a
10–20 3.66 ± 0.11b 0.41 ± 0.13a 0.33 ± 0.12ab 2.92 ± 0.14b
20–30 3.54 ± 0.13b 0.38 ± 0.07a 0.35 ± 0.13c 2.81 ± 0.07b
[image:4.595.64.532.626.746.2]was carried out. The results of Table 5 show that DON had a significant positive correlation with organic matter content, H' and a significant nega-tive correlation with pH in both fertilization treat-ments, but no significant correlation with TN of the soil, E', soil bulk density and total porosity. There was something to note that pH in different depths in both treatments was below 7. Combined with physico-chemical properties of the soil (Table 2) and H', we could find out that higher organic mat-ter content, H' and lower pH (< 7) had a positive impact on DON in the soil, and MT was better than CT to change physico-chemical properties and microbial diversity of the soil.
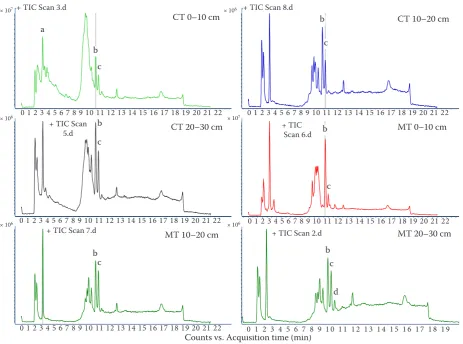
Compositions of DON identified through HPLC-MS. Finally, compositions of DON in different depths were identified through HPLC-MS (Figures 2, 3). The chemical forms of nitrogen in DON are essential for explaining the role of DON in agricultural systems processes. The compositions of DON in different depths were roughly the same, only CT 0–10 cm and MT 20–30 cm each had one special substance, which may be because of the higher microbial diversity. The details of DON compositions were as Figure 2. The HPLC-MS identifications of DON (Figure 3) were speculatively based on the following guidelines (1) m/z; (2) water solubility of the substance. The possible results of identifications were that (a) 3-(4-thiazolyl)-Table 5. Correlation analysis between DON in soil solution under different treatments and microbial indicators and soil physico-chemical properties
H' E' Organic matter content pH TN Soil bulk density Total porosity
CT 0.915* 0.752 0.951* –0.933* 0.755 0.609 0.686
MT 0.932* 0.815 0.969* –0.965* 0.717 –0.534 0.674
[image:5.595.66.533.87.139.2]*P < 0.05; CT – chemical treatment; MT – mixed treatment
Figure 2. HPLC chromatogram of DON in different depths under CT (chemical treatment) and MT (mixed treatment). (a) 3-(4-thiazolyl)-l-alanine; (b) 2-phenylbenzimidazole-5-sulfonic acid; (c) 4-(2, 4-difluorophenyl)-3-nitrobenzene carbaldehyde; (d) fendizoic acid
7 x10 0. 0. 0. 0. 0. 0. 0. 0. 0. 0. 0. 0. 0. 0. 0. 0. 0. 1 1. 1.
+ TIC Scan 3.d
Counts vs. Acquisition Time (min)
0 0.51 1.52 2.53 3.54 4.55 5.56 6.57 7.58 8.59 9.51010.51111.51212.5 1313.51414.51515.51616.51717.5 1818.51919.52020.5 2121.522 6 x10 1. 1. 1. 1. 2 2. 2. 2. 2. 3 3. 3. 3. 3. 4 4. 4. 4. 4. 5 5. 5. 5. 5. 6
+ TIC Scan 8.d
Counts vs. Acquisition Time (min)
0 0.51 1.52 2.53 3.54 4.55 5.56 6.57 7.58 8.59 9.51010.51111.51212.5 1313.51414.51515.51616.51717.5 1818.51919.520 20.5 2121.522
6 x10 1. 1. 1. 1. 2 2. 2. 2. 2. 3 3. 3. 3. 3. 4 4. 4. 4. 4. 5 5. 5. 5. 5. 6 6. 6. 6. 6. + TIC Scan 5.d
Counts vs. Acquisition Time (min)
0 0.51 1.52 2.53 3.54 4.55 5.56 6.57 7.58 8.59 9.51010.51111.51212.5 1313.51414.51515.51616.51717.5 1818.51919.52020.5 2121.522 7 x10 0. 0. 0. 0. 0. 0. 0. 0. 0. 0. 0. 0. 0. 0. 0. 0. 0. 1 1. 1. 1. 1. 1. 1. 1. 1. 1. 1.
+ TIC Scan 6.d
Counts vs. Acquisition Time (min)
0 0.51 1.52 2.53 3.54 4.55 5.56 6.57 7.58 8.59 9.51010.51111.51212.5 1313.51414.51515.51616.51717.5 1818.51919.520 20.5 2121.522
6 x10 1. 1. 1. 2 2. 2. 2. 3 3. 3. 3. 4 4. 4. 4. 5 5. 5. 5. 6 6. 6. 6. 7 7. 7. 7. 8
+ TIC Scan 7.d
Counts vs. Acquisition Time (min)
0 0.51 1.52 2.53 3.54 4.55 5.56 6.57 7.58 8.59 9.51010.51111.51212.5 1313.51414.51515.51616.51717.5 1818.51919.52020.5 2121.522 6 x10 1. 1. 1. 2 2. 2. 2. 3 3. 3. 3. 4 4. 4. 4. 5 5. 5. 5. 6 6. 6. 6. 7 7.
+ TIC Scan 2.d
Counts vs. Acquisition Time (min)
0.5 1 1.52 2.53 3.5 4 4.55 5.56 6.57 7.58 8.59 9.510 10.511 11.512 12.513 13.514 14.515 15.516 16.517 17.518 18.519 19.5
CT 0–10 cm CT 10–20 cm
CT 20–30 cm MT 0–10 cm
MT 10–20 cm MT 20–30 cm
a b c b b b b b c c c c c d
+ TIC Scan 3.d + TIC Scan 8.d
+ TIC Scan
5.d + TIC Scan 6.d
+ TIC Scan 7.d + TIC Scan 2.d
× 107 × 106
× 106
Counts vs. Acquisition time (min) 0 1 2 3 4 5 6 7 8 9 10 11 12 13 14 15 16 17 18 19 20 21 22
0 1 2 3 4 5 6 7 8 9 10 11 12 13 14 15 16 17 18 19 20 21 22 × 106
× 106
0 1 2 3 4 5 6 7 8 9 10 11 12 13 14 15 16 17 18 19 20 21 22 × 107 0 1 2 3 4 5 6 7 8 9 10 11 12 13 14 15 16 17 18 19 20 21 22
0 1 2 3 4 5 6 7 8 9 10 11 12 13 14 15 16 17 18 19 20 21 22
[image:5.595.67.531.372.716.2]l-alanine; (b) 2-phenylbenzimidazole-5-sulfonic acid; (c) 4-(2,4-difluorophenyl)-3-nitrobenzene carbalde-hyde; (d) fendizoic acid.
The major substances of ON compounds in soils include aliphatic-N (mainly amino-N and polysac-charide-N) and aromatic-N, like the compounds in soil humus (Courty et al. 2005). These compounds are found in plant litter, microbial biomass, and whole soils as well as in soil solution (Chen and Xu 2006, Roberts and Jones 2008). The size of ON compounds varies from monomers and oligomers as small as 31 g/mol to polymers on the order of one million g/mol (Jones et al. 2004, 2005). The results of HPLC showed that there were many peaks in the chromatogram (Figure 2), but only two or three of them could be detected because of the concentrations of substances (soil solutions were extracted with high speed centrifugation method, which led to the low concentrations but got more available substances in soil solutions).
The m/z of the results was from 172–318, and only a: 3-(4-thiazolyl)-l-alanine belongs to amino-N; amino-N was not the main part of the DON in paddy soil, especially in the deeper soil (10–30 cm).
REFERENCES
Ananyeva N.D., Demkina T.S., Jones W.J. (1999): Microbial bio -mass in soils of Russia under long-term management practices. Biology and Fertility of Soils, 29: 291–299.
Cao Z.H. (2003): Effect of fertilization on water quality-effect of fertilization on environment quality. Soils, 35: 353–363. Chen C.R., Xu Z.H. (2006): On the nature and ecological functions
of soil soluble organic nitrogen (SON) in forest ecosystems. Journal of Soils and Sediments, 6: 63–66.
Courty P., Pritsch K., Schloter M., Hartmann A., Garbaye J. (2005): Activity profiling of ectomycorrhiza communities in two forest soils using multiple enzymatic tests. New Phytolo-gist, 167: 309–319.
5
x10
0 0 1 1 2 2 3 3. 4 4. 5 5. 6 6.
+ Scan (2.2 min) 2.d
172.20000
158.20000
Counts vs. Mass-to-Charge (m/z)
148 150 152 154 156 158 160 162 164 166 168 170 172 174 176 178 180 182 184 186 188 190 192 194 196 198 200 202 204 206 208 210 212 214 216 218
5
x10
0 0 1 1 2 2 3 3
+ Scan (7.9 min) 2.d
274.30000
318.40000
Counts vs. Mass-to-Charge (m/z)
265 270 275 280 285 290 295 300 305 310 315 320 325 330 335 340 345 350 355 360 365 370 375 380 385 390
5
x10
0 0 0 0 0 1 1. 1. 1. 1. 2 2.
+ Scan (8.2 min) 2.d
279.20000
Counts vs. Mass-to-Charge (m/z)
270 275 280 285 290 295 300 305 310 315 320 325 330 335 340 345 350 355 360 365
4
x10
0 1 2 3 4 5 6 7 8
+ Scan (7.9 min) 7.d
318.30000
Counts vs. Mass-to-Charge (m/z)
[image:6.595.65.347.55.481.2]310 315 320 325 330 335 340 345 350 355 360 365 370 375 380 385 390 395
Figure 3. The possible results of HPLC-MS identification of DON from paddy soil solution. The identities of peaks (a, b, c, d) are the same as listed in Figure 2
b
c
d
+ Scan (2.2 min) 2.d
a
+ Scan (7.9 min) 2.d
+ Scan (8.2 min) 2.d
+ Scan (7.9 min) 2.d
× 105
× 105
× 105
× 104
158.20000
172.20000
274.30000
318.40000
279.20000
318.30000
Counts vs. Mass-to-Charge (m/z)
148 154 160 166 172 178 184 190 196 202 208 214
265 280 295 310 325 340 355 370 385
270 280 290 300 310 320 330 340 350 360
310 320 330 340 350 360 370 380 390
Corresponding author:
Linkui Cao, Shanghai Jiao Tong University, School of Agriculture and Biology, Dongchuan Road 800, Shanghai 200240, P.R. China
phone: + 86 021 3420 6930, fax: + 86 021 3420 6930, e-mail: [email protected]
Erik J., van H., Gabriel Z. (1999): Changes in Bacterial and Eu -karyotic community structure after mass lysis of filamentous cyanobacteria associated with virus. Applied and Environmental Microbiology, 65: 795–801.
Jones D.L., David S., Daniel V. (2004): Role of dissolved organic nitrogen (DON) in soil N cycling in grassland soils. Soil Biol-ogy and Biochemistry, 36: 749–756.
Jones D.L., Healey J.R., Willett V.B. (2005): Dissolved organic nitrogen uptake by plants – an important N uptake pathway? Soil Biology and Biochemistry, 37: 413–423.
Kalbitz K., Solinger S., Park J.H. (2000): Controls on the dynam-ics of dissolved organic matter in soils: a review. Soil Science,
165: 277–304.
Luo H.F., Qi H.Y., Xue K. (2003): A preliminary application of PCR-DGGE to study microbial diversity in soil. Acta Ecologica Sinica, 23: 1570–1575.
Marcel G.A., John N.K. (1998): Mycorrhizal fungal diversity determines plant biodiversity, ecosystem variability and pro-ductivity. Nature, 396: 69–72.
McHale M.R., Mitchell M.J., McDonnell J.J. (2000): Nitrogen solutes in an Adiron dack forested watershed: importance of dissolved organic nitrogen. Biogeochemistry, 48: 165–184. Michalzik B.K., Kalbitz J.H., Park S.S. (2001): Fluxes and
concen-trations of dissolved organic carbon and nitrogen – a synthesis for temperate forests. Biogeochemistry, 52: 173–205. Murphy D.V., MacDonald A.J., Stockdale E.A. (2000): Soluble
organic nitrogen in agricultural soils. Biology and Fertility of Soils, 30: 374–387.
Muyzer G., De Waal E.C., Uitterlinden A.G. (1993): Profiling of complex microbial populations by denaturing gradient gel electrophoresis analysis of polymerase chain reaction-amplified genes coding for 16S rRNA. Applied and Environmental Mi-crobiology, 59: 695–700.
Nsholm T. (1998): Boreal forest plants take up organic nitrogen. Nature, 392: 914–916.
Perakis S.S., Hedin L.O. (2002): Nitrogen loss from unpolluted South American forests mainly via dissolved organic com-pounds. Nature, 392: 914–916.
Roberts P., Jones D. (2008): Critical evaluation of methods for determining total protein in soil solution. Soil Biology and Biochemistry, 40: 1485–1495.
Siemens J., Martin K. (2002): Contribution of dissolved organic nitrogen to N leaching from four German agricultural soils. Journal of Plant Nutrition and Soil Science, 165: 675–681. Simek M., Hopkins D.W., Kalaik J. (1999): Biological and chemiW
-cal properties of arable soils affected by long-term organic and inorganic fertilizer applications. Biology and Fertility of Soils, 29: 300–308.
Tiedje J.M., Cho J.C., Murray A. (2001): Soil teeming with life: new frontiers for soil science. In: Rees R.M., Ball B., Watson C., Campell C.D. (eds): Sustainable Management of Soil Organic Matter, 393–412.
Tipping E., Woof C., Rigg E. (1999): Climatic influences on the leaching of dissolved organic matter from upland UK moorland soils, investigated by a field manipulation experiment. Environ-ment International, 25: 83–95.
Wei Y.M., Zhu L.X., Qiao Y.J. (2003): The agricultural fertilization and its impact on the environment in the arid area. Journal of Arid Land Resources and Environment, 17: 65–69.
Westerhoff P., Mash H. (2002): Dissolved organic nitrogen in drinking water supplies: a review. Journal of Water Supply, Research and Technology-Aqua, 51: 415–448.
Xu Q. (2001): Evolution of soil fertility in relation to its quality in paddy field of the Taihu lake area. Resources and Environment in the Yangtze Basin, 10: 323–328.
Zhang C.E., Chen X.I. (1998): Influence of reclamation of forest land on nutrients and enzyme activities in soil. Chinese Journal of Ecology, 17: 18–21.
Zhao Q.G. (2002): Environmental quality and agricultural security of Jiangsu Province. Soils, 1: 1–8.
Zhou J.Z., Davey M.E., Figueras J.B. (1997): Phylogenetic diversity of a bacterial community determined from Siberian tundra soil DNA. Microbiology, 143: 3913–3919.