Increasingly often, the agricultural production space management involves measures aimed at the protection of soil organic matter (SOM). In the EU countries, this issue is regarded as a priority, which was expressed in the proposal for the Directive of the European Parliament and of the Council establishing a framework for the protection of soil. Decreasing content of SOM in soils and the risks associated with its mineralization, besides lowering the productivity of soils (Seremesic et al. 2017), have environmental significance, leading to high emissions of carbon diox-ide from soils (Jäger et al. 2011, Šimková et al. 2014). The formation of SOM is supported by fertiliza-tion, in particular with organic fertilizers originating from animal production. The effect of slurry depends on its chemical composition, dry matter content, the time of application and the dose. It is therefore necessary to monitor the effects of the use of slurry,
in particular where it has been applied for several years during the time of experiment on the same field. The SOM balance in soils fertilized with slurry is determined by the dose applied and, where it is balanced in terms of the amount of carbon intro-duced with the commonly used dose of manure, its humus-forming value may equal 90–97% in relation to manure (Sądej and Namiotko 2011).
In terms of the fertility of soils and the assessment of soil degradation, not only SOM but also the quality of the humic compounds being formed is important (Doni et al. 2014). As regards manure, an increase is observed in both the loosely and tightly bound fractions of the soil humus (Yan et al. 2007). The regular use of manure increases the content of the fraction of humic acids carbon (CHA), especially the fraction bound with calcium (CHA-Ca), fulvic acids carbon (CFA) and the humin fraction (Lapa et al.
Comparison of the effect of various long-term fertilization
systems on the content and fractional composition of humic
compounds in Lessive soil
Wiera Sądej, Andrzej Cezary Żołnowski*
Department of Environmental Chemistry, University of Warmia and Mazury, Olsztyn, Poland
*Corresponding author: [email protected]
Citation: Sądej W., Żołnowski A.C. (2019): Comparison of the effect of various long-term fertilization systems on the content and fractional composition of humic compounds in Lessive soil. Plant Soil Environ., 65: 172–180.
Abstract: A field experiment was established in 1972 on Luvisol. Three types of fertilizers – cattle manure (CM), cattle slurry (CS) and mineral fertilizers were used. CS was applied in the following doses: I – balanced with CM in terms of the amount of introduced total nitrogen and II – balanced with CM in terms of the amount of introduced total organic carbon (Ctot). 39 years after the experiment was established, half of each experimental plot was limed and since then the experiment was carried in two series – non-limed and limed soils. The paper presents the results of soil analyses 41 years after the experiment was started. It was found that each fertilization system increased the Ctot content in soil in relation to the unfertilized control plot. The increase of Ctot fluctuated between 0.35–6.22 g/kg of dry matter. In both series, the highest Ctot content was observed in the soil fertilized with CM and CM + PK. Limed compared to non-limed soil contained nearly 25% more carbon of humic acids than fulvic acids and nearly 20% lower content of low molecular humic bonds. Liming considerably widened the humic acids carbon:fulvic acids carbon (CHA:CFA) ratio of the fertilized soils, up to 1.32–1.87, while the corresponding objects of the non-limed series showed the CHA:CFA ratio between 0.75–0.97.
Keywords: organic fertilizers; mineralization; absorbance; decomposition; macronutrient; soil organic matter
Supported by the University of Warmia and Mazury in Olsztyn, Project No. 528.1004.0805.
2011). It also widens the CHA:CFA ratio, increases the aliphatisation of CHA in the soil, raises their susceptibility to oxidation, and reduces the average molecular weight as compared with the properties of CHA in soils not fertilized with manure. CHA in soils fertilized only with mineral fertilizers, as compared with CHA in soils fertilized with manure, are char-acterized by a greater share of aromatic structures, lower susceptibility to oxidation and higher absorb-ance values at a wavelength of 465 nm.
Researcher’s opinions about the effects of slurry on the quality of humic compounds are not unam-biguous. According to Lithourgidis et al. (2007), the use of slurry leads to the formation of labile humus fractions, which is associated with a high rate of decomposition of this fertilizer in the soil, while Dębska (2004) and Sądej and Namiotko (2011) claim that slurry fertilization resulted in an increase in the content of CHA and humins. Moreover, SOM in soils fertilized with slurry, as compared to soils unfertilized and fertilized with NPK, is characterized by a higher CHA:CFA ratio.
The aim of this study was to determine the effect of long-term fertilization with organic and mineral fertilizers and combined organic and mineral ferti-lization on the quantitative and qualitative changes of soil organic matter.
MATERIAL AND METHODS
Site and experimental set-up. The field
experi-ment was established in 1972 at the Agricultural Experimental Station in Bałcyny (Poland), owned by the University of Warmia and Mazury in Olsztyn. According to the World Reference Base for Soil Resources (IUSS Working Group WRB 2014), in-vestigated soil belonged to the Luvisols type, sub-type Albic Luvisols. A randomized block design
was applied in six replications, and an area of each experimental plot was 40 m2.
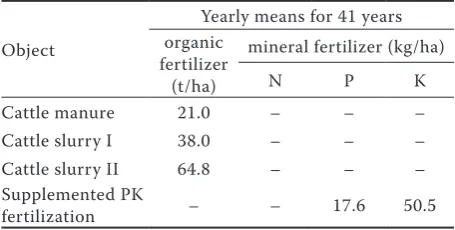
Three fertilization systems were compared: or-ganic – cattle manure (CM) and cattle slurry (CS), mineral (NPK) and combined organic (CM and CS) + mineral (PK). In each year, CS was applied in two doses: I – equivalent to CM in terms of the amount of total nitrogen introduced into the soil, and II – equivalent to CM in terms of the amount of organic carbon introduced into the soil. The supplementary mineral fertilization with phosphorus (P) and potas-sium (K) on the plots fertilized with CS and CM was applied in an amount equivalent to ½ of the dose of these components introduced on the plot fertilized exclusively with NPK. The chemical composition of organic fertilizers is presented in Table 1. Average annual doses of CS and CM are collated in Table 2.
The fertilizers were applied in the spring, prior to sowing spring cereals or planting root crops, and in the autumn, prior to sowing oilseed rape and winter cereals. In 2010, ½ of the area of the plots was limed using carbonate lime in a dose 3.5 t CaO/ha. Since then, the experiment was carried out in two series: non-limed soil (NLS) and limed soil (LS).
In the years 1972–1987, the crop rotation consisted of the following plants species: potato, spring barley + undersown red clover with grasses, red clover with grasses, winter oilseed rape, winter wheat, winter rye as a catch crop, maize, spring barley and winter wheat. In 1988, red clover with grasses was removed from the crop rotation system and since that time a 7-year cycle of rotation was used.
Soil sampling and chemical analyses. Primary soil
[image:2.595.304.532.642.757.2]samples were taken from the layer 0–25 cm of soil after the plants harvest. The extraction of humic com-pounds was performed by the Kononova-Belchikowa method (Kononova 1966), using the following solu-tions: H2SO4 at a concentration of 0.05 mol/dm3
Table 1. Chemical composition of organic fertilizers (% fresh matter)
Component Cattle manure Cattle slurry
Dry matter 23.06 8.22
Total organic carbon 8.53 3.12
Total organic nitrogen 0.49 0.31
P 0.17 0.12
K 0.43 0.32
Mg 0.09 0.05
[image:2.595.64.290.642.756.2]Ca 0.14 0.10
Table 2. Fertilizers rates applied in the experiments per year
Object
Yearly means for 41 years organic
fertilizer (t/ha)
mineral fertilizer (kg/ha)
N P K
Cattle manure 21.0 – – –
Cattle slurry I 38.0 – – –
Cattle slurry II 64.8 – – –
Supplemented PK
(fraction Ia); a mixture of 0.1 mol/dm3 sodium
pyrophosphate – Na4P2O7 + 0.1 mol/dm3 NaOH
(1:1 v/v) (fraction I), and NaOH at a concentration of 0.1 mol/dm3 (fraction II). The extraction of
hu-mic acids (HA) in fraction I was performed using a 0.1 mol/dm3 NaOH solution, after the samples had been
decalcified twice with 0.2 mol/dm3 HCl (Schnitzer and
Skinner 1968). The content of CFA in fraction I was calculated from the difference between the amount of C extracted using the mixture of Na4P2O7 + NaOH, and the amount of CHA. The content of CHA bound with calcium (CHA-Ca) was calculated from the difference be-tween the amount of CHA separated using a mixture of 0.1 mol/dm3 Na
4P2O7 + 0.1 mol/dm3 NaOH, including
the ones that were free, calcium-bound and bound to non-silicate R2O3 forms, and the amount of CHA sepa-rated through the multiple treatment of the soil with 0.1 mol/dm3 NaOH. The content of C referred to as
post-extraction residue, non-hydrolyzing C (Cnh), was calculated from the difference between the content of Ctot in the soil and the amount thereof extracted using a mixture of Na4P2O7 + NaOH (fraction I). Total organic carbon (Ctot) and the content of C in particular fractions of humic compounds was de-termined using an oxidation-reduction method in a mixture of 0.066 mol/dm3 K
2Cr2O7 and 9.0 mol/dm3
H2SO4.
The properties of HA were also assessed based on their optical density. To this end, solutions of HA in a concentration of 0.02% in 0.1 mol/dm3 NaOH were
prepared, in which the measurement of absorbance was performed using a flow injection spectrophotom-eter in a 1 cm path length quartz cuvette. Absorbance was measured using visible light waves with lengths λ = 464 nm (A4), and λ = 664 nm (A6). Based on the determined absorbance values, coefficients A4/6 were calculated (Chen et al. 1977).
The content of total nitrogen (Ntot) was determined with the Kjeldahl method. A distillation unit Büchi K-355 was employed for the distillation of nitrogen.
Statistical analysis. The results underwent
statisti-cal processing according to the two-way analysis of variance at the level of significance P ≤ 0.05, using the statistical calculation software of Statistica v. 10.0 (StatSoft, Tulsa, USA). The lowest significant differences (LSD) between the analyzed values were determined with the two-dimensional Duncan’s test. Power of the correlation between soil chemical properties, expressed by the Pearson’s correlation coefficient (R2) was calculated in MS Excel 2010
(MicroSoft, Redmond, USA).
RESULTS AND DISCUSSION
The content of Ctot, Ntot and C:N ratio. In both
series of the experiment, NLS and LS, the highest Ctot value was noted in the soil fertilized with CM along with mineral fertilization (PK) (Figure 1). This positive effect of the combined mineral and organic fertilization on the Ctot content is confirmed by Fließbach et al. (2007) and Moharana et al. (2012). Although the same amounts of Ctot were introduced in CM and CS II, the fertilization with CM of the soil in the NLS series resulted in an increase in the content of Ctot by over 15%, and for LS by as much as 34% compared with the soil fertilized with CS II. The results prove that the use of higher doses of CS is not justified as it does not result in a significant increase in the content of Ctot compared with lower doses of this fertilizer, calculated on the basis of the amount of Ntot introduced to the soil. Similar con-clusions are also drawn by Lithourgidis et al. (2007) and Dębska (2004).
After 41 years of the application of NPK, the content of Ctot in the NLS was similar to its content in the soil of the control plot (CP) and the plot fertilized with CS I. This seems to confirm the opinion, often found in the literature, that mineral fertilization has a weak effect on the content of humus in soil (Banger et al. 2009).
In the objects fertilized with slurry and NPK, liming tended to reduce the content of Ctot, while in soil of the CM fertilized object, liming increased the Ctot content compared to NLS.
Another consequence of the fertilization is an increase of the soil richness in nitrogen, which, as compared with the non-fertilized soils, may range from almost 5% to over 50% (Černý et al. 2008, Sądej and Przekwas 2008, Banger et al. 2009, Sądej et al. 2016). Statistical analysis showed no significant dif-ferences between the content of Ntot in the arable layer of the soil fertilized with CS applied in both doses and the content of Ntot in the soil fertilized with NPK.
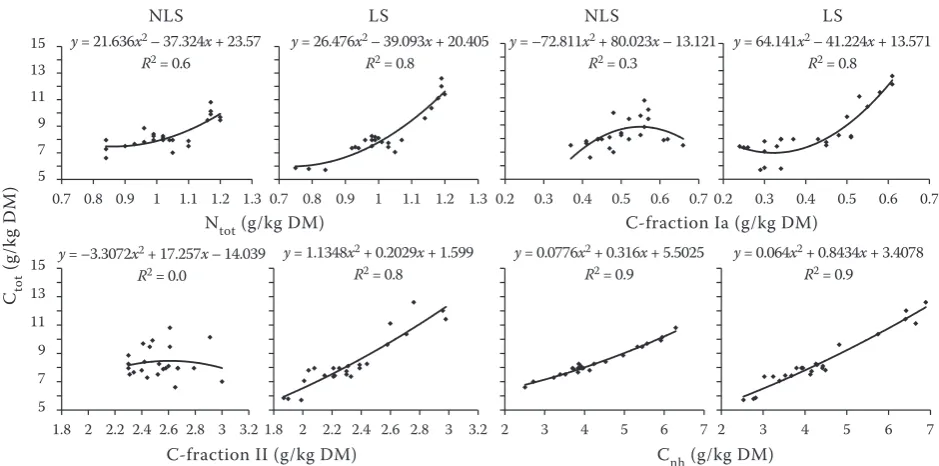
The liming treatment only slightly modified the contents of Ctot and Ntot in the soil (Figure 1). No effects of the combined action of liming and ferti-lization on the content of these components in the soil were shown, either, which confirms the empiri-cal results obtained by Szymańska et al. (2008). On the other hand, a significant relationship between Ctot:Ntot ratio was found in the present study (Figure 2, Table 3).
Fractional composition of humic substances in
the soil. The studies of Diacono and Montemurro (2010) showed that the effect of mineral and organic fertilizers on the composition of formed humic
[image:4.595.94.504.94.370.2]sub-Figure 1. Effect of different fertilization systems on total organic carbon (Ctot), total organic nitrogen (Ntot) con-tent and Ctot:Ntot ratio in soil. Different letters above the bars denote significant differences between fertilization systems at P = 0.05 level. I – control plot (CP); II – CS I (cattle slurry); III – CS I + PK; IV – CS II; V – CS II + PK; VI – CM (cattle manure); VII – CM + PK; VIII – NPK; NLS – non-limed soil; LS – limed soil; DM – dry matter
Figure 2. Relationships between total organic carbon (Ctot) content and total organic nitrogen (Ntot), C-fraction Ia,
C-fraction II, and non-hydrolyzing carbon (Cnh) fractions extracted from soil. NLS – non-limed soil; LS – limed soil; DM – dry matter
b b b b b
c c b
0 5 10
I II III IV V VI VII VIII
a b
b b b
c d
b
0 5 10
I II III IV V VI VII VIII
b b
0 5 10
NLS LS
b cd efg cde g h h fg
0 0.4 0.8 1.2 1.6 2
I II III IV V VI VII VIII
a efg de efg def h h c 0 0.4 0.8 1.2 1.6 2
I II III IV V VI VII VIII
e f g d e f 0 0.4 0.8 1.2 1.6 2 NLS LS
cd abcd abcd bcd abc abcd cd ab
0 5 10
I II III IV V VI VII VIII
ab a abcd abc abcd d e
abcd
0 5 10
I II III IV V VI VII VIII 0 5 10
NLS LS b b b b b
c c b
0 5 10
I II III IV V VI VII VIII
a b
b b b
c d
b
0 5 10
I II III IV V VI VII VIII
b b
0 5 10
NLS LS
b cd efg cde g
h h fg
0 0.4 0.8 1.2 1.6 2
I II III IV V VI VII VIII
a efg de efg def h h c 0 0.4 0.8 1.2 1.6 2
I II III IV V VI VII VIII
e f g d e f 0 0.4 0.8 1.2 1.6 2 NLS LS
cd abcd abcd bcd abc abcd cd ab
0 5 10
I II III IV V VI VII VIII
ab a abcd abc abcd d e
abcd
0 5 10
I II III IV V VI VII VIII 0 5 10
NLS LS b b b b b b
0 5 10
I II III IV V VI VII VIII
a b
b b b b
0 5 10
I II III IV V VI VII VIII
b b
0 5 10
NLS LS
b cd efg cde g
h h fg
0 0.4 0.8 1.2 1.6 2
I II III IV V VI VII VIII
a efg de efg def h h c 0 0.4 0.8 1.2 1.6 2
I II III IV V VI VII VIII
e f g d e f 0 0.4 0.8 1.2 1.6 2 NLS LS
cd abcd abcd bcd abc abcd cd ab
0 5 10
I II III IV V VI VII VIII
ab a abcd abc abcd d e
abcd
0 5 10
I II III IV V VI VII VIII 0 5 10 NLS LS NLS LS Cto t (g /k g D M ) Nto t (g /k g D M ) Cto t :Nto t (g /k g D M ) a b c d a b c d 5 7 9 11 13 15
0.7 0.8 0.9 1 1.1 1.2 1.3 5 6 7 8 9 10 11 12 13 14 15
0.7 0.8 0.9 1 1.1 1.2 1.3 5 6 7 8 9 10 11 12 13 14 15
0.2 0.3 0.4 0.5 0.6 0.7 5 6 7 8 9 10 11 12 13 14 15
0.2 0.3 0.4 0.5 0.6 0.7
5 7 9 11 13 15
1.8 2 2.2 2.4 2.6 2.8 3 3.2 5 6 7 8 9 10 11 12 13 14 15
1.8 2 2.2 2.4 2.6 2.8 3 3.2 5 6 7 8 9 10 11 12 13 14 15
2 3 4 5 6 7
5 6 7 8 9 10 11 12 13 14 15
2 3 4 5 6 7
5 7 9 11 13 15
0.7 0.8 0.9 1 1.1 1.2 1.3 5 6 7 8 9 10 11 12 13 14 15
0.7 0.8 0.9 1 1.1 1.2 1.3 5 6 7 8 9 10 11 12 13 14 15
0.2 0.3 0.4 0.5 0.6 0.7 5 6 7 8 9 10 11 12 13 14 15
0.2 0.3 0.4 0.5 0.6 0.7
5 7 9 11 13 15
1.8 2 2.2 2.4 2.6 2.8 3 3.2 5 6 7 8 9 10 11 12 13 14 15
1.8 2 2.2 2.4 2.6 2.8 3 3.2 5 6 7 8 9 10 11 12 13 14 15
2 3 4 5 6 7
5 6 7 8 9 10 11 12 13 14 15
2 3 4 5 6 7
Cto t (g /k g D M )
Ntot (g/kg DM) C-fraction Ia (g/kg DM)
Cnh (g/kg DM) C-fraction II (g/kg DM)
y = 21.636x2 – 37.324x + 23.57
R2 = 0.6 y = 26.476x
2 – 39.093x + 20.405
R2 = 0.8 y = –72.811x
2 + 80.023x – 13.121
R2 = 0.3 y = 64.141x
2 – 41.224x + 13.571
R2 = 0.8
y = –3.3072x2 + 17.257x – 14.039
R2 = 0.0
y = 1.1348x2 + 0.2029x + 1.599
R2 = 0.8 y = 0.0776x
2 + 0.316x + 5.5025
R2 = 0.9 y = 0.064x
2 + 0.8434x + 3.4078
R2 = 0.9
[image:4.595.63.533.481.714.2]stances is different. Long-term mineral fertilization led to an increase in the content of humic compounds in the most mobile bounds at the expense of the frac-tion more tightly bound with the mineral part of soil (Schulz et al. 2002). In addition, exclusive mineral fertilization led to a decrease in the content of CHA, in particular their labile fractions, the consequence of which is the deteriorated quality of humus of soil aggregates. In this scope, organic fertilizers act differently, as they can serve as substrate for renew-ing humic compounds. Most often, these fertilizers have a positive effect on the quality of SOM, among others through a significant increase in the share of CHA in the fractional composition of organic matter (Watanabe et al. 2007, Yanardağ et al. 2015). Such dependencies are also confirmed by the results of
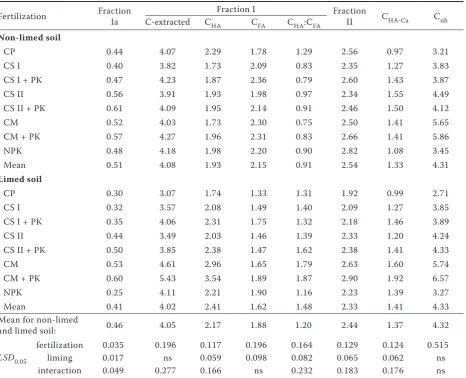
our study, in which CM compared to other types of fertilizers significantly contributed to the increase in CHA (Table 4).
In the NLS series, most low-molecular humic bonds (fraction Ia) were noted in the soil from CS II and CM objects.
[image:5.595.65.530.125.491.2]The main components of humus that determine its properties in the soil are humic acids, whose char-acteristics are modified by the type of fertilization applied (Watanabe et al. 2007, Kawasaki et al. 2015). In the present study, the fertilization in the NLS series had no effect on the content of free humic compounds bound with the non-silicate forms of iron and aluminum, and bound with calcium (fraction I). In the humic bonds of this fraction, the fulvic acids (FA) content was higher than the HA content, which
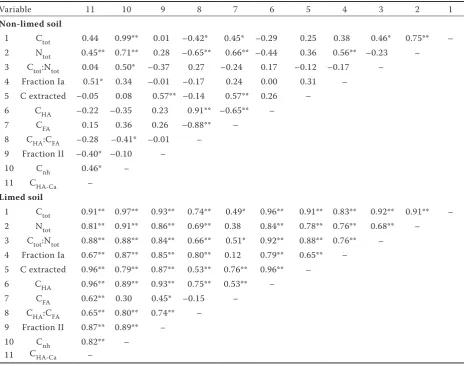
Table 3. Pearson’s simple correlation coefficients between soil chemical properties after 41 years of differenti-ated fertilization systems and soil liming
Variable 11 10 9 8 7 6 5 4 3 2 1
Non-limed soil
1 Ctot 0.44 0.99** 0.01 –0.42* 0.45* –0.29 0.25 0.38 0.46* 0.75** –
2 Ntot 0.45** 0.71** 0.28 –0.65** 0.66** –0.44 0.36 0.56** –0.23 –
3 Ctot:Ntot 0.04 0.50* –0.37 0.27 –0.24 0.17 –0.12 –0.17 –
4 Fraction Ia 0.51* 0.34 –0.01 –0.17 0.24 0.00 0.31 –
5 C extracted –0.05 0.08 0.57** –0.14 0.57** 0.26 –
6 CHA –0.22 –0.35 0.23 0.91** –0.65** –
7 CFA 0.15 0.36 0.26 –0.88** –
8 CHA:CFA –0.28 –0.41* –0.01 – 9 Fraction II –0.40* –0.10 –
10 Cnh 0.46* –
11 CHA-Ca –
Limed soil
1 Ctot 0.91** 0.97** 0.93** 0.74** 0.49* 0.96** 0.91** 0.83** 0.92** 0.91** – 2 Ntot 0.81** 0.91** 0.86** 0.69** 0.38 0.84** 0.78** 0.76** 0.68** – 3 Ctot:Ntot 0.88** 0.88** 0.84** 0.66** 0.51* 0.92** 0.88** 0.76** –
4 Fraction Ia 0.67** 0.87** 0.85** 0.80** 0.12 0.79** 0.65** – 5 C extracted 0.96** 0.79** 0.87** 0.53** 0.76** 0.96** –
6 CHA 0.96** 0.89** 0.93** 0.75** 0.53** –
7 CFA 0.62** 0.30 0.45* –0.15 –
8 CHA:CFA 0.65** 0.80** 0.74** – 9 Fraction II 0.87** 0.89** –
10 Cnh 0.82** –
11 CHA-Ca –
*correlation coefficient r significant for α = 0.05; **correlation coefficient r significant for α = 0.01 (n = 24). Ctot – total organic carbon; Ntot – total organic nitrogen; CHA – humic acids carbon; CFA – fulvic acids carbon; Cnh – non-hydrolyzing carbon;CHA-Ca – carbon of humic acids bounded with calcium
was observed in all fertilization plots. The average content of FA was the highest in the soil fertilized with CM, which indicates that the long-term fertili-zation with CM only without liming, does not have a positive effect on the humification process. The reason for the accumulation of FA may be incomplete humification of SOM, leading to the formation of polyphenols, quinones, etc., which may polymerize to form FA. The application of CS and CM resulted in reduction in the content of carbon in the humic bonds of fraction II as compared with the CP soil and the soil fertilized with NPK. The content of Cnh and the share of this fraction in Ctot was the high-est in the soil fertilized with CM and CM + PK. Cnh was also significantly positively correlated with the content of Ctot (Figure 2).
[image:6.595.66.533.112.490.2]In the LS series, changes in the structure of the fraction of humic compounds were more pronounced than in the NLS series (Table 4). The average content of carbon of fraction Ia and fraction I were lower than in NLS. The lowest content of fraction Ia was noted in the soil fertilized with NPK. A higher relationship between the average content of fraction Ia and Ctot was demonstrated for the LS than for NLS (Figure 2). In the LS series within fraction I bonds, CHA domi-nated over CFA and the highest content the former was found in the plots fertilized with CM. The content of CHA in LS was significantly positively correlated with the content of Ntot, Ctot and the content of carbon of fraction I bonds (Table 3). As a consequence of the above changes, the CHA:CFA ratio in LS increased as compared with NLS, with the widest ratio noted in the
Table 4. Effect of different fertilization systems on fractional composition of humus compounds (g/kg dry matter)
Fertilization Fraction Ia C-extracted C Fraction I Fraction II CHA-Ca Cnh HA CFA CHA:CFA
Non-limed soil
CP 0.44 4.07 2.29 1.78 1.29 2.56 0.97 3.21
CS I 0.40 3.82 1.73 2.09 0.83 2.35 1.27 3.83
CS I + PK 0.47 4.23 1.87 2.36 0.79 2.60 1.43 3.87
CS II 0.56 3.91 1.93 1.98 0.97 2.34 1.55 4.49
CS II + PK 0.61 4.09 1.95 2.14 0.91 2.46 1.50 4.12
CM 0.52 4.03 1.73 2.30 0.75 2.50 1.41 5.65
CM + PK 0.57 4.27 1.96 2.31 0.83 2.66 1.41 5.86
NPK 0.48 4.18 1.98 2.20 0.90 2.82 1.08 3.45
Mean 0.51 4.08 1.93 2.15 0.91 2.54 1.33 4.31
Limed soil
CP 0.30 3.07 1.74 1.33 1.31 1.92 0.99 2.71
CS I 0.32 3.57 2.08 1.49 1.40 2.09 1.27 3.85
CS I + PK 0.35 4.06 2.31 1.75 1.32 2.18 1.46 3.89
CS II 0.44 3.49 2.03 1.46 1.39 2.33 1.20 4.24
CS II + PK 0.50 3.85 2.38 1.47 1.62 2.38 1.41 4.33
CM 0.53 4.61 2.96 1.65 1.79 2.63 1.60 5.74
CM + PK 0.60 5.43 3.54 1.89 1.87 2.90 1.92 6.57
NPK 0.25 4.11 2.21 1.90 1.16 2.23 1.39 3.27
Mean 0.41 4.02 2.41 1.62 1.48 2.33 1.41 4.33
Mean for non-limed
and limed soil: 0.46 4.05 2.17 1.88 1.20 2.44 1.37 4.32
LSD0.05
fertilization 0.035 0.196 0.117 0.196 0.164 0.129 0.124 0.515
liming 0.017 ns 0.059 0.098 0.082 0.065 0.062 ns
interaction 0.049 0.277 0.166 ns 0.232 0.183 0.176 ns
plots where CM was applied (Table 4). The obtained results indicate that humus of the limed soil fertilized with CM was characterized by a higher value of the CHA:CFA ratio, and the CHA achieved higher values of the absorbance coefficients than in the soil ferti-lized with CS and NPK. The results confirm the data provided in the literature (Szymańska et al. 2008).
The content of the CHA-Ca fraction in LS was differ-ent from that in NLS. In LS, the application of CM, CS I as well as CM + PK and CS I + PK contributed to an increase in the content of CHA-Ca, as compared with NLS (Table 4). This relationship was reverse in the soil treated with CS II, where the content of CHA-Ca was smaller by an average of 16% than in NLS.
Studies by other authors (Yanardağ et al. 2015) indi-cate that the application of both organic fertilizers (FYM and SL) brings about similar effects in relation to the content of both Ctot and CHA and CFA in soil. Liming increased the significance of correlations between most of the analyzed carbon fractions and the content of Ctot, which was not found for NLS (Tables 3 and 4).
[image:7.595.61.532.88.336.2]One of the properties characterizing the internal structure of HA is optical density, which depends on the ratio of C contained in the aromatic nucleus to the C in side radicals (Kononova 1966, Chen et al. 1977). The value of A4/6 in soil from particular ex-perimental plots ranged from 4.08 to 6.20 (Figure 4).
[image:7.595.100.470.601.702.2]Figure 4. Values of absorbance A4/6 ratios for humic acids (HA) solutions calculated on the basis of their optical properties. Different letters above the bars denote significant differences between fertilization systems at P = 0.05 level. I – control plot (CP); II – CS I (cattle slurry); III – CS I + PK; IV – CS II; V – CS II + PK; VI – CM (cattle manure); VII – CM + PK; VIII – NPK; NLS – non-limed soil; LS – limed soil
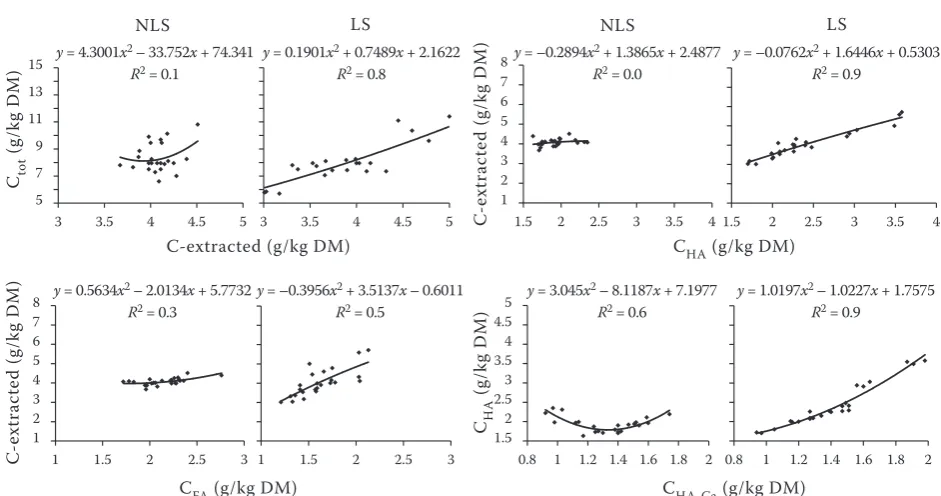
Figure 3. Relationships between total organic carbon (Ctot) content and C-extracted, C-extracted and humic acids carbon (CHA), C-extracted and fulvic acids carbon (CFA), CHA and carbon of humic acids bounded with calcium (CHA-Ca) fractions extracted from soil. NLS – non-limed soil; LS – limed soil; DM – dry matter
5 7 9 11 13 15
3 3.5 4 4.5 5
5 7 9 11 13 15
3 3.5 4 4.5 5
1 2 3 4 5 6 7 8
1.5 2 2.5 3 3.5 4
1 2 3 4 5 6 7 8
1.5 2 2.5 3 3.5 4
1 2 3 4 5 6 7 8
1 1.5 2 2.5 3
1 2 3 4 5 6 7 8
1 1.5 2 2.5 3
1.52 2.53 3.54 4.55
0.8 1 1.2 1.4 1.6 1.8 2 1.52 2.53 3.54 4.55
0.8 1 1.2 1.4 1.6 1.8 2 5 7 9 11 13 15
3 3.5 4 4.5 5
5 7 9 11 13 15
3 3.5 4 4.5 5
1 2 3 4 5 6 7 8
1.5 2 2.5 3 3.5 4
1 2 3 4 5 6 7 8
1.5 2 2.5 3 3.5 4
1 2 3 4 5 6 7 8
1 1.5 2 2.5 3
1 2 3 4 5 6 7 8
1 1.5 2 2.5 3
1.52 2.53 3.54 4.55
0.8 1 1.2 1.4 1.6 1.8 2 1.52 2.53 3.54 4.55
0.8 1 1.2 1.4 1.6 1.8 2 5 7 9 11 13 15
3 3.5 4 4.5 5
5 7 9 11 13 15
3 3.5 4 4.5 5
1 2 3 4 5 6 7 8
1.5 2 2.5 3 3.5 4
1 2 3 4 5 6 7 8
1.5 2 2.5 3 3.5 4
1 2 3 4 5 6 7 8
1 1.5 2 2.5 3
1 2 3 4 5 6 7 8
1 1.5 2 2.5 3
1.52 2.53 3.54 4.55
0.8 1 1.2 1.4 1.6 1.8 2 1.52 2.53 3.54 4.55
0.8 1 1.2 1.4 1.6 1.8 2 5 7 9 11 13 15
3 3.5 4 4.5 5
5 7 9 11 13 15
3 3.5 4 4.5 5
1 2 3 4 5 6 7 8
1.5 2 2.5 3 3.5 4
1 2 3 4 5 6 7 8
1.5 2 2.5 3 3.5 4
1 2 3 4 5 6 7 8
1 1.5 2 2.5 3
1 2 3 4 5 6 7 8
1 1.5 2 2.5 3
1.52 2.53 3.54 4.55
0.8 1 1.2 1.4 1.6 1.8 2 1.52 2.53 3.54 4.55
0.8 1 1.2 1.4 1.6 1.8 2 5 7 9 11 13 15
3 3.5 4 4.5 5
5 7 9 11 13 15
3 3.5 4 4.5 5
1 2 3 4 5 6 7 8
1.5 2 2.5 3 3.5 4
1 2 3 4 5 6 7 8
1.5 2 2.5 3 3.5 4
1 2 3 4 5 6 7 8
1 1.5 2 2.5 3
1 2 3 4 5 6 7 8
1 1.5 2 2.5 3
1.52 2.53 3.54 4.55
0.8 1 1.2 1.4 1.6 1.8 2 1.52 2.53 3.54 4.55
0.8 1 1.2 1.4 1.6 1.8 2 5 7 9 11 13 15
3 3.5 4 4.5 5
5 7 9 11 13 15
3 3.5 4 4.5 5
1 2 3 4 5 6 7 8
1.5 2 2.5 3 3.5 4
1 2 3 4 5 6 7 8
1.5 2 2.5 3 3.5 4
1 2 3 4 5 6 7 8
1 1.5 2 2.5 3
1 2 3 4 5 6 7 8
1 1.5 2 2.5 3
1.52 2.53 3.54 4.55
0.8 1 1.2 1.4 1.6 1.8 2 1.52 2.53 3.54 4.55
0.8 1 1.2 1.4 1.6 1.8 2 5 7 9 11 13 15
3 3.5 4 4.5 5
5 7 9 11 13 15
3 3.5 4 4.5 5
1 2 3 4 5 6 7 8
1.5 2 2.5 3 3.5 4
1 2 3 4 5 6 7 8
1.5 2 2.5 3 3.5 4
1 2 3 4 5 6 7 8
1 1.5 2 2.5 3
1 2 3 4 5 6 7 8
1 1.5 2 2.5 3
1.52 2.53 3.54 4.55
0.8 1 1.2 1.4 1.6 1.8 2 1.52 2.53 3.54 4.55
0.8 1 1.2 1.4 1.6 1.8 2 5 7 9 11 13 15
3 3.5 4 4.5 5
5 7 9 11 13 15
3 3.5 4 4.5 5
1 2 3 4 5 6 7 8
1.5 2 2.5 3 3.5 4
1 2 3 4 5 6 7 8
1.5 2 2.5 3 3.5 4
1 2 3 4 5 6 7 8
1 1.5 2 2.5 3
1 2 3 4 5 6 7 8
1 1.5 2 2.5 3
1.52 2.53 3.54 4.55
0.8 1 1.2 1.4 1.6 1.8 2 1.52 2.53 3.54 4.55
0.8 1 1.2 1.4 1.6 1.8 2
Cto t (g /k g D M
) y = 4.3001x
2 – 33.752x + 74.341
R2 = 0.1 y = 0.1901x
2 + 0.7489x + 2.1622
R2 = 0.8 y = –0.2894x
2 + 1.3865x + 2.4877
R2 = 0.0 y = –0.0762x
2 + 1.6446x + 0.5303
R2 = 0.9
y = 0.5634x2 – 2.0134x + 5.7732
R2 = 0.3 y = –0.3956x
2 + 3.5137x – 0.6011
R2 = 0.5 y = 3.045x
2 – 8.1187x + 7.1977
R2 = 0.6 y = 1.0197x
2 – 1.0227x + 1.7575
R2 = 0.9
NLS LS NLS LS
C-extracted (g/kg DM) CHA (g/kg DM)
CFA (g/kg DM) CHA-Ca (g/kg DM)
C -e xt ra ct ed (g /k g D M) C -e xt ra ct ed (g /k g D M) CH A (g /k g D M )
d a a c c b b e
0 10
I II III IV V VI VII VIII
d a a c c b b e
0 10
I II III IV V VI VII VIII
b a
Higher values of the absorbance quotient were found in NLS than in LS, which indicates more intensive humification of organic matter and greater losses of SOM from the NLS plots. The qualitative parameters of humic substances were also subject to changes as a result of the application of various fertilization systems. It is assumed that humic acids, being chemi-cally ‘younger’, are characterized by lower optical density than ‘mature’ acids, which results from the stronger condensation of the aromatic nucleus in ‘mature’ HA, and the predominance of side chains in younger acids. In both series of the experiment, the value of the A4/6 ratio increased following the application of CS II fertilization, which is confirmed by the increase in the molecular weight of the humic substances formed in this variant. HA isolated from the soil material sampled from the plots fertilized with CM and CS I were characterized by lower val-ues of A4/6.
Long-term fertilization systems contributed signifi-cantly to the increase in the content of total organic carbon and total nitrogen in the soil. Following the fertilization with cattle slurry and mineral fertiliz-ers, the increase in the content of these components was smaller than after the fertilization with cattle manure. In both series (NLS and LS), the content of the C mobile fractions and their share in Ctot were higher after fertilization with CS II and CM than CS I and NPK. Liming of the soil resulted in an increase in the CHA:CFA ratio as compared with the non-limed soil, and contributed to the decrease in the share of low-molecular humic bonds in the soil. Humus of the limed soil fertilized with CM was characterized by a higher value of the CHA:CFA ratio, and the CHA achieved higher values of the absorbance coefficients than in the soil fertilized with CS and NPK. In the non-limed soil, within the fertilized plots, CFA dominated over CHA. A higher percentage of CHA in the content of Ctot was found in the soil fertilized with CS and NPK than in the soil fertilized with CM. The largest share in the identified fractions of humus consisted of humins. A larger amount of this fraction of humus was found in the soil fertilized with organic fertilizers than in the soil fertilized with mineral fertilizers.
Acknowledgements
We thank the originator of the experiment Professor Teofil Mazur, PhD. for his valuable comments during the preparation of this work.
REFERENCES
Banger K., Kukal S.S., Toor G.S., Sudhir K., Hanumanthraju T.H. (2009): Impact of long-term additions of chemical fertilizers and farm yard manure on carbon and nitrogen sequestration under rice-cowpea cropping system in semi-arid tropics. Plant and Soil, 318: 27–35.
Černý J., Balík J., Kulhánek M., Nedvěd V. (2008): The changes in microbial biomass C and N in long-term field experiments. Plant, Soil and Environment, 54: 212–218.
Chen Y., Senesi N., Schnitzer M. (1977): Information provided on humic substances by E4/6 ratios. Soil Science Society of America Journal, 41: 352–358.
Dębska B. (2004): Properties of humic substances of soil fertilized with slurry. [PhD thesis] Bydgoszcz, Technical and Agricultural Academy. (In Polish)
Diacono M., Montemurro F. (2010): Long-term effects of organic amendments on soil fertility. A review. Agronomy for Sustain-able Development, 30: 401–422.
Doni S., Macci C., Peruzzi E., Ceccanti B., Masciandaro G. (2014): Fac-tors controlling carbon metabolism and humification in different soil agroecosystems. The Scientific World Journal, 2014: 416074. Fließbach A., Oberholzer H.-R., Gunst L., Mäder P. (2007): Soil
or-ganic matter and biological soil quality indicators after 21 years of organic and conventional farming. Agriculture, Ecosystems and Environment, 118: 273–284.
IUSS, Working Group WRB (2014): World Reference Base for Soil Resources. International Soil Classification System for Naming Soils and Creating Legends for Soil Maps. World Soil Resources Reports No. 106. Rome, FAO. Available at: www.fao.org/3/a-i3794e.pdf
Jäger N., Stange C.F., Ludwig B., Flessa H. (2011): Emission rates of N2O and CO2 from soils with different organic matter content from three long-term fertilization experiments – A laboratory study. Biology and Fertility of Soils, 47: 483–494.
Kawasaki S., Ikeya K., Sugiura Y., Watanabe A. (2015): Changes in the composition of humic acids in various upland field soils with a continuous application of an organic amendment as revealed by fractional precipitation analysis. Soil Science and Plant Nutri-tion, 61: 450–460.
Kononova M.M. (1966): Soil Organic Matter. Oxford, Pergamon Press.
Lapa V.V., Seraya T.M., Bogatyreva E.N., Biryukova O.M. (2011): The effect of long term fertilizer application on the group and fractional composition of humus in a soddy-podzolic light loamy soil. Eurasian Soil Science, 44: 100–104.
Lithourgidis A.S., Matsi T., Barbayiannis N., Dordas C.A. (2007): Effect of liquid cattle manure on corn yield, composition, and soil properties. Agronomy Journal, 99: 1041–1047.
and soil organic carbon pools under a 6-year-old pearl millet-wheat cropping system in an Inceptisol of subtropical India. Field Crops Research, 136: 32–41.
Sądej W., Namiotko A. (2011): Changes in the fractional composi-tion of organic matter in soil caused by long-term organic, min-eral and mixed organic and minmin-eral fertilization. Polish Journal of Soil Science, 44: 105–116.
Sądej W., Przekwas K. (2008): Fluctuations of nitrogen levels in soil profile under conditions of a long-term fertilization experiment. Plant, Soil and Environment, 54: 97–203.
Sądej W., Żołnowski A.C., Marczuk O. (2016): Content of phenolic compounds in soils originating from two long-term fertilization experiments. Archives of Environmental Protection, 42: 104–113. Schnitzer M., Skinner S.I.M. (1968): Alkali versus acid extraction of
soil organic matter. Soil Science, 105: 392–396.
Schulz E., Travnikova L.S., Titova N.A., Kogut B.M., Körschens M. (2002): Influence of soil type and fertilization on accumulation and stabilization of organic carbon in different SOM fractions. In: Yuren J. (ed.): Proceedings of 12th ISCO Conference, 3.
Tech-nology and Method of Soil and Water Conservation: 304–308. Available at: http://tucson.ars.ag.gov/isco/isco12/VolumeIII/In-fluenceofSoilType.pdf
Seremesic S., Ćirić V., Milošev D., Vasin J., Djalovic I. (2017): Changes in soil carbon stock under the wheat-based cropping
systems at Vojvodina province of Serbia. Archives of Agronomy and Soil Science, 63: 388–402.
Šimková I., Kuklová M., Kukla J. (2014): Accumulation of Ct and Nt in humus and mineral soil layers: The effect of change of tree species composition in nudal beech forests. Folia Oecologica, 41: 82–91. Szymańska M., Korc M., Łabętowicz J. (2008): Effects of single
lim-ing of sandy soils not limed for more than 40 years in the light of results of long-term fertilizing experiment. Polish Journal of Soil Sciences, 41: 105–114.
Watanabe A., Kawasaki S., Kitamura S., Yoshida S. (2007): Tem-poral changes in humic acids in cultivated soils with continu-ous manure application. Soil Science and Plant Nutrition, 53: 535–544.
Yan D.Z., Wang D.J., Yang L.Z. (2007): Long-term effect of chemical fertilizer, straw, and manure on labile organic matter fractions in a paddy soil. Biology and Fertility of Soils, 44: 93–101.
Yanardağ I.H., Zornoza R., Cano A.F., Yanardağ A.B., Mermut A.R. (2015): Evaluation of carbon and nitrogen dynamics in different soil types amended with pig slurry, pig manure and its biochar by chemical and thermogravimetric analysis. Biology and Fertility of Soils, 51: 183–196.