Abstract—This paper describes possibility of using Bayesian Network for retraining Data Mining model. Concrete application of this proposal is in the field of the churn. Churn is a derivation from change and turn. It can be defined as a discontinuation of a contract. Data Mining methods and algorithms can predict behavior of customers. We can get better results using Six Sigma methodology. The goal of this paper is proposal of implementation of churn (with Bayesian network) to the phases of Six Sigma methodology.
Index Terms—bayesian network, data mining, dmaic, churn, six sigma.
I. INTRODUCTION
ix Sigma methodology has been widely adopted by industries and non-profit organizations throughout the world. Six Sigma methodology was first espoused by Motorola in the mid-1980s. The successful implementation of the Six Sigma program in Motorola led to huge benefits.
Motorola recorded a reduction in defects and manufacturing time, and also began to reap financial rewards. The Six Sigma has become the most prominent trend in quality management not only for manufacturing and service industries, but also for non-profit organizations and government institutes. [1], [2], [3], [4], [5]
The main target of Six Sigma is to minimize variation because it is somehow impossible to eliminate it totally. Sigma (σ) in the statistical field is a metric used to represent the distance in standard deviation units from the mean to a specific limit. Six Sigma is a representation of 6 standard deviations from the distribution mean. If a process is described as within six sigma, the term quantitatively means that the process produces fewer than 3.4 defects per million opportunities (DPMO). Table I shows how exponential the sigma scale is between levels 1 and 6. [6]
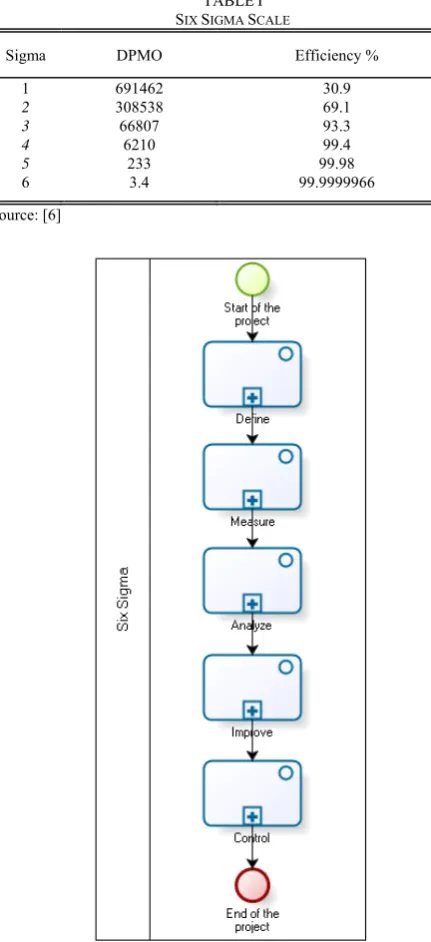
Six Sigma methodology consists of five phases: Define, Measure, Analyze, Improve and Control (DMAIC phases, or Six Sigma Cycle). Figure 1 shows standard DMAIC phases without their structure, modeling by Business Process Modeling Notation (BPMN).
Manuscript received July 02, 2012; revised July 29, 2012. This work supports VEGA project 1/0214/11.
Andrej Trnka, Ph.D. is with the Faculty of Mass Media Communication, University of SS. Cyril and Methodius in Trnava, Nam. J. Herdu 2, 917 01 Trnava, Slovak Republic (e-mail: [email protected]).
TABLEI SIX SIGMA SCALE
Sigma DPMO Efficiency %
1 691462 30.9
2 308538 69.1
3 66807 93.3
4 6210 99.4
5 233 99.98
6 3.4 99.9999966
Source: [6]
Fig. 1. Representation of Six Sigma methodology by BPMN
We can talk about Lean Six Sigma, too. Lean Six Sigma for services is a business improvement methodology that maximizes shareholder value by achieving the fastest rate of improvement in customer satisfaction, cost, quality, process speed, and invested capital. [7] But for our research, we can ignore the speed, since the investigated issue is not a realtime process management, so preferring Six Sigma methodology to Lean Six Sigma has proved to be the right
Position of Retraining CHURN Data Mining
Model in Six Sigma Methodology
Andrej Trnka, Member IAENG
[image:1.595.310.526.181.653.2]choice.
In our previously research [20], [21], [22], [23], [24] we implemented selected Data Mining methods and algorithms to the DMAIC phases of Six Sigma Methodology. The main areas of the implementation were manufacturing processes. But Six Sigma methodology can be used in customer services, too.
Some authors have used Data Mining algorithms in manufacturing processes, but without Six Sigma methodology. [9], [10], [11], [12]
Data mining is the process of discovering interesting patterns and knowledge from large amounts of data. The data sources can include databases, data warehouses, the Web, other information repositories, or data that are streamed into the system dynamically. [8] One of the tasks of data mining is to predict the customer’s churn.
II. CHURN
Mobile phone providers fight churn by detecting patterns of behavior that could benefit from new services, and then advertise such services to retain their customer base. Incentives provided specifically to retain existing customers can be expensive, and successful data mining allows them to be precisely targeted to those customers who are likely to yield maximum benefit. [13] Churn is defined as a discontinuation of a contract. Reducing churn is important because acquiring new customers is more expensive than retaining existing customers. In order to manage customer churn to increase profitability, companies need to predict churn behavior, however this problem not yet well understood [14], [15].
Churning customers can be divided into two main groups, voluntary and non-voluntary churners. Non-voluntary churners are the easiest to identify, as these are the customers who have had their service withdrawn by the company. There are several reasons why a company could revoke a customer’s service, including abuse of service and non-payment of service. Voluntary churn is more difficult to determine, because this type of churn occurs when a customer makes a conscious decision to terminate his/her service with the provider. Voluntary churn can be sub-divided into two main categories, incidental churn and deliberate churn.
Incidental churn happens when changes in circumstances prevent the customer from further requiring the provided service. Examples of incidental churn include changes in the customer’s financial circumstances, so that the customer can no longer afford the service, or a move to a different geographical location where the company’s service is unavailable. Incidental churn usually only explains a small percentage of a company’s voluntary churn. Deliberate churn is the problems that most churn management solutions try to battle. This type of churn occurs when a customer decides to move his/her custom to a competing company. Reasons that could lead to a customer’s deliberate churn include technology-based reasons, when a customer discovers that a competitor is offering the latest products, while their existing supplier cannot provide them. Economical reasons include finding the product at a better price from a competing company. Examples of other
reasons for deliberate churn include quality factors such as poor coverage, or possibly bad experiences with call centers. [16], [17].
III. DATA MINING MODEL
For our research we used IBM SPSS Modeler 14. Telecommunications provider is concerned about the number of customers it is losing to competitors. Historic customer data can be used to predict which customers are more likely to churn in the future. These customers can be targeted with offers to discourage them from transferring to another service provider.
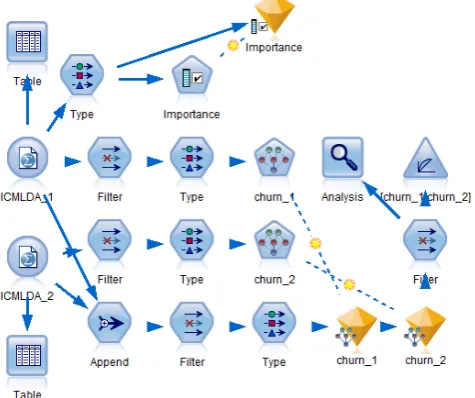
[image:2.595.307.545.281.480.2]This model focuses on using an existing churn data to predict which customers may be likely to churn in the future and then adding the following data to refine and retrain the model. [18]
Figure 2 shows the built model in IBM SPSS Modeler, which contains the historical data.
Fig. 2. Summary model for churn
In analysis we used two data sets. These data sets had identical structure of variables. First data set contained 412 rows (records) and the second data set contained 451 rows.
The first analysis with Feature Selection showed, that several variables were unimportant when predicting churn. These variables were filtered from data set to increase the speed of processing when the model is built.
The use of Bayesian networks for predict the churn was next step in analysis. A Bayesian network provides a succinct way of describing the joint probability distribution for a given set of random variables. In our analysis we used Tree Augmented Naïve Bayes. This algorithm is used mainly for classification. It efficiently creates a simple Bayesian network model. The model is an improvement over the naïve Bayes model as it allows for each predictor to depend on another predictor in addition to the target variable. Its main advantages are its classification accuracy and favorable performance compared with general Bayesian network models. Its disadvantage is also due to its simplicity; it imposes much restriction on the dependency structure uncovered among its nodes. [19]
IV. RESULTS
To compare and evaluate the generated models we had to combine the two data sets. The generated Bayesian Network model shows two columns. The first column contains a network graph of nodes that displays the relationship between the target and its most important predictors. The second column indicates the relative importance of each predictor in estimating the model, or the conditional probability value for each node value and each combination of values in its parent nodes.
[image:3.595.48.283.224.405.2]Figure 3 shows relationship between the target variable. Due to confidentiality of provider data, we changed the names of variables and we used generic names of variables.
Fig. 3. Created Bayesian network
[image:3.595.48.292.417.592.2]Figure 4 shows predictors (variables) importance.
Fig. 4. Predictors importance
To display the conditional probabilities for any node, it is necessary to click on the concrete node and the conditional probability is generated. Figure 5 shows conditional probability for most important variable – variable 2.
Fig. 5. Conditional probability of variable 2
To check how well each model predicts churn, we used an Analysis node. This node shows the accuracy in terms of percentage for both correct and incorrect predictions. The
analysis shows that both models have a similar degree of accuracy when predicting churn.
Table II – Table V show results for output variable churn.
TABLEII
COMPARING CHURN_1 WITH CHURN
Total 863
Correct 654 75.78 %
Wrong 209 24.22 %
TABLEIII
COMPARING CHURN_2 WITH CHURN
Total 863
Correct 655 75.9 %
Wrong 208 24.1 %
TABLEIV
AGREEMENT BETWEEN CHURN_1 AND CHURN_2
Total 863
Correct 682 79.03 %
Wrong 181 20.97 %
TABLEIV
COMPARING AGREEMENT WITH CHURN
Total 682
Correct 565 82.84 %
Wrong 117 17.16 %
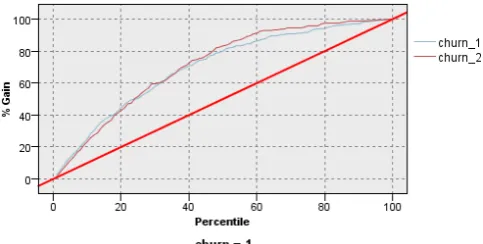
For the other view to data analysis we used Evaluation graph to compare the model’s predicted accuracy by building a gains chart. Figure 6 shows evaluating model accuracy.
Fig. 6. Evaluation graph of analysis (TAN Bayes Network)
The graph shows that each model type produces similar results. However, the retrained model (churn_2) using both data sets is slightly better because it has a higher level of confidence in its predictions. Therefore, we used another algorithm of Bayesian network – Markov Blanket.
[image:3.595.307.549.472.594.2]Figure 7 shows the same analysis, but with the use of Markov Blanket algorithm. The Evaluation graph shows, that churn_2 has higher level of confidence that churn_2 with TAN Bayes Network.
Fig. 7. Evaluation graph of analysis (Markov Blanket Bayes Network)
V. CONCLUSION
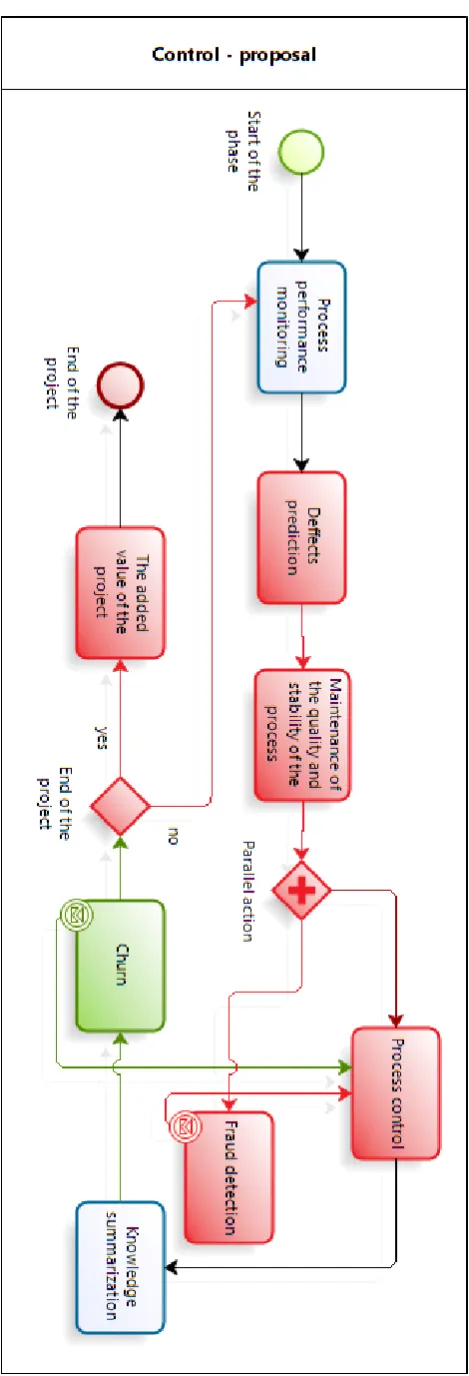
The churn can be implemented to the DMAIC phases of Six Sigma methodology. We suggest implementation of churn in to the Control phase with message event to the step Process control. Figure 8 shows proposed place of churn in Control phase.
The red tasks and gateways represent our origin proposal. The green task Churn is the new proposed task in Control phase of DMAIC.
ACKNOWLEDGMENT
Grateful acknowledgment for translating the English edition goes to Juraj Mistina.
REFERENCES
[1] Ch.Ch. Yang, “Six Sigma and Total Quality Management”, In.
Quality Management and Six Sigma, ed. A Coskun, Croatia: Sciyo, 2010.
[2] J. Antony, R. Banuelas, “Key Ingredients for the Effective Implementation of Six Sigma Program”, In. Measuring Business Excellence, 6(4), 2002, pp. 20-27.
[3] H. Wiklund, P.S. Wiklund, “Widening the six sigma concept: An approach to improve organizational learning”, In. Total Quality Management, 2002, Vol. 13, No. 2, pp. 233-239.
[4] L. Sandholm, L. Sorqvist “12 requirements for Six Sigma success”,
In. Six Sigma Forum Magazine, 2002, Vol. 2 No. 1, pp. 17-22. [5] Ch. CH. Yang, “An integrated model of TQM and GE Six Sigma”, In.
International Journal of Six Sigma and Competitive Advantage, 2004, Vol. 1 No. 1, pp. 97-111.
[6] B. El-Haik, A. Shaout, Software Design for Six Sigma, John Wiley & Son, Hoboken, New Jersey, 2010
[7] W. Bentley, P.T. Davis, Lean Six Sigma Secrets for the CIO, CRC
Press, Boca Raton, Florida, 2010
[8] J. Han, M. Kamber, J. Pei, Data Mining Concepts and Techniques,
Elsevier, Waltham, Massachusets, 2012
[9] M. Kebisek, P. Schreiber, I. Halenar, “Knowledge Discovery in Databases and its Application in Manufacturing”, In. Proceedings of the International Workshop "Innovation Information Technologies: Theory and Practice", Dresden, Forschungszentrum Dresden, 2010, pp. 204-207
[10] R. Halenar, “Matlab possibilities for real time ETL method”, In. Acta
Technica Corviniensis: Bulletin of Engineering, 2012, vol. 5, No. 1, pp. 51-53
[11] P. Vazan, P. Tanuska, M. Kebisek, “The data mining usage in production system management”, In. World Academy of Science, Engineering and Technology, 2011, Year 7, Issue 77, pp. 1304-1308
[12] M. Kudla, M. Strémy, “Alternatívne metódy ukladania pološtruktúrovaných dát”, In. Applied Natural Sciences 2007,
International Conference on Applied Natural Sciences, Trnava, Slovak Republic, pp. 404-409
[13] I. Witten, E. Frank, M. Hall, Data Minig Practical Machine Learning Tools and Techniques, Elsevier, Burlington, Massachusets, 2012 [14] J. Ahn, S. Han, Y. Lee “Customer churn analysis: Churn
determinants and mediation effects of partial defection in the Korean mobile telecommunications service industry”, In.
Telecommunications Policy 30(10-11), pp. 552–568, 2006
[15] K. Ch. Lee, N. Y. Jo, “Bayesian Network Approach to Predict Mobile Churn Motivations: Emphasis on General Bayesian Network, Markov Blanket, and What-If Simulation”, In. Second International Conference, FGIT 2010, Jeju Island, Korea, December 13-15, Springer, 2010
[16] H. Kim, C. Yoon, “Determinants of Subscriber Churn and Customer Loyalty in the Korean Mobile Telephony Market”. In.
Telecommunications Policy 28, pp. 751-765, 2004
[17] J. Hadden, A. Tiwari, R. Rajkumar, D. Ruta, “Churn Prediction: Does Technology Matter?”, In. International Journal of Electrical and Computer Engineering 1:6, pp. 397-403, 2006
[18] IBM SPSS Modeler 14.2 Applications Guide, IBM 2011 [19] IBM SPSS Modeler 14.2 Algorithms Guide, IBM 2011
[20] A. Trnka, “Classification and Regression Trees as a Part of Data Mining in Six Sigma Methodology”, In. WCECS 2010: World
Congress on Engineering and Computer Science 2010. Vol. I. pp. 449-453
[21] A. Trnka, “Market Basket Analysis with Data Mining Methods : Six Sigma methodology improvement”, In. International Conference on Networking and Information Technology 2010, IEEE, 2010, pp. 446-450
[22] A. Trnka, “Six Sigma Methodology with Fraud Detection”, In.
Advances in Data Networks, Communications, Computers: 9th WSEAS Interanational Conference on Data Networks, Communications, Computers (DNCOCO`10), Faro, Portugal, 2010, pp. 162-165.
[23] A. Trnka, “RFM Analysis as a Part of DMAIC Phases”, In: 2011
International Conference on Database and Data Mining (ICDDM 2011), Sanya, 2011, pp. 278-281.