Abstract—The spate in popularity of multimedia applications has led to the need for optimization of bandwidth allocation and usage in telecommunication networks. Modern telecommunication networks should by their definition be able to maintain the quality of different applications with different Quality of Service (QoS) levels. QoS requirements are generally dependent on the parameters of network and application layers of the OSI model. At the application layer QoS depends on factors such as resolution, bit rate, frame rate, video type, audio codecs, etc. At the network layer, distortions such as delay, jitter, packet loss, etc. are introduced. This paper presents simulation results of modeling video streaming over wireless communications networks. The differences in spatial and time characteristics of the different subject groups were taken into account. Analysis of the influence of bit error rate (BER) and bit rate for video quality is also presented. Simulation showed that different video subject groups affect the perceived quality differently when transmitted over networks. We show conclusively that in a transmission network with a small error probabilities (BER = 10-6, BER = 10-5), the minimum bit rate (128 kbps) guarantees an acceptable video quality, corresponding to MOS > 3 for all types of frames.
Index Terms— video streaming, trace file, BER, PSNR, MPEG Codec
I. INTRODUCTION
he growing popularity of multimedia applications brings with it the attendant necessity for optimizing the distribution of telecommunication network bandwidth. To a certain extent, the quality of video playback is dependent on application type. For example, in the playback of highly dynamic events such as sports and films, it is imperative to maintain a high video quality, while for relatively static events such as newscast and videoconference the accent would be more on the content. Contemporary telecommunication networks are required to support the quality of different applications with varying QoS levels [1]. The requirements on QoS are as a rule dependent on network and application layer parameters [2]. At the application level, QoS depends on such factors as bit rate, frame speed, types of video- and audio-codecs, etc. Some
Manuscript received June 15, 2011; revised August 11, 2011.
A. A. Atayero and J. O. Iruemi are with the Electrical and Information Engineering Department, Covenant University, PMB1023 Ota, Nigeria (phone: 234-807-886-6304; e-mail: [email protected]).
O. I. Sheluhin and Y. A. Ivanov are with the Department of Information Security, Moscow Technical University of Communication and Informatics, Moscow, Russia (e-mails: [email protected] , [email protected]).
distortions such as delay, jitter, packet loss, etc are introduced at the network level.
Normally, data transmission over wired networks with limitless bandwidth is characterized by a very low probability of bit error occurrence. However, due to the unpredictability of real-time transmission conditions, communication over a wireless network has certain peculiarities [3], [4], [5]. Wireless channels are characterized by independent and randomly distributed bit errors. It is for this reason that the White Gaussian Noise (WGN) model is used in the modeling and simulation of wireless channels. In this model, a bit in the video sequence is distorted (inverted) with a priori probability. [6] – [8] give detailed explanation of the effect of bit error on video quality during transmission.
The effect of different types of video subjects on the quality of video playback (for example from static e.g. newscast to highly dynamic e.g. sporting events) as related to the parameters of network and application layers is however not usually considered in the literature. The main objective of this paper is to fill this glaring gap. To this end we present two questions that are very important in relation to the network and application layers:
Q1.What is the minimum bit rate value for all types of video subjects for transmission over telecommunication networks that will guarantee acceptable QoS (PSNR > 27 dB), which corresponds to a MOS > 3 [9]?
Q2.What is the acceptable number of error bits for all types of video subjects, and what consequently is the limit (threshold) vis-à-vis playback quality under which viewer experience remains of acceptable quality?
II. EXPERIMENT
In order to answer these two questions, video clips were grouped based on their inherent spatial and time redundancies [10]. Next, an experiment of video transmission over a wireless network under various transmission conditions was conducted and the threshold for high, medium and low quality were consequently determined.
A. Classification of video into subject groups (SG)
The process of grouping video streams into different subject groups makes it possible to examine members of a particular group in terms of their similar characteristics. This allows for priority control and consequently optimization of the bandwidth of a given video stream. An automatic
Effect of Video Streaming Space–Time
Characteristics on Quality of Transmission over
Wireless Telecommunication Networks
Oleg I. Sheluhin, Aderemi A. Atayero
, Member IAENG
, Yuri A. Ivanov, and Juliet O. Iruemi
classification of video subject will make it possible to forecast video quality with a priori probability.
Defining such dynamics is of great interest for video coding, since the space-time characteristics of video signal defines the effectiveness of the coding procedure. In addition to quality measurement, it is possible to calculate the spatial and time features of the video (Fig. 1). As such, predicting video quality in relation to the dynamics of the subject based on the change in MOS becomes possible [11].
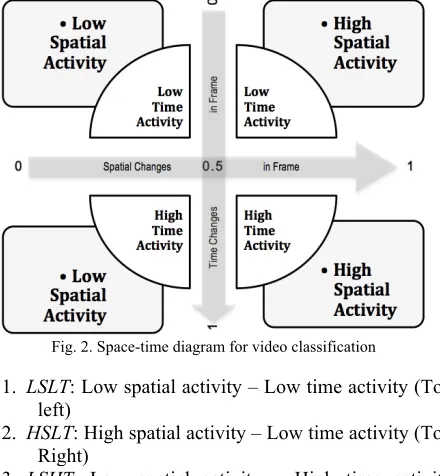
The subject of each video clip may differ considerably from others depending on its dynamics (i.e. the spatial complexity and time activity of the image). In the space-time plan introduced in [9], each video clip (of limited duration and homogeneous content) may be presented in the Cartesian coordinate system, where the spatial characteristic is on horizontal axis, and the time characteristic is on the vertical axis (Fig. 2).
In line with the approach depicted in Fig. 2, each video clip depending on the dynamics of its subject group may be classified into one of the following four categories, namely:
1. LSLT: Low spatial activity – Low time activity (Top left)
2. HSLT: High spatial activity – Low time activity (Top Right)
3. LSHT: Low spatial activity – High time activity (Bottom left)
4. HSHT: High spatial activity – High time activity (Bottom Right)
Suffice to note here that this classification will not be effective for video sequences that are of considerable duration, because of the inherent non-homogeneous nature of their content – a consequence of their length. Video clips
are classified into different groups based on the spatial and time dynamics of change of picture elements (pixels) [11].
B. Calculation of time changes
Motion in a video clip is estimated using the Sum of Absolute Difference (SAD) indicator, which calculates the pixel-wise sum of absolute differences between two frames being compared. The formula for calcuating SAD is given in (1):
€
SAD
n,m=
B
n(
i
,
j
)
−
B
m(
i
,
j
)
j=1
M
∑
i=1
N
∑
(1)where Bn , Bm – two NxM sized frames; i, j – pixel
coordinates.
C. Calculation of spatial changes
Spatial peculiarities are calculated at the edges of block segments, as well as through the contrast and brightness between current and previous frames. Brightness is calculated as the modal difference between the average brightness value of the previous and present frames using the formula in (2).
€
Br
n=
Br
av n( )(
i
,
j
)
−
Br
av n( −1)(
i
,
j
)
j=1
M
∑
i=1
N
∑
(2)where Brav(n)– average brightness of nth frame with size
NxМ; i and j – pixel coordinates.
Video sequences were grouped into three types of subjects on the basis of the calculations above [11]. The groups are as described below:
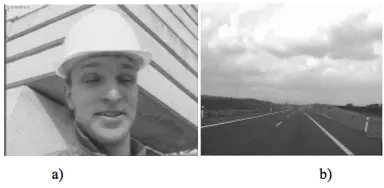
1. Static Subject Group (SSG): Includes sequences with minimal observation area (e.g. face of a telepresenter) on a static background (Fig. 3); 2. Pseudo Static Subject Group (PSSG): Includes
video sequences with continuous and homogeinic change in picture e.g. Movies (Fig. 4);
[image:2.595.54.283.173.279.2]3. Highly Dynamic Subject Group (HDSG): Includes video sequences, where both local and global parts of the picture undergo abrupt and heterogeneous change e.g. sporting events (Fig. 5).
[image:2.595.64.284.458.696.2]Fig. 3. Examples of typical static video sequences: a) Akiyo, b) Hall
Fig. 1. Method of estimating video quality based on subject type
[image:2.595.330.509.586.689.2]Fig. 4. Examples of typical pseudo static video sequences: a)
Foreman, b) Highway.
Fi g. 5. Examples of typical highly dynamic video sequences: a)
Football, b) Soccer.
The subject classification adopted is based on the parameters described above. Due to the availability of a plethora of objective parameters, a statistical method was adopted for data analysis and subject classification. Each of subject type defined above is characterized by a unique set of statistical motion-related features.
D. Modeling of video streaming over a wireless network
Twelve standard test video clips of YUV format and resolution CIF (352x288) available in [12] and recommended in [13] by the ITU for carrying out test experiments were used as input test video sequences. The block diagram of the experimental setup is shown in Fig. 6. The input video sequence of YUV format is coded by an
MPEG-2 codec with GOP type IBBPBBPBB. Each video was coded using a different bit rate (128, 384, 768, and 1,150 kb/s).
Coding and decoding of the input video and modeling of a wireless network with random bit errors in its channel was achieved using the VCDemo software [14]. Simulation of video streaming over a wireless network was done in accordance with the OSI model on known layers: Application,
Transport, Network, Data link and Physical.
Application layer: Coding, decoding and packetization of the video stream are done at the application layer of the OSI model. The video stream is divided into variable length packets of sizes up to 1,500 Bytes, with subsequent addition of a 12-Byte RTP heading. The addition of the RTP heading ensures that the MPEG bit stream is segmented in such a way that MPEG start codes are withheld in the beginning of data packets.
Transport layer:The UDP protocol is modeled at this layer, with the addition of heading and control sum (8 Bytes). A 20-Byte IP heading is subsequently added at the network layer.
Data Link layer: The modeling of IEEE 802.11 protocol is done at this layer. The channel bandwidth is set to 20 Mb/s.
Physical layer:Simulation of random bit error (WGN) in the channel with BER probability taken as equal to 10–6, 10–5,
10–4, and 10–3 is done at this layer.
Thus, changing of the parameters of transmitted video over wireless network was achieved both for the application layer (by changing the bit rate speed) and the network layer (by changing BER). The Peak Signal-to-Noise Ratio (PSNR) and Mean Opinion Score (MOS) were used as quality indicators [15]. Transmission of each video clip over the network was simulated 16 times with different settings.
III. RESULTS AND DISCUSSION
A large quantity of experimental data was generated in the course of the experiment reported in section 2.0 above. Average values of PSNR from different BER for varying bit rate values are presented in Fig. 7.
From Fig. 7, it is seen that by increasing the BER to 10-4 for
different bit rates, the average PSNR remains practically the same. This indicates that the quality of transmitted video clip remains unchanged a pointer to the fact that the decoder is able to correct errors at this BER level. For BER=10-4, a slight
change in quality is observed only for
[image:3.595.73.289.184.289.2]HDSG video sequences. However, a decrease in the average
[image:3.595.311.548.443.595.2]Fig. 6. Block diagram of experimental setup
Fig. 7. Average PSNR of different Bit Error Rates for four bit rates: a) 128 kb/s; b) 384 kb/s; c) 768 kb/s and d) 1,150 kb/s
TABLE 1. PARAMETERS USED IN SIMULATION
A B C A B C A B C A B C
1 128 10–6 5 384 10–6 9 768 10–6 13 1,150 10–6
2 128 10–5 6 384 10–5 10 768 10–5 14 1,150 10–5
3 128 10–4 7 384 10–4 11 768 10–4 15 1,150 10–4
4 128 10–3 8 384 10–3 12 768 10–3 16 1,150 10–3
[image:3.595.53.288.471.585.2]value of PSNR is observed for practically all the video clips for 10-4 ≥ BER ≥ 10-3. The highest degradation of 10 dB is gotten for the Soccer video.
[image:4.595.50.288.202.313.2]In addition to the average values, it is necessary to estimate the distribution of PSNR value for each experiment, since the average value cannot adequately depict the change in quality that occurs for different modeling conditions. The histograms of PSNR value distribution for the video clips are shown in Fig. 8 through Fig. 10 for all the 16 modeled cases. The numbers 1 to 16 on the right horizontal axis represents the serial number of the experiment with the corresponding parameters given in Table 1.
[image:4.595.307.546.276.369.2]Fig. 8. PSNR distribution histograms for SSG video clips under various modeling conditions: a) Akiyo; b) Hall
Fig. 9. PSNR distribution histograms for PSSG video clips under various modeling conditions: a) – Foreman; b) – Highway
Fig. 10. PSNR distribution histograms for HDSG video clips under various modeling conditions: a) Football; b) Soccer
We see from Fig. 8 – Fig. 10 that for BER values of 10–6
and 10–5, the distribution of quality indicator is practically
identical and situated in the high PSNR region. For BER = 10–4, the distribution of HDSG PSNR value is different
when compared with those of other subject groups. In the case of BER=10–3 for different bit rate values, the
distribution is spread out and tends toward the region of low PSNR values. This indicates degradation in the quality of transmitted video sequence. The presence of low PSNR value components in the distribution indicates the existence of frames with minimum acceptable quality. For example, the worst reception quality (PSNR < 20 dB) is lowest for the
SSG and higher for PSSG. The highest quantity is seen in
HDSG. We also note that an increase in the bit rate brings about a shift in PSNR towards its region of higher value.
This is clearly observable for video sequences of the SSG
type, where the difference between average PSNR values for 128 kb/s and 1,150 kb/s bit rates oscillates between 8 and 11 dB for BER=10–6, BER=10–5 and BER=10–4. For PSSG, this
indicator comprises from 4 to 7 dB, and 4 to 6 dB for
HDSG. We can infer from the foregone that an increase in the bit rate has most effect on SSG.
The relationship between average PSNR value of video clips, Bit rate and BER is shown on Fig. 11 – Fig. 13. The general picture of changes in the average PSNR value while increasing bit rate and BER allows for drawing the following conclusions. For SSG, average value of PSNR for changes in bit rate from 128 kb/s to 1,150 kb/s has an upward increase from 32 dB to 41 dB (Akiyo) and from 30 dB to 38 dB (hall). It may be noted that increasing error level to BER=10–4 has no effect on quality. However, for
BER = 10–3 the quality of SSG video clips degrades
[image:4.595.52.288.348.455.2]considerably down to 27 dB.
[image:4.595.311.543.403.510.2]Fig. 11. Average PSNR value from SSG video clip Bit rate and BER values for various modeling conditions: a) – Akiyo; b) – Hall
Fig. 12. Average PSNR value from PSSG video clip Bit rate and BER values for various modeling conditions: a) – Foreman; b) – Highway
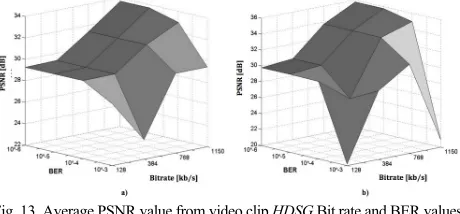
Fig. 13. Average PSNR value from video clip HDSG Bit rate and BER values for various modeling conditions:
a) Football; b) Soccer
With an increase in bit rate from 128 kb/s to 1,150 kb/s, the average PSNR value for HDSG increases from 29 dB to 36 dB and from 32 dB to 38 dB for Forman and Highway
respectively. It is obvious that an increase in error to BER=10–4 has practically no effect on signal quality for low
[image:4.595.51.288.485.591.2] [image:4.595.313.543.545.652.2]and BER of 10–4. With an increase in error to an error bit in
every 1000 bits received (BER=10–3), the quality of HDSG
degrades to 28 dB for all bit rate values.
For HDSG and with an increase in bit rate from 128 kb/s to 1,150 kb/s, the average PSNR value increases from 30 dB to 36 dB and from 29 dB to 34 dB for Soccer and Football
respectively. A comparison with other subject groups reveals that a distinct degradation in quality is observable
for BER = 10–4. This corroborates our earlier submission on
the decoder's inability to reproduce the input picture with moving elements under high bit rate conditions given that BER=10–4. With a further increase in BER to 10–3, average
PSNR value decreases to 20 dB for bit rates of 128 and 1,150 kb/s.
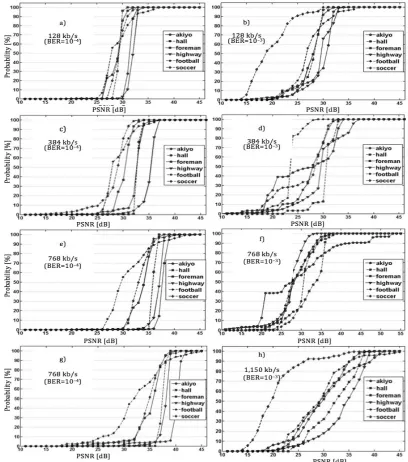
The probability distribution of experimental data for different bit rate values is shown on Fig. 14a – 14h. The distribution values for BER=10–6, BER=10–5, BER=10–4 are
almost identical and as such shall not be discussed. An interesting fact worth mentioning is the distribution of video clip data for different subject groups under low (BER=10–4)
and high (BER=10–3) probability of error occurrence.
Probability distribution for 128 kb/s and BER=10–4 for six video clips lies in the region of 22 to 37 dB. The probability has an abrupt vertical rise for all videos, thus videos of different subject groups are practically identical. Probability distribution BER=10–3 for six video clips lies in the region of low PSNR with values from 13 to 37 dB. For HDSG we observe a high probability of poor quality occurrence
(degradation by 10 dB).
Probability distribution for 384 kb/s, BER=10–4 for six
videos lies in the region of 22 to 37 dB. And in similarity to previous bit rates, probability distribution for all videos has a vertical spiky character. For HDSG the distribution characteristic not unlike for 128 kb/s bit rate is less abrupt, indicating a high probability of poor quality occurrence. Probability distribution for 768 kb/s, BER=10–4 for six
[image:5.595.91.499.155.617.2]videos lies in the region of 26 to 45 dB, which attests to a rise in the quality of all video clips. For almost all the videos, probability distribution has a vertical spiky character, showing constancy in quality.
Fig. 14. Probability distribution of experimental data with different bit rates and BER: a) 128 kb/s (BER=10– 4); b) 128 kb/s (BER=10–3); c) 384 kb/s
For BER=10–3 the distribution has a slope shape,
which indicates a high probability of occurrence of poor quality. The greatest change in quality is demonstrated by (akiyo) SSG video clip and (Football) HDSG video.
Probability distribution for 1,150 kb/s bit rate and BER=10–4 for six videos lies in the region of 17 to 45 dB, which indicates a wide spread of quality. For SSG and
PSSG, the distribution has a vertical spiky form in the region of high PSNR value. For PSSG and HDSG, the distribution is less abrupt, which indicates PSNR data heterogeneity tending towards low values. The probability distribution of all videos is of a slanting form, highly dispersed and lies in the region of 13 to 45 dB. The distribution has the most vertical form for HDSG, but lies in the low value region, which indicates the presence of a large number of poor quality frames.
IV. CONCLUSIONS
Imitation modeling showed that different video subject groups affect the perceived quality of video transmitted over wireless telecommunication network differently. Hence, a mere consideration of only the quality of transmitted (and subsequently decoded) video sequence at the application (i.e. bit rate) and network (i.e. BER) layers will not suffice, but another criterion of no mean importance must also be considered – i.e. the subject group category to which video sequence belongs.
We have shown conclusively in this paper that in transmission conditions over a network with low probability of error occurrence (BER=10–6, BER=10–5), the minimum bit
rate value of 128 kb/s provides acceptable video quality corresponding to an MOS > 3 for all types of video subject groups. This incidentally answers the first objective question (Q1) posed in the introduction to this paper. Increasing the bit rate value further affects the SSG mainly, while no appreciable improvement in quality is observed for video clips with moving elements (i.e. PSSG and HDSG). A low error level (BER=10–4) does not affect the quality of
decoding SSG video sequences, but it affects that of PSSG
and is very pronounced for HDSG videos. This observation leads us to safely conclude that the decoder is only capable of effectively correcting small errors in static pictures. Increasing the error rate to BER=10–3 affects the decoding of video sequences of all the subject groups. The SSG and
PSSG demonstrate satisfactory quality, while HDSG shows poor quality from a subjective assessment point of view. Hence, the acceptable number of error bits, and consequently, the threshold from quality point of view, for which the viewer picture perception remains of acceptable quality for all types of video subject groups is BER=10–4.
This is an appropriate answer to the second objective question (Q2) raised at the onset of the paper. We have thus been able to achieve the objectives of this paper by proffering satisfactory answers to Q1 and Q2, and by so doing fulfilling the aim of filling an identified gap in the literature vis-à-vis the effect of different video subject groups on the quality of decoded video transmitted over wireless telecommunication networks.
ACKNOWLEDGEMENT
The authors are grateful to the National Science Foundation and contributors to the Video Trace Library for making the video trace files used in this study freely available on the
Internet [12]. We likewise appreciate the Signal & Information Processing laboratory SIPlab of Delft University of Technology for making a freeware version of the VCDemo software used in the simulation experiment of this work available for free download [14].
REFERENCES
[1] Ghinea G., Thomas J. P., “QoS impact on user perception and understanding of multimedia video clips”, Proc. of ACM Multimedia’98, Bristol, UK, pp. 49–54, 1998.
[2] Khan A., Li Z., Sun L., Ifeachor E., “Audiovisual quality assessment for 3G networks in support of E-healthcare”, Proc. of CIMED , Plymouth, UK, 25-27 July 2007.
[3] Chondros P., Prayati A., Koulamas C., Papadopoulos G., “802.11 performance evaluation for multimedia streaming”, Fifth International Symposium on Communication Systems, Networks and Digital Signal Processing, Patras, Greece, 19-21 July, 2006. [4] Munir B., Chilamkurti N. K., Soh B. “A comparative study of voice
over wireless networks using NS-2 simulation with an integrated error model”, International Conf. on WiCOM, 22–24 Sept. 2006. [5] Koucheryavy Y., Moltchanov D., Harju J. “Performance evaluation
of live video streaming service in 802.11b WLAN environment under different load conditions”, MIPS, Napoli, Italy, November 2003. [6] He Z., Xiong H. Transmission distortion analysis for real–time video
encoding and streaming over wireless networks, IEEE transactions on Circuits and Systems for Video Technology, Vol. 16, No. 9, Sept. 2006.
[7] Kanumuri S., Cosman P.C., Reibman A. R., Vaishampayan V. A. Modelling packet–loss visibility in MPEG2 video, IEEE Transactions on Multimedia, Vol. 8, No. 2, April 2006.
[8] Ke, Lin C., Shieh C. Evaluation of streaming MPEG video over wireless channels”, Journal of mobile multimedia, Vol. 3, No. 1, pp. 047–064, 2007.
[9] Yamagishi K., Tominaga T, Hayashi T., Takahasi A. Objective quality estimation model for videophone services, NTT Technical Review, Vol.5, No. 6, June 2007.
[10] Krzanowski W. J. Principles of Multivariate Analysis”, Clarendon press, Oxford, 1998.
[11] Khan A., Sun L., Ifeachor E. Content Clustering Based Video Quality Prediction Model for MPEG4 Video Streaming over Wireless Networks IEEE ICC CQRM 14–18 June 2009, Dresden, Germany. [12] Video Trace Library, Arizona State University, Available at:
http://trace.eas.asu.edu, Last accessed: 2011.06.15
[13] ITU–R Recommendation BT.802.–1 Test pictures and sequences for subjective assessments of digital codecs converging signal produced according to Recommendation ITU–R BT.601.
[14] VCDemo, Signal & Information Processing Laboratory, Delft University of Technology, Available at: http://ict.ewi.tudelft.nl/vcdemo, Last accessed: 2011.06.15.
[15] Winkler S., Dufaux F. “Video quality evaluation for mobile applications”, Proceedings of SPIE Visual Communications and Image Processing, Lugano, Switzerland, 2003.