BACHELOR THESIS
Binge Drinking Behavior by Adolescents in Dülmen/Germany - Gender
Differences and the Role of Prototype/Willingness, Alcohol Expectancy
and Social Norms.
by Jan-Erik Schürmann
University of Twente
July 2009
Enschede, Netherlands
2
Binge Drinking Behavior by Adolescents in Dülmen/Germany - Gender
Differences and the Role of Prototype/Willingness, Alcohol Expectancy
and Social Norms.
Abstract
Aim of this study was to explain binge drinking behavior of adolescents from Dülmen in Germany
with a combination of the prototype/willingness model, alcohol expectancy and social norm. Alcohol
consumption and the social cognitions in relation to binge drinking behavior of 111 respondents
were measured with a questionnaire. Results show that binge drinking is a widespread problem in
Dülmen. The frequent binge drinkers score significantly higher on the scales measuring
prototype/willingness, alcohol expectancy and social norm so one can conclude that these social
cognitions are influencing adolescents’ health risk behavior. Especially the prototype/willingness
3
Introduction
Adolescents’ excessive alcohol consumption is a widespread problem in Germany. Excessive
alcohol consumption can cause some short term negative health outcomes, like unintentionally
injuries, injuries caused by assaults from drunken students (Hingson, 2005), alcohol poisoning,
gastritis, pancreatitis and sexually transmitted diseases (Naimi, 2003). Moreover, long term harms
like cirrhosis, non-cirrhotic liver damage (Bellentani, 1997), a decreased testosterone metabolism
and a decreased spermatogenesis (Kuller, 1978) can occur. A lot of adolescents in Germany are
threatened by these health risks because a habit called ‘binge drinking’, which is defined by
Wechsler (1992) as the ‘consumption of five or more drinks on one occasion’ becomes more and
more common among adolescents (BZgA, 2007). A study from the Bundesagentur für
gesundheitliche Aufklärung in 2007 revealed that 51% from the 16 to 17 years old adolescents
participated in binge drinking behavior in Germany. The consumption of five or more glasses of
alcohol at least one day in the last 30 days is meant by this. It is remarkable that the male
adolescents (63%) participate more often in binge drink behavior than female adolescents (37%).
So binge drinking seems to be very popular among adolescents in general and even more popular
among male than among female adolescents.
The prototype/willingness model
Many models that try to explain behavior state that the decision to engage in a particular
behavior is the consequence of rational thinking, such as weighing pros and cons until a decision to
act or not to act is made. This decision is often referred to as ‘behavioral intention’. Fishbein and
Ajzen’s theory of reasoned action (1980) and its follower Ajzen’s theory of planned behavior (Ajzen,
1985) are good examples of such models. They have been very useful in predicting health
promoting behavior like exercising (Godin, & Kok, 1996) and condom use (Fisher, Fisher, & Rye,
4
But explaining health risk behavior in adolescents with models based on reasoned thinking
seems more difficult, which can for example be seen in a study from Stacy et al. (1994) on smoking.
Because models with concepts based on planning like behavioral intention have problems with
explaining adolescents’ health-risk behavior like binge drinking, Gibbons creates the
prototype/willingness model (1995). The prototype/willingness model aims at explaining and
predicting adolescents’ health risk behavior by introducing the idea of this behavior being a reaction
to social events. The model is based on three assumptions with the first one being that health risk
behavior from adolescents is rarely rational or deliberate but simply a reaction to circumstances and
situations which evoke health risk behavior. The second assumption is that this behavior is a social
event which happens seldom alone but in a social situation most of the time. Third, because they
happen during social events these behaviors have explicit social images associated with them
which are recognized by a lot of people. In studies support for these assumptions has been found
(Gibbons, Gerrard, & Boney McCoy, 1995). The model has two main concepts, prototype and
willingness. The first concept prototype is based on the idea that adolescents have social images of
themselves and people surrounding them (Erikson, 1963) which are also shaped by engaging in
health risk behavior. Thus adolescents have a clear social image (prototype) of the character of
their age who engages in a specific health risk behavior like smoking or drinking alcohol (Cantor &
Mischel, 1979; Setterlund & Niedenthal, 1993). By asking questions like “Take a moment to think
about the type of kid your age who drinks. We are not interested in anyone in particular, just the
typical person your age who drinks” (Gerrard et al., 2008) these prototypes can be assessed. After
that the favorability of such a prototype can be evaluated with question like “How
[popular/selfish/smart] are they?” (Gerrard et al., 2008). A positive opinion about a particular
prototype (e.g. the typical binge drinker) makes an adolescent more willing to engage in this kind of
behavior. In studies on alcohol consumption evidence for this relation has been found (Gibbons,
Helweg-Larsen & Gerrard, 1995). These prototypes act like goal-states and motivate young people
to engage in health risk behavior (Leventhal & Cleary, 1980). Adolescents take up such particular
5
the closer the adolescents drinking prototype was to their self-image the greater their intention to
drink. This is referred to as prototype similarity or prototype matching (Chassin, Tetzloff, & Hershey,
1985).
The second concept is willingness. It describes that adolescents do not plan to engage in health
risk behavior but happen to get into situations where the opportunity to perform this behavior is
present. Under such circumstances it becomes more important what adolescents are willing to do
instead of what they planned to do. This is a difference to the behavioral intention concept because
it lacks reasoning and consideration but is a reaction to the circumstances. This allows the
conclusion that a person who engages in binge drinking behavior more frequent and more
excessive has a more positive prototype concept, feels more similar to the typical binge drinker and
has a stronger willingness to engage in binge drinking behavior,.
Until now the prototype/willingness model yielded promising results in explaining and predicting
health risk behavior (Gibbons, Helweg-Larsen & Gerrard, 1995). Two other concepts try to explain
adolescents’ risky alcohol consumption: alcohol expectancy and social norm. Idea of this study is to
combine the prototype/willingness model with alcohol expectancy and social norm to explain binge
drinking behavior of adolescents in Germany.
Alcohol expectancy
Alcohol expectancy forms another approach which aims at understanding adolescents’ heavy
alcohol consumption (i.e. binge drinking). The concept alcohol expectancy is derived from
Bandura’s Social cognitive theory (1977), which states that a behavior like drinking alcohol is
influenced by outcome expectancies in relation to perceived consequences this consumption could
have. Higher levels of positive alcohol expectancies were found to be related to higher alcohol
consumption (Brown et al. 1985; Leigh 1989). Positive alcohol expectancies represent some kind of
6
relaxation, affective change and so on. Studies have given empirical support for these alcohol
expectancies being influential on adolescents’ drinking behavior (Oei et al. 1990; Jones et al.,
2001). The most popular scale to assess positive alcohol expectancies is the Alcohol Expectancy
Questionnaire (Brown et al., 1980, 1987) which covers the six factors global positive changes,
sexual enhancement, physical & social pleasure, increased social assertiveness, relaxation &
tension reduction and arousal & power.
Social Norms
A third concept influencing adolescents’ heavy alcohol consumption is social norms. It has its
origin in the Theory of Reasoned Action (Fishbein & Ajzen, 1980) and its follower the Theory of
Planned Behavior (Ajzen, 1985). According to these theories social norms together with attitude and
self-efficacy influence the formation of intentions, which in turn are the predictor of behavior. In
literature on alcohol consumption social norms are divided into two distinct categories of
perceptions: descriptive and injunctive norms. Descriptive norms refer to what others do and are
mainly based on observations of peers quantity and frequency of alcohol consumption in given
situations. In contrast, injunctive norms refer to others’ approval of drinking and represent perceived
moral rules of a peer group (Cialdini, Reno, & Kallgren, 1990). Studies have found empirical support
for peer influence on adolescents’ drinking behavior (Orcutt, 1991; Perkins, 1985; Perkins &
Wechsler, 1996). Because this peer influence is decisive by adolescents’ alcohol consumption, this
research will focus on social norm of peer groups. One could expect that adolescents who engage
in binge drinking behavior more often could feel a stronger social norm to engage in this behavior.
In conclusion one can formulate some expectations regarding different roles of
prototype/willingness, alcohol expectancies and social norms in relation to binge drinking behavior
by male and female adolescents. From the literature reviewed above follows that binge drinking is
7
behavior willingness, positive alcohol outcome expectations and the perception of a social norm to
engage in binge drink behavior. Thus first, frequent binge drinkers in the sample are expected to
have a more positive behavior willingness to engage in binge drinking, a more positive prototype
evaluation and a more positive similarity/matching of a typical binge drinker along with having more
positive alcohol outcome expectancies and to feel a stronger social norm to engage in binge
drinking behavior than occasional binge drinkers. According to the BZgA binge drinking is more
common among male than female adolescents so that, second, a similar pattern is expected in the
sample chosen for this study. Male adolescents are expected to engage in binge drinking behavior
more often, going along with having more positive behavior willingness, a more positive prototype
evaluation, a more positive similarity/matching of a typical binge drinker, more positive alcohol
expectancies and a stronger social norm to engage in binge drinking behavior than female
8
Method
Participants
Participants were 111 adolescents from Dülmen in Germany. There were 61 male (55.0%) and
50 female participants (45.0%), in the ages between 16 to 29 years with an average of 20.9 years.
All participants were higher educated, they were either students or grammar school pupils.
Questionnaire
After a short introduction, which explained the participant that this survey is about alcohol
consumption of adolescents, that it will take approximately 10 minutes to be filled out and that the
answers will be treated anonymous, the gender and the age of the participants were assessed.
After that questions regarding the alcohol consumption followed. First, average days of
consumption during the week was assessed by asking “On how many weekdays (Monday until
Thursday) do you normally drink alcohol?” , followed by five options ranging from “0 days” to “4
days”. Second, the average amount of standard glasses were assessed by the open question “If
you drink alcohol on weekdays how many standard glasses (0.2l of beer, 0.2l of wine or 0.2l of
mixed alcoholic drinks) do you consume per occasion on average?”. Third, average days of alcohol
consumption on weekend was assessed by asking “On how many days on weekend (Friday until
Sunday) do you normally drink alcohol?”, with answers ranging from “0 days” to “3 days”. Fourth,
again the average amount of standard glasses were assessed by the open question “If you drink
alcohol on weekend how many standard glasses do you consume per occasion on average?”.
Finally, the binge drinking behavior was determined with the open item “How often did you drink
9
Three questions were based on the prototype/willingness model. Prototype favorability was
measured by letting the participants rate (“How do you think about a person of your age and of your
gender who drinks more than six glasses of alcohol per occasion at least once per week?”) twelve
statements (“Do you agree with the following statements? I think that this person is… …smart”,
“…rough”, “…popular”, “…immature”, ”…cool”, “…confident”, “…independent”, “…not accurate”,
“…not attractive”, “…boring”, “…careful”, “…selfish”) with a 5-point scale reaching from “totally
disagree” to “totally agree”. After deleting the items “I think that this person is rough” and “I think that
this person is boring” a reliability analysis gave a Cronbach’s Alpha of 0.79. A sum of the score on
the remaining ten items gave the score on the prototype favorability, with a high score representing
a high favorability. The maximum score was 50 points.
With the question “How similar are you to such a person?” the prototype similarity was measured
with another 5-point scale ranging from “Not similar at all” to “Totally similar”. The score on this
question measured the prototype similarity. The more similar the respondent feels, the higher the
out coming score (maximum score of 5 points).
Willingness was assessed by letting the respondent imagine a risk situation (“Image you are at a
party with some friends and you would have already drunken five glasses of alcohol. Then someone
would offer you a glass of alcohol.”) and letting him judge the probability of four reactions (“Would
you… …take the drink and drink it”, “…take the drink without drinking it but only to put it down
somewhere”, “…go away (e.g. to the toilet)”, “…say ‘No, thanks’ and deny the drink”) with a 5-point
scale from “certainly not” to “certainly well” (Cronbach’s Alpha = 0.77). By summarizing the score on
this item the willingness of the respondent was assessed, whereas again a high score indicates a
high willingness. The maximum score that could have been reached was 20 points.
One scale with nine items dealt with alcohol expectancies. Respondents were asked to indicate
on a 5-point scale (“totally applies” to “totally not applies”) to what extent ten statements about
alcohol consumption apply. The statements were for the AEQ (Brown et al., 1980, 1987): “When I
10
celebrate special occasions”, “Drinking makes me feel good”, “A few drinks make it easier to talk to
people”, “A few drinks make me feel less shy”, “When I am drinking I feel freer to be myself and do
whatever I want”, “If I am tense or anxious, having a few drinks makes me feel better”, “Drinking
makes get together more fun”, “After a few drinks I am usually in a better mood”. After deleting the
item “Drinking makes me feel good”, a Cronbach’s Alpha of 0.77 was reached. The rating of the
remaining eight statements was summarized so that an overall score with a maximum of 40 points
on the alcohol expectancy scale resulted, whereas a high score indicates more positive alcohol
expectancies.
The last three questions were about social norms in peer groups. Each contained three
questions with one being about the people the respondents go clubbing with, one about the friends
of the respondents and one about the classmates, fellow students or colleagues respectively. First,
the descriptive norm was assessed by asking “How many of your people you go clubbing with
(respectively “your friends”/”your classmates, fellow students, colleagues”) drink more than six
glasses of alcohol at least once per week?”. Possible answers ranged on a 5-point scale from
“nearly no one” to “nearly everyone” (Cronbach’s Alpha = 0.85).
Second, social pressure to drink was assessed by asking “How often do you have the feeling
that the people you go clubbing with (respectively “your friends”/”your classmates, fellow students,
colleagues”) want you to drink more than six glasses of alcohol per occasion at least once per
week?”, with a 5-point scale ranging from “Never” to “Very often” (Cronbach’s Alpha = 0.89).
Finally, social pressure not to drink was asked with “The people I go clubbing with (”my
friends”/”my classmates, fellow students, colleagues”) think I should not drink more than six glasses
of alcohol per occasion at least once per week”, again with a 5-point scale reaching from
“Absolutely applies” to “Absolutely not applies” (Cronbach’s Alpha = 0.922). To get the overall score
on the social norms scale the score on the three questions was summarized. Again a high score,
11
Procedure
47 paper-based surveys were given to a Gymnasium in Dülmen and filled in by upper school
(11th and 12th grade) pupils in their classroom. Furthermore an online version of this survey had
been created. Via an internet platform for students (www.studivz.de) a message to 100 adolescents
living or born in Dülmen was sent. It contained the link to the survey and an explanation that this
survey will be used for a bachelor thesis on alcohol consumption of adolescents. Participation was
voluntary and anonymous without any kind of gratification. This added another 64 filled in surveys.
Statistical analysis
To decide whether to use a parametric or a non parametric test to test differences between the
measured scores on statistical significance, one has to check whether these scores follow a normal
distribution. A One-Sample Kolmogorov-Smirnov Test revealed that the scores on the questions
regarding the amount of alcohol consumption do not follow a normal distribution (days of alcohol
consumption during the week: Z = 3.17, p < 0.001; glasses during the week: Z = 2.48, p < 0.001;
days of consumption on weekend: Z = 3.24, p < 0.001; glasses on weekend: Z = 1.96, p < 0.001;
frequency of binge drinking in past four weeks: Z = 1.45, p < 0.05). Thus differences between the
means of the scores on the alcohol consumption questions will be tested with a non parametric test.
A second One-Sample Kolmogorov-Smirnov Test done with the scores of the measured scales
showed that scores on the alcohol expectancy scale (Z = 0.83, p > 0.40), scores on the social norm
scale (Z = 1.02, p > 0.20), scores on the willingness scale (Z = 0.97, p > 0.20) and scores on the
prototype favorability scale (Z = 1.34, p > 0.05) follow a normal distribution (if one handles an alpha
of 0.05). Thus differences between the means on these scales will be tested with an Independent
Samples T-Test. For testing differences in the prototype similarity scale a non parametric test will be
taken, because the One-Sample Kolmogorov-Smirnov Test revealed that these scores do not follow
12
Results
Alcohol Consumption
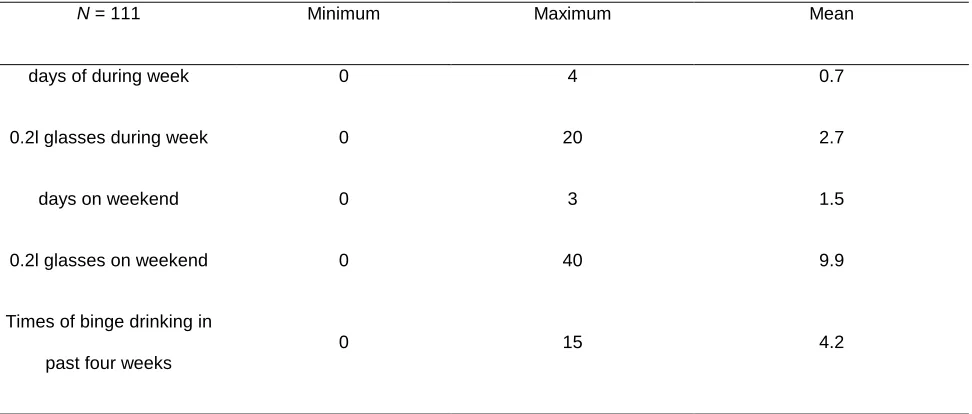
Overall alcohol consumption of the sample will be reported first. The alcohol consumption in the
week ranged from ‘0 days’ to ‘4 days’ with an average of 0.7 days of alcohol consumption between
Monday and Thursday. The respondents stated to drink about 2.7 glasses of alcohol on average
ranging from ‘0 glasses’ to ‘20 glasses’ during the week. Alcohol consumption on weekend (Friday
to Sunday) ranged from ‘0 days’ to ‘3 days’ with an average of 1.5 days of alcohol consumption. The
amount was clearly higher and ranged from ‘0 glasses’ to ’40 glasses’ with an average of ‘9.9
glasses’ of alcohol on weekend. Binge drinking behavior ranged from ‘0 times’ to ’15 times’ of binge
[image:12.595.60.546.422.629.2]drinking during the past four weeks with an average of ‘4.2 times’.
Table 1. Alcohol consumption of the sample
N = 111 Minimum Maximum Mean
days of during week 0 4 0.7
0.2l glasses during week 0 20 2.7
days on weekend 0 3 1.5
0.2l glasses on weekend 0 40 9.9
Times of binge drinking in past four weeks
0 15 4.2
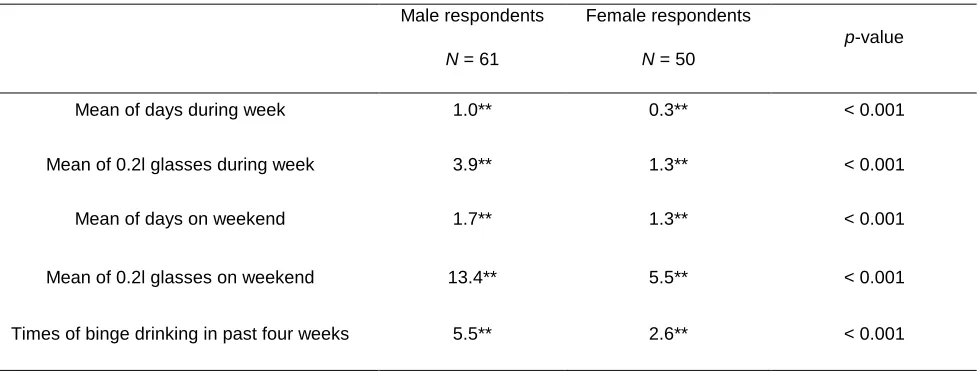
Gender differences in the alcohol consumption
Gender differences in the alcohol consumption were revealed. The average alcohol consumption
13
consumption on weekend was 13.4 glasses of alcohol. Their frequency of binge drinking behavior in
the past four weeks had an average of 5.5 times. The female respondents had an average alcohol
consumption of 1.3 glasses of alcohol during the week, 5.5 glasses of alcohol on weekend and a
binge drinking frequency of 2.6 days in the past four weeks.
Differences of the scores on the questions regarding the amount of alcohol consumption were
statistically significant. A Mann-Whitney Test on the differences in the days of alcohol consumption
during the week gave U = 4.83, p < 0.001, in the amount of standard glasses during the week gave
U = 3.94 and p < 0.001, in the days of alcohol consumption on weekend gave U = 3.52 and p <
0.001, in the amount of standard glasses during the week gave U = 6.60 and p < 0.001 and in
[image:13.595.58.547.365.553.2]frequency of binge drinking in the past four weeks gave U = 4.82 and p < 0.001.
Table 2. Gender differences in alcohol consumption
Male respondents
N = 61
Female respondents
N = 50
p-value
Mean of days during week 1.0** 0.3** < 0.001 Mean of 0.2l glasses during week 3.9** 1.3** < 0.001
Mean of days on weekend 1.7** 1.3** < 0.001
Mean of 0.2l glasses on weekend 13.4** 5.5** < 0.001 Times of binge drinking in past four weeks 5.5** 2.6** < 0.001
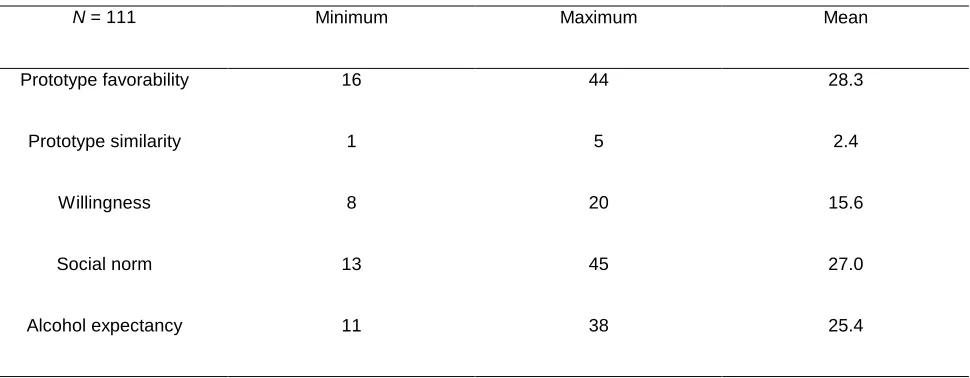
Gender differences in the social cognitions
The means of the whole sample on prototype favorability, prototype similarity, willingness,
alcohol expectancies and social norms have been calculated. Prototype favorability reached with a
possible maximum of 50 points from 16 to 44 points and had a mean of 28.3 points. Prototype
similarity reached with a possible maximum of 5 points from 1 point to 5 points and had a mean of
14
mean of 15.6 points. Alcohol expectancy had a possible maximum of 40 points and reached from 11
to 38 points and had a mean of 25.4 points. Finally score on the social norms with a possible
[image:14.595.60.545.177.366.2]maximum score of 45 points reached from 13 to 45 points and had a mean of 27.0 points.
Table 3. Scores of the sample on the social cognitions
N = 111 Minimum Maximum Mean
Prototype favorability 16 44 28.3
Prototype similarity 1 5 2.4
Willingness 8 20 15.6
Social norm 13 45 27.0
Alcohol expectancy 11 38 25.4
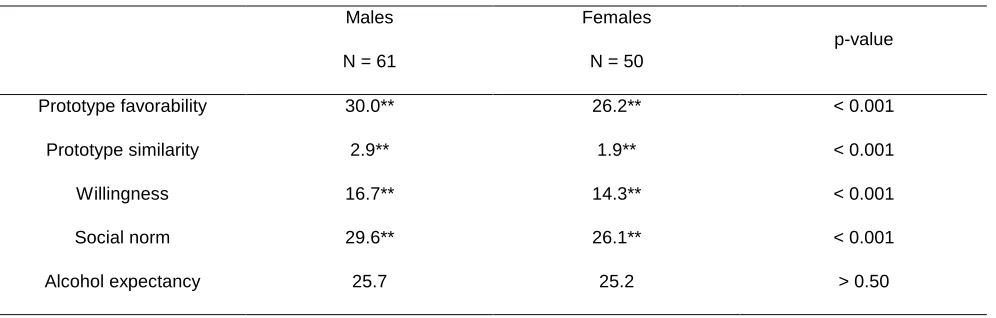
Again differences between the genders were revealed, this time regarding the scores on the
social cognitions. Male respondents had a mean of 30.0 points on prototype favorability, a mean of
2.9 points on prototype similarity, a mean of 16.7 points on willingness and a mean of 29.6 points on
social norms, whereas the female respondents had a mean of 26.1 points on prototype favorability,
a mean of 1.9 points on prototype similarity, a mean of 14.3 points on willingness and a mean of
24.0 points on social norms only. The score on the alcohol expectancy scale with a mean of 25.2
points for the female and a mean of 25.7 points for the male respondents formed the only exception
to the rule that the male score clearly higher than the female respondents.
Differences between the genders in the mean scores on the prototype favorability scale, the
willingness scale, the prototype similarity scale and the social norm scale are statistically significant.
An Independent Samples T-Test gave T (109) = 4.65, p < 0.001 and a 95% confidence interval of a
difference between 2.3 points and 5.7 points on the prototype favorability scale, T (109) = 4.65, p <
0.001 and a 95% confidence interval of a difference between 1.4 points and 3.4 points, T (109) =
15
Mann-Whitney Test done with the prototype similarity scale gave U = 4.45 and p < 0.001. Mean
differences in the alcohol expectancy scale were not statistically significant as the Independent
[image:15.595.51.549.177.336.2]Samples T-Test gave T (109) = 0.64 and p > 0.5.
Table 4. Gender differences on the social cognitions
Males N = 61
Females N = 50
p-value
Prototype favorability 30.0** 26.2** < 0.001
Prototype similarity 2.9** 1.9** < 0.001
Willingness 16.7** 14.3** < 0.001
Social norm 29.6** 26.1** < 0.001
Alcohol expectancy 25.7 25.2 > 0.50
Differences between frequent and occasional binge drinkers
Having been engaged in binge drinking behavior in the last four weeks ranged in this sample
from 0 to 15 times. 52 respondents (46.8%) stated to have been engaged in binge drinking nil to
three times in the past four weeks. This means that these respondents do not engage in binge
drinking very often (at least not once per week on average) and could be classified as occasional
binge drinkers. The other 59 respondents (53.2%) stated to have been engaged in binge drinking
four or more times in the past four weeks. This means that they are engaged in binge drinking more
often (minimum one time per week on average) and could be classified as frequent binge drinkers.
Differences of the means on the social cognition scales between respondents, who stated to
engage in binge drinking behavior at least once per week and respondents, who stated to engage in
binge drinking behavior less than every week are worth a closer look. The mean score of the
occasional binge drinkers on the prototype favorability was 26.7 points, 1.7 points on the prototype
similarity, 14.3 points on willingness, 24.1 points on alcohol expectancy and 23.8 points on social
16
prototype favorability was 29.8 points, 3.1 on prototype similarity, 16.8 points on willingness, 26.7 on
[image:16.595.61.544.152.310.2]alcohol expectancy and 29.9 points on social norm.
Table 5. Differences between frequent and occasional binge drinkers
Occasional binge drinkers
N = 52
Frequent binge drinkers
N = 59
p-values
Prototype favorability 26.7** 29.8** < 0.001
Prototype similarity 1.7** 3.1** < 0.001
Willingness 14.3** 16.8** < 0.001
Alcohol expectancy 23.8** 29.0** < 0.001
Social norm 24.1** 26.7** < 0.001
Differences between frequent binge drinkers and occasional binge drinkers are statistical
significant. An Independent Samples T-Test was done with the differences of the means of the
scores on the prototype favorability scale, willingness scale, social norm scale and alcohol
expectancy scale. Differences on the prototype favorability scale gave T (109) = 3.48, p < 0.001 and
a 95% confidence interval of a difference between 1.4 points and 4.9 points. Differences on the
willingness scale gave T (109) = 5.09, p < 0.001 and a 95% confidence interval of a difference
between 1.6 points and 3.6 points. Differences on the social norm scale gave T (109) = 5.16, p <
0.001 and 95% confidence interval of a difference between 3.8 points and 8.5 points. Finally
differences on the alcohol expectancy scale gave T (109) = 3.13, p < 0.001 and a 95% confidence
interval of a difference between 1.0 points and 4.3 points. A Mann-Whitney Test was done with
differences of the means of the scores on the similarity scale. The result was U = 6.387, p < 0.001.
Correlation
Correlation between the social cognition scales are interesting to look at. Correlations of the
social cognition scales under each other are all significant at the two-tailed 0.01 level. Prototype
17
.323), significant with alcohol expectancy (r = .252) and significant with social norm (r = .471).
Prototype similarity correlates significant with willingness (r = .545), significant with alcohol
expectancy (r =.398) and significant with social norm (r = .431). Willingness correlates significant
with alcohol expectancy (r = .221) and with social norm (r = .303). Finally alcohol expectancy
correlates significant with social norm (r = .336). These significant correlations mean that a high
score on one of these scales goes along with a high score on all the other scales.
Frequency of binge drinking behavior in the past four weeks correlates strongly with the
measured scales as well. All correlations are significant at the two-tailed 0.01 level. Binge drinking
in the past four weeks correlates significant with prototype favorability (r =.372), significant with
prototype similarity (r = .652), significant with willingness (r = .432), significant with alcohol
expectancy (r = .337) and significant with social norm (r = .437). Frequent binge drinkers would
have scored high on ‘frequency of binge drinking in past four weeks’ and according to these
correlations would have scored high on the prototype similarity scale, high on the prototype
favorability scale, high on the willingness scale, high on the alcohol expectancy scale and high on
[image:17.595.49.543.493.665.2]the social norm scale.
Table 6. Correlations of the social cognitions
N = 111 Prototype
favorability
Prototype
similarity Willingness Social norm
Alcohol expectancy Prototype
similarity .406**
Willingness .323** .545**
Social norm .471** .431** .303** Alcohol
expectancy .252** .398** .221* .336**
18
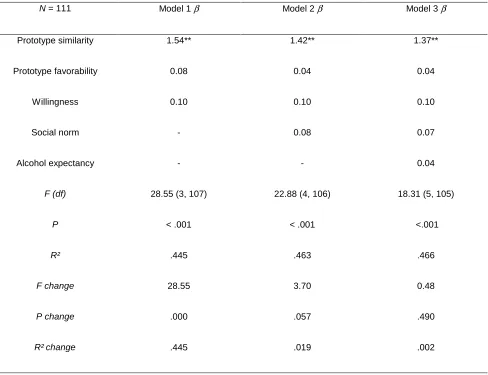
Regression Analysis
With a multiple regression analysis the relation between a dependent variable and several
predictor variables can be tested. In this case binge drinking behavior in the past four weeks is the
dependent variable which one wants to predict with the variables prototype favorability, prototype
similarity, willingness, alcohol expectancy and social norm. Three different models will be tested.
First, a model containing the three variables from the prototype/willingness model is explored with a
regression analysis. The variable prototype similarity is significant (β = 1.54; p < 0.001). Prototype
favorability (β = 0.08; p > 0.1) and willingness (β = 0.10; p > 0.2) are not significant. The proportion
of variance predicted was 44.5% (R² = .445).
Second, a model containing the three variables from the prototype/willingness model and the
social norm is explored. The only significant variable is prototype similarity (β = 1.42; p < 0.001).
The variables social norm (β = 0.08; p > 0.05), prototype favorability (β = 0.04; p > 0.4) and
willingness (β = 0.10; p > 0.3) are not significant. The proportion predicted variance is 46.3% (R² =
.463)
Finally, a model containing all five social cognition variables is tested with a regression analysis.
Again, the only significant variable is prototype similarity (β = 1.37; p < 0.001). The coefficients from
the variables alcohol expectancy (β = 0.04; p > 0.4), social norm (β = 0.07, p > 0.05), prototype
favorability (β = 0.04; p > 0.5) and willingness (β = 0.10; p > 0.3) are not significant. The proportion
19
Table 7. The five social cognitions as predictors of binge drinking behavior
N = 111 Model 1 β Model 2 β Model 3 β
Prototype similarity 1.54** 1.42** 1.37**
Prototype favorability 0.08 0.04 0.04
Willingness 0.10 0.10 0.10
Social norm - 0.08 0.07
Alcohol expectancy - - 0.04
F (df) 28.55 (3, 107) 22.88 (4, 106) 18.31 (5, 105)
P < .001 < .001 <.001
R² .445 .463 .466
F change 28.55 3.70 0.48
P change .000 .057 .490
20
Conclusion and discussion
In line with results of the statistical analysis described above one can draw several conclusions.
Regarding the alcohol consumption one can observe several differences between the male and the
female respondents. First, the male respondents consume alcohol more often on days during the
week, as well as on days at weekend than the female respondents. Second, the male respondents
consume more standard glasses of alcohol during the week and more standard glasses of alcohol
on weekend than the female respondents. Finally, the male respondents engage in binge drinking
behavior more often than the female respondents. Thus seem male respondents to drink alcohol
more often and in bigger amounts than female respondents.
Along with the male respondents consuming more alcohol, they score higher on the social
cognitions measured. Male respondents score higher on the prototype favorability scale, the
prototype similarity scale, the willingness scale and the social norm scale. The only exception is the
alcohol expectancy scale, where no significant differences between the genders could be observed.
Thus do male respondents seem to have a higher prototype similarity, higher prototype favorability,
a stronger willingness and feel more social pressure to engage in alcohol consumption or binge
drinking. The alcohol expectancy seems to be the same for male and for female alcohol drinkers.
But gender does not seem to be the only factor influencing binge drinking behavior. Frequent
binge drinkers, which were defined in this sample as people who engaged in binge drinking
behavior at least four times in the past four weeks, score higher on the prototype favorability scale,
the prototype similarity scale, the willingness scale, the alcohol expectancy scale and the social
norm scale. Thus is there a strong relation between health threatening alcohol consumption like
binge drinking and the concepts prototype favorability, prototype similarity, willingness, social norm
and alcohol expectancy.
Taken together one can predict 46.6% of the variance in binge drinking behavior with the
21
norm, whereas the prototype/willingness model concepts prototype favorability, prototype similarity
and willingness alone are able to predict 44.5% of the variance.
Health risk behavior of adolescents in Dülmen
Aim of this study was to explain health risk behavior like binge drinking of adolescents from
Dülmen in Germany with a combination of the Prototype/willingness model (Gibbons, 1995), alcohol
expectancy (Brown et al., 1980) and social norm (Ajzen, 1985). According to the results and the
conclusions presented above one can say that especially the Prototype/willingness model seems to
be applicable for adolescents from Dülmen. The combination of the prototype/willingness model
with alcohol expectancy and social norm adds only a negligibly amount of predicted variance.
Discussion
Unfortunately this research has several limitations. The sample chosen consisted exclusively of
higher educated people like students or grammar school people. Because of this one cannot tell
whether the used health risk behavior models are able to predict behavior of all adolescents in
Dülmen or only from higher educated ones.
The instrument used had to be created because a survey containing questions to alcohol
consumption, binge drinking behavior, prototype favorability, prototype similarity, willingness, social
norm and alcohol expectancy was not available. Questions regarding alcohol expectancy were
taken out of the Alcohol Expectancy Questionnaire (Brown et al., 1980) which consists out of 90
items. In the survey used in this research is chosen for only ten out of these 90 items, because it
should not take too long for the respondents to fill it in. Questions regarding the
prototype/willingness model and social norm were taken out of surveys used in earlier researches
22
that the reliability and validity of the used survey is proper but this is not guaranteed and remains
questionable.
In the introduction Wechsler’s definition for binge drinking has been given as the ‘consumption of
five or more drinks on one occasion’. In the questionnaire used binge drinking behavior was
measured with asking “How often did you drink MORE THAN SIX standard glasses of alcohol per
occasion in the past four weeks?”. Thus is there a difference of one glass between the original
binge drinking concept created by Wechsler in 1992 and the binge drinking concept measured in
this research.
A difference between frequent and occasional binge drinkers was made in this research. One
has to keep in mind that this categorization was made arbitrary without any scientific justification
from research, but simply because binge drinking on average once per week seems to be so
frequent, that it becomes health threatening for sure.
Despite these limitations of this research the results one got and the conclusions one could draw
were interesting and challenge further investigation of the binge drinking phenomenon and the
23
References:
Ajzen, I. (1985). From intentions to actions: A theory of planned behavior. In J. Kuhl & J. Beckman
(Eds.), Action control: From cognition to behavior (pp. 11-39). Berlin, Germany:
Springer-Verlag.
Bandura, A. (1977). Self-efficacy: toward a unifying theory of behavioral change. Psychological
Review, 84, 191–215.
Bellentani, S. (1997). Drinking habits as cofactors of risk for alcohol induced liver damage. GUT, 41,
845-850.
Brown, S.A., Goldman, M.S. & Christiansen, B.A. (1985). Do alcohol mediate drinking patterns of
adults? Journal of Consulting and Clinical Psychology, 53, 512-519.
Cantor, N., & Mischel, W. (1979). Prototypicality and personality: Effects on free recall and
personality impressions. Journal of Research in Personality, 13, 187–205.
Chassin, L.A., Tetzloff, C., & Hershey, M. (1985). Self-image and social-image factors in adolescent
alcohol use. Journal of Studies on Alcohol, 46, 39–47.
Cialdini, R.B., Reno, R.R., & Kallgren, C.A. (1990). A focus theory of normative conduct: Recycling
the concept of norms to reduce littering in public places. Journal of Personality and Social
Psychology, 58, 1015–1026.
Erikson, E. H. (1963), Childhood and society. New York: Norton.
Fishbein, M., & Ajzen, I. (1980). Predicting and understanding consumer behavior: Attitude-behavior
correspondence. In I. Ajzen & M. Fishbein (Eds.), Understanding attitudes and predicting
24
Fisher, W.A., Fisher, J.D., & Rye, B.J. (1995). Understanding and promoting AIDS-preventive
behavior: Insights from the theory of reasoned action. Health Psychology, 14, 255-264.
Gerrard, M., Gibbons, F.X., Houlihan, A.E., Stock, M.L., & Pomery, E.A. (2008). A dual-process
approach to health risk decision making: The prototype willingness model. Developmental
Review, 28, 29-61.
Gibbons, F.X., & Gerrard, M. (1995). Predicting young adults‘ health risk behavior. Journal of
Personality and Social Psychology, 69, No. 3, 505-517.
Gibbons, F.X., Gerrard, M., & Boney McCoy, S. (1995). Prototype perception predicts (lack of)
pregnancy prevention. Personality and Social Psychology Bulletin, 21, 85-93.
Gibbons, F. X., Helweg-Larsen, M., & Gerrard, M. (1995). Prevalence estimates and adolescent risk
behavior: Cross-cultural differences in social influence. Journal of Applied Psychology, 80,
107–121.
Godin, G., & Kok, G. (1996). The Theory of Planned Behavior: A Review of its Applications to
Health-Related Behaviors. American Journal of Health Promotion 11, No. 2, 87-98.
Hingson, R. (2005). Magnitude of alcohol-related mortality and morbidity among U.S. college
students ages 18-24: changes from 1998 to 2001. Public Health, 26, 259-79.
Jones, B.T., Corbin, W., & Fromme, K. (2001). A review of expectancy theory and alcohol
consumption. Addiction, 96, 57–72.
Kuller, L.H., May, S.J., & Perper, J.A. (1978). The Relationship between alcohol, liver disease, and
testicular pathology. American Journal of Epidemiology, 108 No. 3, 192-199.
Leigh, B.C. (1989). In search of the seven dwarves: Issues of measurement and meaning in alcohol
25
Leventhal, H., & Cleary, P. D. (1980). The smoking problem: A review of the research and theory in
behavioral risk modification. Psychological Bulletin, 88, 370–405.
Naimi, T.S., Brewer, R.D., & Mokdad, A. (2003). Binge drinking among US adults. JAMA, 289 No. 1,
70-75.
Oei, T.P., Foley, J., & Young, R. McD. (1990) The in-vivo manipulation of alcohol-related beliefs in
male social drinkers in a naturalistic setting. British Journal of Medical Psychology, 63, 279–
286.
Orcutt, J. D. (1991). Social integration of beers and peers: Situational contingencies in drinking and
intoxication. In D. J. Pitmann, & H. R. White (Eds.), Society, culture, and drinking patterns
reexamined: Alcohol culture and social control. Monograph Series (pp. 198–215). New
Brunswick, NJ: Rutgers Center for Alcohol Studies.
Perkins, H. W. (1985). Religious traditions, parents, and peers as determinants of alcohol and drug
use among college students. Review of Religious Research, 27, 15–31.
Perkins, H. W., & Wechsler, H. (1996). Variation in perceived college drinking norms and its impact
on alcohol abuse: A nationwide survey. Journal of Drug Issues, 26, 961–974.
Setterlund, M.B., & Niedenthal, P.M. (1993). ‘‘Who am I? Why am I here?” Self-esteem, self-clarity,
and prototype matching. Journal of Personality and Social Psychology, 65, 769–780.
Stacy, A. W., Newcomb, M. D., & Bender, P. M. ( 1991 ). Cognitive motivation and drug use: A
9-year longitudinal study. Journal of Abnormal Psychology, 100, 502-515.
Wechsler, H. & Isaac, N. (1992). ‘Binge’ drinkers at Massachusetss colleges. Prevalence, drinking
26
Ybarra, O., & Trafimow, D. (1998). How priming the private self or collective self affects the relative
weights of attitudes or subjective norms. Personality and Social Psychology Bulletin, 24,


![Working towards telecom 2000: launching the programme Race [R&D in Advanced Communication Technololgies in Europe]. COM (88) 240 final/2, 31 May 1988](data:image/gif;base64,R0lGODlhAQABAIAAAP///wAAACH5BAEAAAAALAAAAAABAAEAAAICRAEAOw==)