Supervisory control for power management of an islanded
AC microgrid using frequency signalling-based fuzzy logic
controller
ALBADWAWI, Rashid, ISSA, Walid <http://orcid.org/0000-0001-9450-5197>,
ABUSARA, Mohammad and TAPAS, Mallick
Available from Sheffield Hallam University Research Archive (SHURA) at:
http://shura.shu.ac.uk/21002/
This document is the author deposited version. You are advised to consult the
publisher's version if you wish to cite from it.
Published version
ALBADWAWI, Rashid, ISSA, Walid, ABUSARA, Mohammad and TAPAS, Mallick
(2018). Supervisory control for power management of an islanded AC microgrid
using frequency signalling-based fuzzy logic controller. IEEE Transactions on
Sustainable Energy.
Copyright and re-use policy
See
http://shura.shu.ac.uk/information.html
Sheffield Hallam University Research Archive
Abstract-- In islanded AC microgrids consisting of renewable
energy sources (RES), battery-based energy storage system (BESS), and loads, the BESS balances the difference between the RES power and loads by delivering/absorbing that difference. However, the state of charge (SOC) and charging/discharging power of the battery should be kept within their design limits regardless of variations in the load demand or the intermittent power of the RES. In this paper, a supervisory controller based on fuzzy logic is proposed to assure that the battery power and energy do not exceed their design limits and maintaining a stable power flow. The microgrid considered in this paper consists of a PV, battery, load and auxiliary supplementary unit. The fuzzy logic controller alters the AC bus frequency, which is used by the local controllers of the parallel units to curtail the power generated by the PV or to supplement the power from the auxiliary unit. The proposed FLC performance is verified by simulation and experimental results.
Index Terms-- energy management, energy storage, fuzzy
logic, microgrid, renewable energy sources, supervisory control.
I. ABBREVIATIONS
BESS Battery Energy Storage System DG Distributed Generator
ESS Energy Storage System FLC Fuzzy Logic Controller
MPPT Maximum Power Point Tracking PLL Phase Looked Loop
PV Photovoltaic
RES Renewable Energy Sources SOC State of Charge
μGT Micro Gas Turbine
II. INTRODUCTION
nergy management systems have multi-objective functions that need to deal with various technical, commercial and environmental issues. Hierarchical control
The work was financially supported by the Government of Oman, which provides a PhD grant for Rashid Al Badwawi. Also, the work was supported by EPSRC-DST funded project: Reliable and Efficient System for Community Energy Solutions (RESCUES- EP/K03619X/1).
R. AlBadwawi, T. Mallick and M. Abusara are with the Environment and Sustainability Institute, University of Exeter, Penryn Campus, Penryn, TR10
9FE, UK. ([email protected]; [email protected];
W. Issa is with Sheffield Hallam University, Sheaf building, Sheffield, S1 1WB, UK.
schemes for handling such issues have been proposed and widely used as acceptable standard solutions for efficient microgrid management [1], [2]. The supervisory control/energy management system architectures in microgrid can be either centralized, decentralized or even hybrid (centralized and decentralized system) [1]–[4]. In order to have a proper continuous energy management between generation units and connected loads, such management is done by a centralized control system with communication between the different units [5], [6]. This is definitely not practical in most conventional power systems especially with the increase of the power system size [7]. It adds extra cost and complexity in controlling the overall power system. Furthermore, the communication affects the expandability of the power system [8]. The design of an effective coordination strategy becomes a challenging task if communication between different units is not used because there will be neither a central energy management system nor a direct interaction between the different units. On the other hand, decentralized control strategies for managing PV and battery units in droop controlled microgrids are not thoroughly explored in the literature [9], [10]. Traditionally, the energy management system for an island microgrid relies on batteries or energy storage systems (ESS) in general to absorb surplus power from renewable energy sources (RES) once tracking their maximum power points (MPPs) independently [11]. However, considerable surplus energy can be left unutilized as a result of running hybrid renewable energy systems, which can cause overcharging/damage to the batteries [12].
In an islanded AC microgrid with a wind turbine, battery bank and load in [13], the terminal voltage of the battery, as an indirect control of the state of charge (SOC), is maintained within the maximum limit. This is achieved by a frequency bus-signalling technique to limit the generated power whenever needed. A frequency bus-signalling technique of ESS is also used in [14] to manage an islanded AC microgrid with a PV, ESS and load. It is achieved by mapping AC bus frequency with estimated SOC. A primary frequency signalling is used in [15] as well along with a droop control method in order to change modes of operations of a RES and ESS, in an islanded AC microgrid, between power and voltage control modes. The frequency-based energy-management strategy in [16] has been developed for multiple batteries without wired communication between distributed
Supervisory Control for Power Management of
an Islanded AC Microgrid Using Frequency
Signalling-Based Fuzzy Logic Controller
Rashid AlBadwawi,
Senior Member, IEEE
, Walid Issa, Tapas Mallick, and Mohammad Abusara
inverters. The power is transferred from the fully charged/discharged battery to the one with less charging/discharging power without the limitation of the RES power. Noncritical loads are regulated/disconnected or the system stops when the frequency is low. F. Tidjani et al. [17] proposed a fuzzy logic based energy management in stand-alone mode to manage the power between the battery, gas generator and PV. It also took in consideration the battery power and SOC. However, to prevent the battery overcharging, they used a water pump as a dummy load. This solution is not applicable in all cases of power as the pump has one set of rating values.
The aforementioned references for power management strategies with frequency bus-signalling technique use conventional controllers such as Proportional-Integral (PI) controller for power management. No intelligent or artificial methods have been used with that technique where the non-uniform nature of powers requires kind of intelligent controller. Furthermore, some of the literature work emphasized the power management issues without bringing any constrains to some of the energy elements as the battery power maximum limits. Also, managing different modes of DG units (voltage/current sources) within some constrains has not been fully resolved yet and research into obtaining optimal operational modes continues to increase [18]. Non-conventional type of control such as fuzzy logic controller (FLC) could be an excellent candidate for this.
In this paper, a FLC is proposed to manage an islanded AC microgrid with a PV, Battery-based ESS (BESS) and micro gas turbine units. It prevents the battery SOC and charging/ discharging power from exceeding their limits regardless of the variation in the load and intermittent power generated by the RES. It is worth mentioning here that the focus of the study is only on the islanded mode of the microgrid. The main contributions can be emphasized when the microgrid is islanded. In grid-connected mode, each unit behaves differently without having the same concerns which this paper addresses. However, smoothing the grid power profile needs to handle the same challenges as in [19], [20]. By varying the AC bus frequency that is used by local droop controllers; the FLC, located in the BESS, is implemented without the need for any communication links between the microgrid units. The FLC decides whether to curtail the power generated by the PV or to supplement the power from the auxiliary unit. To assess the performance of the proposed controller, a validation has been carried out using Matlab simulation and experimentally. Usually, diesel generators or gas turbines are used as the main sources which dictates the AC bus. However, the auxiliary unit (micro gas turbine) here is floating and hence it provides power via the FLC command whenever needed (low power from RES and/or low SOC). This can be performed without using any communication between the different generation units and loads. The supervisory controller is implemented wirelessly using the bus frequency for the AC microgrid. The paper covers the design of a droop control which enables the auxiliary unit to respond automatically to the change in the bus frequency, so it supplies power only when the frequency is
reduced below its nominal value and the amount of deviation of the frequency determines the amount of power to be supplied by the auxiliary unit. Therefore, the main contributions of the paper are as follows.
1) Development of an energy management system for an islanded microgrid that is based on the combination of Fuzzy Logic and bus-signalling. The supervisory controller can be implemented wirelessly using the bus frequency of the AC microgrid.
2) Assessment of the proposed system performance in meeting the design requirements and considering the constrains of the battery maximum power and SOC. 3) The proposed system aims to decrease auxiliary unit
run time and then the cost while satisfying the load demand and the battery needs.
4) Real time simulation and experimental validation of the proposed controller under different scenarios of operation and a comparison with a traditional controller.
The paper is organized as follows. Section II gives system overview and Section III shows droop control strategy. In Section IV, the proposed FLC is described. Section V provides real-time simulation results. Section VI shows experimental results. Finally, Section VII gives the conclusion.
III. SYSTEM OVERVIEW
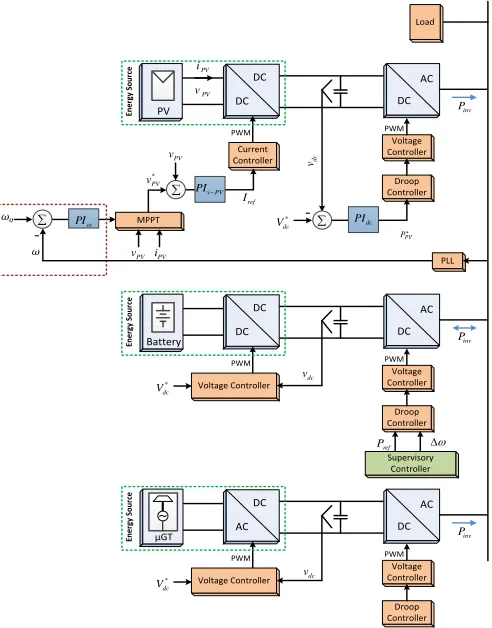
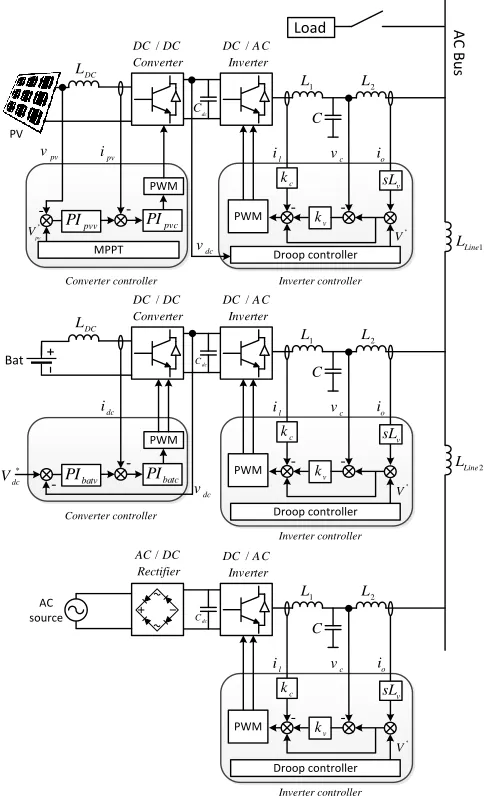
In an island AC microgrid with BESS and RES, the BESS is used as a grid forming unit regulating the AC bus, while the RES is used as a grid feeding unit injecting the power into the system [14], [21]. The proposed stand-alone AC microgrid control topology is shown in Fig. 1 and it operates as follows.
1) PV unit is interfaced by a uni-directional DC/DC converter and a DC/AC inverter. The converter controls the PV output voltage to achieve maximum power point tracking (MPPT) while the inverter regulates the DC link voltage. The PV output power is curtailed if the battery is fully charged and the available PV power is higher than that required by the load. 2) BESS unit is interfaced by a bi-directional DC/DC
converter and a DC/AC inverter. The converter regulates the DC link voltage. The inverter is the master unit that maintains and controls the AC bus frequency and voltage of the microgrid. It alters the bus frequency according to FLC command. The BESS unit forms the AC bus by controlling the local AC voltage and frequency. The BESS absorbs surplus power from the PV unit if it exceeds the load. In the same way, the BESS supply required power when there is a shortage from the PV unit that can’t meet the load requirement. 3) Auxiliary unit (micro gas turbine in this case) is
Battery
DC DC
Voltage Controller PWM
dc
v
AC DC
Voltage Controller
Droop Controller PWM
inv
P
ref
P
DC DC
Current Controller PWM
dc
v
AC DC
Voltage Controller
Droop Controller PWM
dc
PI
-*
dc
V
inv
P
v PV
PI *
PV
v
ref
I
MPPT
PV
v
PV
v iPV
PV
PV
v
PV
i
En
er
gy
S
o
u
rc
e
En
er
gy
S
o
u
rc
e
µGT
DC AC
Voltage Controller PWM
dc
v
AC DC
Voltage Controller
Droop Controller PWM
inv
P
En
er
gy
S
o
u
rc
e
*
dc
V
*
dc
V
- PI
PLL
Supervisory Controller
Load
𝑃𝑃𝑉∗ 𝜔𝑜
[image:4.612.51.297.51.365.2]𝜔
Fig. 1. Proposed stand-alone AC microgrid control topology.
Droop control [22], [23] is used in all the three DC/AC inverters as a frequency responsive technique. The details of power management based on droop control and bus frequency signalling techniques will be discussed in the next section. It is important to note that the supervisory control just requires to communicate with the BESS to manage the microgrid powers.
IV. DROOP CONTROL STRATEGY
Frequency and voltage drooping techniques are applied to generators in a microgrid to have load sharing of parallel generators. With droop control in AC systems, decentralized control for each converter is achieved with no communication or only low bandwidth communication, such as power line communication [24]. Any DC/AC inverter in a traditional droop control does have an output frequency 𝜔 and a voltage amplitude 𝑉 defined by (1) and (2), respectively [25].
𝜔 = 𝜔𝑜− 𝑚(𝑃 − 𝑃∗) (1)
𝑉 = 𝑉𝑜− 𝑛(𝑄 − 𝑄∗) (2)
where 𝜔𝑜, 𝑉𝑜, 𝑚, and 𝑛 are the nominal frequency, nominal
voltage, frequency drooping coefficient, and voltage drooping coefficient, respectively. 𝑃 and 𝑄 are the measured average active and reactive powers while 𝑃∗and 𝑄∗ are the active and
reactive power demands or set-points, respectively.
The same droop control equation as in (2) defines the reactive power/voltage relation of the three DC/AC inverters. As the BESS regulates the AC bus frequency, the droop
coefficient of the battery unit 𝑚 is set to zero. Thus, the BESS power can be delivered/absorbed by the battery depending on the demand and excess power. To achieve this functionality, the bus frequency is varied either positively or negatively by
∆𝜔 which is the output from the FLC. The frequency increment allows curtailment of the PV power and the decrement determines the power of the auxiliary unit. Thus, the output frequency of the battery unit is given by (3).
𝜔 = 𝜔𝑜+ ∆𝜔 (3)
The droop control of the PV unit is given by (4) where 𝑃𝑝𝑣∗
is the PV power demand (see Fig. 1). The 𝑃𝑝𝑣∗ is given by (5)
where 𝑉𝑑𝑐 and 𝑉𝑑𝑐∗ are the DC link voltage and its set-point
value. 𝑘𝑝−𝑑𝑐 and 𝑘𝑖−𝑑𝑐are the PI controller gains of the PV
DC voltage regulator and ‘s’ is the Laplace operator.
𝜔 = 𝜔𝑜− 𝑚𝑝𝑣(𝑃𝑝𝑣− 𝑃𝑝𝑣∗) (4)
𝑃𝑝𝑣∗ = (𝑘𝑝−𝑑𝑐+ 𝑘𝑖−𝑑𝑐
𝑠 )(𝑉𝑑𝑐− 𝑉𝑑𝑐
∗) (5)
The droop control of the auxiliary unit is given by (6). The power set-point 𝑃𝑎𝑢𝑥∗ is set to zero in the island microgrid to
supplement power automatically in response to change in the bus frequency.
𝜔 = 𝜔𝑜− 𝑚𝑎𝑢𝑥(𝑃𝑎𝑢𝑥− 𝑃𝑎𝑢𝑥∗ ) (6)
PV
Battery
P Varied by MPPT
𝜔 = 𝜔𝑜− 𝑚𝑎𝑢𝑥(𝑃 − 𝑃𝑎𝑢𝑥∗ )
∆𝜔𝑚𝑎𝑥 +
∆𝜔𝑚𝑎𝑥 −
𝑃 = 𝑃𝑃𝑉 𝜔 = 𝜔𝑜
𝜔
𝑚𝑃𝑉
𝑚𝑎𝑢𝑥
𝜔 = 𝜔𝑜− 𝑚𝑃𝑉(𝑃 − 𝑃𝑃𝑉∗)
Auxiliary unit (aux)
Fig. 2. Power – frequency droop control curves.
Maximum Power Point (MPP)
PV v PV
P
Lower Power
OC v MPP v MPP
P vOC
MPP v
(a) (b)
PV v
ω
ωmax
ωo
[image:4.612.308.561.372.717.2]Fig. 2 shows the power/frequency droop control for the three units [25] based on (3), (4) and (6). When the bus frequency is shifted up, the PV power is curtailed. On the other hand, the auxiliary unit produces power when the frequency is shifted down. The output power P of the PV unit equals the demanded power 𝑃𝑝𝑣∗ when the bus frequency 𝜔
equals the nominal frequency 𝜔𝑜. If the bus frequency is
shifted up, this will send a message to the MPPT controller to curtail the PV power. Phase Looked Loop (PLL) is used by the MPPT controller to measure the bus frequency (see Fig. 1) and it shifts the MPP to a lower value by increasing the PV output voltage as shown in Fig. 3. If the bus frequency is shifted down, the DC/AC inverter of the PV unit will deliver power limited by its maximum power determined by the MPPT [25], [26].
V. PROPOSED FUZZY LOGIC CONTROLLER
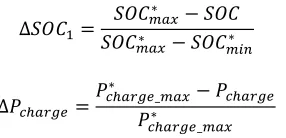
Fuzzy logic is designed with several IF and THEN rules based on human knowledge and experience. It could be appropriate option for complex systems like microgrid with different types of inputs, variables and disturbances in particular if they are connected or supplied through RES. The proposed FLC is responsible for varying the bus frequency and is shown in Fig. 4. It consists of two subsystems. The top subsystem is responsible for preventing the battery from overcharging and its charging power from exceeding its limit. The inputs for this subsystem are ∆𝑆𝑂𝐶1 and ∆𝑃𝑐ℎ𝑎𝑟𝑔𝑒 which
are given by (7) and (8), respectively.
∆𝑆𝑂𝐶1=
𝑆𝑂𝐶𝑚𝑎𝑥∗ − 𝑆𝑂𝐶
𝑆𝑂𝐶𝑚𝑎𝑥∗ − 𝑆𝑂𝐶𝑚𝑖𝑛∗
(7)
∆𝑃𝑐ℎ𝑎𝑟𝑔𝑒 =
𝑃𝑐ℎ𝑎𝑟𝑔𝑒_𝑚𝑎𝑥∗ − 𝑃𝑐ℎ𝑎𝑟𝑔𝑒
𝑃𝑐ℎ𝑎𝑟𝑔𝑒_𝑚𝑎𝑥∗
(8)
where 𝑆𝑂𝐶 is the current state of charge and 𝑆𝑂𝐶𝑚𝑎𝑥∗ is its
maximum value. 𝑃𝑐ℎ𝑎𝑟𝑔𝑒is charging power and 𝑃𝑐ℎ𝑎𝑟𝑔𝑒_𝑚𝑎𝑥∗ is
its maximum charging power value. The output is a positive shift in the frequency ∆𝜔+. As this controller is implemented
in the BESS, the bus frequency will deviate to a new frequency. In response to that the PV power can be curtailed.
On the other hand, the bottom FLC subsystem is responsible for preventing the battery from over-discharging and the battery discharging power from exceeding its limit. The inputs for this subsystem are ∆𝑆𝑂𝐶2 and ∆𝑃𝑑𝑖𝑠𝑐ℎ𝑎𝑟𝑔𝑒
which are given by (9) and (10), respectively.
∆𝑆𝑂𝐶2=
𝑆𝑂𝐶 − 𝑆𝑂𝐶𝑚𝑖𝑛∗
𝑆𝑂𝐶𝑚𝑖𝑛+10%∗ − 𝑆𝑂𝐶𝑚𝑖𝑛∗
(9)
∆𝑃𝑑𝑖𝑠𝑐ℎ𝑎𝑟𝑔𝑒=
𝑃𝑑𝑖𝑠𝑐ℎ𝑎𝑟𝑔𝑒_𝑚𝑎𝑥∗ − 𝑃𝑑𝑖𝑠𝑐ℎ𝑎𝑟𝑔𝑒
𝑃𝑑𝑖𝑠𝑐ℎ𝑎𝑟𝑔𝑒_𝑚𝑎𝑥∗
(10)
where 𝑆𝑂𝐶𝑚𝑖𝑛∗ is the 𝑆𝑂𝐶 minimum value and 𝑆𝑂𝐶𝑚𝑖𝑑+10%∗ is
the 𝑆𝑂𝐶 minimum value plus 10%. 𝑃𝑑𝑖𝑠𝑐ℎ𝑎𝑟𝑔𝑒is discharging
power and 𝑃𝑑𝑖𝑠𝑐ℎ𝑎𝑟𝑔𝑒_𝑚𝑎𝑥∗ is its maximum discharging power
value. The output is a negative shift in the frequency ∆𝜔−
which deviates the bus frequency causing the auxiliary unit to supplement power.
The two FLC subsystems work simultaneously. Therefore, the shift of frequency ∆𝜔 is the result of ∆𝜔+ and ∆𝜔− as
given by (11) where the top and bottom FLC subsystems are responsible for protection from charging and over-discharging respectively. The limit for the frequency deviation is set as ± 1% of the nominal value (50Hz). This provides a variation in the frequency between 49.5Hz and 50.5Hz. The change in frequency occurs automatically based on the results from the two FLC subsystems. It is important to note that the PV curtailment wouldn’t happen if the auxiliary unit is generating power.
∆𝜔 = ∆𝜔+−∆𝜔− (11)
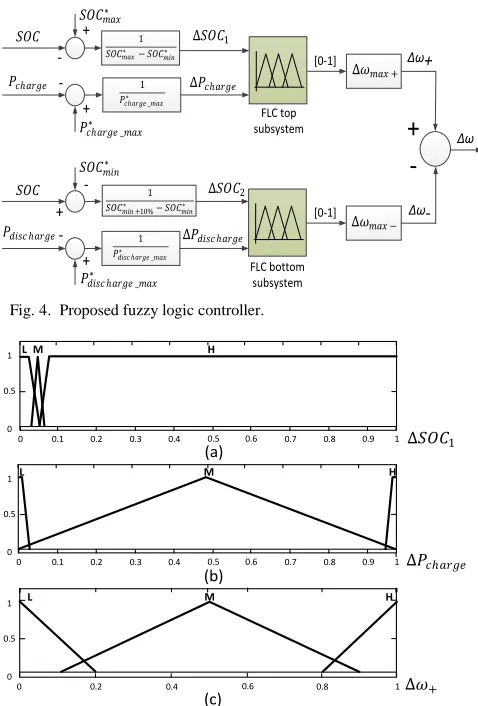
The membership functions of the top and bottom FLCs are shown in Fig. 5 and Fig. 6, respectively. The two FLC subsystems have different shapes/combinations to satisfy the need of the design requirements over different ranges of values in terms of inputs and control outputs [26]. The top FLC subsystem 𝑆𝑂𝐶 range value is between 𝑆𝑂𝐶𝑚𝑎𝑥∗ and
𝑆𝑂𝐶𝑚𝑖𝑛∗ . On the other hand, the bottom FLC subsystem should
not work for ∆𝑆𝑂𝐶2 value more than 10% which represents
the difference between 𝑆𝑂𝐶𝑚𝑖𝑛+10%∗ and 𝑆𝑂𝐶𝑚𝑖𝑛∗ . The terms L,
M and H denote Low, Medium and High membership functions, respectively. The High ‘H’ fuzzy set denotes that the charging is far away from 𝑃𝑐ℎ𝑎𝑟𝑔𝑒_𝑚𝑎𝑥∗ which is not a
design concern, so it has been chosen between 0.1 and 1 of Fig. 5(a) to ensure curtailment of the PV power starts for 𝑆𝑂𝐶
value more than 91%, i.e. cases L and M. Similarly in Fig. 5(b), M set is chosen to cover the majority of the range to ensure that the PV power is not wasted by early curtailment before needed. Table I and Table II show the rules for the FLC top subsystem and bottom subsystem, respectively. The rules are changed along with the changes in membership functions during design stage to assess the performance of the stand-alone microgrid and modifications are done accordingly as per the need.
TABLEI
RULES OF TOP FLC
∆𝜔+ ∆𝑃𝑐ℎ𝑎𝑟𝑔𝑒
L M H
∆𝑆𝑂𝐶1
L H H L
M M M M
H H L L
TABLEII
RULES OF BOTTOM FLC
∆𝜔− ∆𝑃𝑑𝑖𝑠𝑐ℎ𝑎𝑟𝑔𝑒
L M H
∆𝑆𝑂𝐶2
L H H H
M H M M
[image:5.612.87.230.403.472.2]Δω+
Δω
-Δω
+
-+
+
+
-+
∆𝑆𝑂𝐶1
∆𝑃𝑐ℎ𝑎𝑟𝑔𝑒
𝑃𝑐ℎ𝑎𝑟𝑔𝑒 _𝑚𝑎𝑥∗
∆𝑆𝑂𝐶2
∆𝑃𝑑𝑖𝑠𝑐 ℎ𝑎𝑟𝑔𝑒
𝑃𝑑𝑖𝑠𝑐 ℎ𝑎𝑟𝑔𝑒 _𝑚𝑎𝑥∗
𝑆𝑂𝐶
𝑆𝑂𝐶
𝑆𝑂𝐶𝑚𝑎𝑥∗
𝑆𝑂𝐶𝑚𝑖𝑛∗
[0-1]
[0-1]
1 𝑆𝑂𝐶𝑚𝑎𝑥∗ − 𝑆𝑂𝐶𝑚𝑖𝑛∗
1 𝑃𝑑𝑖𝑠𝑐 ℎ𝑎𝑟𝑔𝑒 _𝑚𝑎𝑥∗
1 𝑃𝑐ℎ𝑎𝑟𝑔𝑒 _𝑚𝑎𝑥∗
𝑃𝑐ℎ𝑎𝑟𝑔𝑒
𝑃𝑑𝑖𝑠𝑐 ℎ𝑎𝑟𝑔𝑒
∆𝜔𝑚𝑎𝑥 +
∆𝜔𝑚𝑎𝑥 −
FLC top subsystem
FLC bottom subsystem
[image:6.612.55.294.48.401.2]1 𝑆𝑂𝐶𝑚𝑖𝑛 +10%∗ − 𝑆𝑂𝐶𝑚𝑖𝑛∗
Fig. 4. Proposed fuzzy logic controller.
(a)
(c)
0.1 0.2 0.3 0.4 0.5 0.6 0.7 0.8 0.9 1
0 1
0.5
0
L M H
0.1 0.2 0.3 0.4 0.5 0.6 0.7 0.8 0.9 1
0 1
0.5
0
L M H
0 0.4 0.6 0.8 1
1
0.5
0
L M H
(b)
0.2
∆𝑆𝑂𝐶1
∆𝑃𝑐ℎ𝑎𝑟𝑔𝑒
[image:6.612.58.293.438.616.2]∆𝜔+
Fig. 5. Membership functions of top FLC: (a) Input ∆𝑆𝑂𝐶1 (b) Input ∆𝑃𝑐ℎ𝑎𝑟𝑔𝑒
(c) Output ∆𝜔+.
(a)
(c)
(b)
0.1 0.2 0.3 0.4 0.5 0.6 0.7 0.8 0.9 1 0
1
0.5
0
L M H
1
0.5
0
L M H
0 0.4 0.6 0.8 1
1
0.5
0
L M H
0.1 0.2 0.3 0.4 0.5 0.6 0.7 0.8 0.9 1 0
0.2
∆𝑆𝑂𝐶2
∆𝑃𝑑𝑖𝑠 𝑐ℎ𝑎𝑟𝑔𝑒
∆𝜔−
Fig. 6. Membership functions of bottom FLC: (a) Input ∆𝑆𝑂𝐶2 (b) Input
∆𝑃𝑑𝑖𝑠𝑐ℎ𝑎𝑟𝑔𝑒 (c) Output ∆𝜔−.
VI. REAL-TIME SIMULATION RESULTS
A real-time simulator can emulate the actual performance of a system or controller. This does avoid the need for building the whole actual system at full capacity [27], [28]. The robustness of the system can be assessed by whether the controller can meet the design requirement with the existence of diverse uncertainty in the generation and the load powers.
The design requirements of interest are the charging/discharging maximum power, the SOC and optimum µGT running.
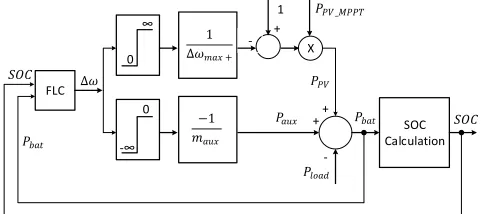
A simplified model of the AC microgrid consists of a PV, battery and auxiliary units along with the proposed controllers has been developed and built in Matlab/Simulink and Fuzzy Logic tool boxes using RT-LAB (real-time simulator). The purpose of this simulation is to assess the performance of the FLC in keeping the battery power and SOC within their limits. Each unit in the simplified model is represented only by its droop controller as the power steady state values are the concern. The PV unit will produce maximum possible power according to its MPPT as long as the bus frequency 𝜔 equals or less than the nominal frequency 𝜔𝑜. However, if the bus
frequency is increased above the nominal frequency, then the power is curtailed. Therefore, the PV power is given by (12). The auxiliary unit will only produce power if the bus frequency dropped below the nominal frequency. The power produced by the auxiliary unit (𝑃𝑎𝑢𝑥) based on (6) is given by
(13).
𝑃𝑃𝑉= 𝑃𝑃𝑉_𝑀𝑃𝑃𝑇(1 − ∆𝜔
∆𝜔𝑚𝑎𝑥+) , 0 ≤ ∆𝜔 ≤ ∆𝜔𝑚𝑎𝑥+ (12)
𝑃𝑎𝑢𝑥 = ∆𝜔
𝑚𝑎𝑢𝑥, ∆𝜔𝑚𝑎𝑥− ≤ ∆𝜔 < 0
(13)
where 𝑃𝑃𝑉_𝑀𝑃𝑃𝑇 is the maximum power tracking point of the
PV power. ∆𝜔, ∆𝜔𝑚𝑎𝑥+ and ∆𝜔𝑚𝑎𝑥− are the bus frequency
deviation/variation, its maximum positive and maximum negative deviation values, respectively.
SOC calculation has been carried out as in [7] based on coulomb counting principle. The simplified simulation model is as shown in Fig. 7. Solar radiation is recorded at the Environment and Sustainability Institute (ESI) roof in Penryn Campus at Penryn, UK. Fig. 8 shows 12 hours duration of actual solar radiation recorded on 25th October 2015, which is
used for real-time simulation. However, the solar radiation profile is multiplied by a factor of 4 to have higher values for simulation assuming larger PV area. Many simulation cases have been conducted and sample results are shown as follows. The system parameters used in the simulation are shown in Table III.
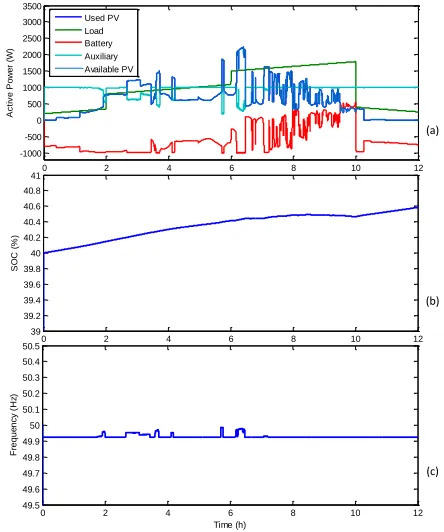
in Fig. 9(a) and the battery is not really used much as per the FLC command since the priority is given for full utilization of PV power and the SOC is high. However, whenever there is a need for extra power to meet the load, the battery is supplying that extra power and this can be easily observed from t=9.5h onwards. The auxiliary unit is not used at all throughout the simulation since the PV and SOC of the battery are sufficient to cope with the load. The charging/discharging power is maintained within its limit. Fig. 9(b) shows that the SOC remains almost constant and it is prevented from exceeding its maximum limit. Fig.9(c) shows the frequency curve where the frequency is maintained within its limits as well irrespective of the changes in the load or the PV generation.
The second scenario describes the case when the battery has a low SOC with initial value equals to the minimum limit value (40%). However, this time the load profile is multiplied by a factor of 4 to have higher values for simulation with similar trend and the rest remains the same. This helps in having a wide range of load to check the performance of the FLC. In this scenario, most of the time, the available PV power is lower than the load profile which means there is more need for support from the battery and auxiliary unit. Fig. 10(a) shows the power output along with the load power. The FLC has the decision to run the auxiliary unit to provide power to charge the battery and to supply the load if the PV power is low. After the first half an hour, the PV starts generating power. Since the SOC value is low, the battery is straight away in charging mode using the auxiliary unit to avoid possible decline of the SOC value to a value less than the SOC minimum allowable limit (40%). The auxiliary unit is floating throughout the simulation period and providing the required power as per the FLC command. It is obvious that the maximum charging/discharging power of the battery is well preserved within the maximum allowable limit (1000W) throughout the full period of the simulation. Fig. 10(b) shows the SOC curve which reflects good performance towards increasing the SOC regardless of the generation and demand variations. The battery is mostly in charging mode. Fig. 10(c) shows that frequency is maintained within its limits as well.
Due to the limitations of the practical implementation, the real-time simulation has been used to validate the performance of high power rating systems and for long time periods. The next section describes practical results of short periods with low power rating systems but covering very different scenarios. FLC -∞ 0 ∞ 0 −1 𝑚𝑎𝑢𝑥 1 ∆𝜔𝑚𝑎𝑥 +
1 + - X -+ + 𝑃𝑃𝑉 𝑃𝑙𝑜𝑎𝑑
𝑃𝑎𝑢𝑥 SOC
Calculation ∆𝜔 𝑃𝑏𝑎𝑡 𝑆𝑂𝐶 𝑃𝑏𝑎𝑡 𝑃𝑃𝑉_𝑀𝑃𝑃𝑇 𝑆𝑂𝐶
[image:7.612.54.295.607.714.2]Fig. 7 Simplified simulation model.
Fig. 8. Solar radiation.
TABLEIII
SIMULATED SYSTEM PARAMETERS
Parameter Symbol Value
PV power rating 𝑃𝑝𝑣 2230W
Auxiliary power rating 𝑃𝑎𝑢𝑥 1000W
Battery capacity Cbat, 100Ah
Battery voltage Vbat, 120V
Maximum state of charge 𝑆𝑂𝐶𝑚𝑎𝑥∗ 95%
Minimum state of charge plus 10% 𝑆𝑂𝐶𝑚𝑖𝑛+10%∗ 50%
Minimum state of charge 𝑆𝑂𝐶𝑚𝑖𝑛∗ 40%
Maximum charging power 𝑃𝑐ℎ𝑎𝑟𝑔𝑒_𝑚𝑎𝑥∗ 1000W
Maximum discharging power 𝑃𝑑𝑖𝑠𝑐ℎ𝑎𝑟𝑔𝑒_𝑚𝑎𝑥∗ 1000W
Nominal bus frequency 𝜔𝑜 314.16rad/s
Active power droop coefficients mpv, maux 0.75e-4 rad/s/W
Reactive power droop coefficients n 0.75e-4 V/Var
VII. EXPERIMENTAL RESULTS
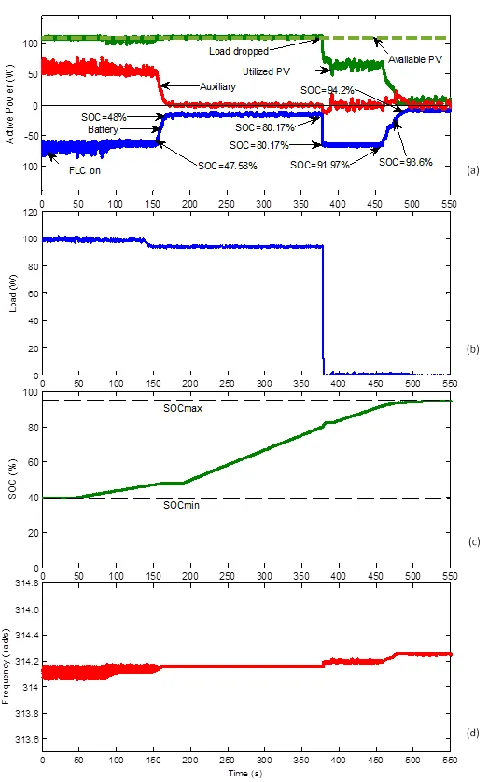
A single phase microgrid consisting of three units as illustrated in Fig. 11 has been built in the laboratory. A bank of lead-acid batteries and a PV simulator are used. An AC voltage source is used to represent the micro gas turbine alternator. A bi-directional DC/DC converter is used to interface the battery and a uni-directional boost converter with the MPPT controller used to interface the PV simulator. The AC source representing the micro gas turbine is interfaced by an AC/DC rectifier. One DC/AC inverter is used for each generation units. The control algorithms have been realized by an OPAL-RT real time simulator. A picture of the practical setup is shown in Fig. 12. The parameters of the system and controllers are shown in Table IV. Fig. 13 shows the case when a fixed PV power is available over the time of the experiment. The initial SOC value is 40%. Fig. 13(a) shows the experimental output power responses of the PV, battery and auxiliary units while load power is shown in Fig. 13(b). The PV generation is slightly higher than the load and the battery needs to be charged. Therefore, the auxiliary unit is used to charge the battery at its maximum charging power of 70W since the SOC is low. Once the SOC becomes around 47.58% at about 165s in Fig. 13(c), the auxiliary unit is almost stopped as per the FLC command since the PV can supply the whole load and the SOC level is not critical. This saves the cost of running the auxiliary unit while still satisfying the system needs. A battery charging current multiplier of 100k to 500k is used to speed up the increase in the SOC in order to decrease the time required for the experiment, but this does
not affect the results’ dynamics in terms of the behavior or the decision of the FLC. At around 378s, the load is dropped to zero and the PV power is curtailed to keep the charging power within the limit of 70W. When the SOC becomes higher than 91%, the PV power is curtailed even more to maintain the SOC below its maximum limit of 95%. Thanks to the FLC, the SOC is maintained between the minimum (40%) and maximum (95%) allowable limits as can be seen in Fig. 13(c). The frequency is maintained within its limits as shown in Fig. 13(d). On occasions, the PV output voltage signal, used by the PLL, is not a pure sinewave since it has some distortions/harmonics. Therefore, the high frequency variations in the power and frequency responses represent noise which comes from the measurements of the bus frequency. This could be treated by an appropriate filter in non-laboratory installations if the auxiliary unit cannot cope with high frequency actuations. The high frequency variations do not have any implication on the controller’s performance within the microgrid, since the control loops of the microgrid are slow in comparison to the noise and such noise probably will not appear if units with larger capacities are used. This scenario validates the capability of FLC in keeping the SOC and charging power within their desired limits.
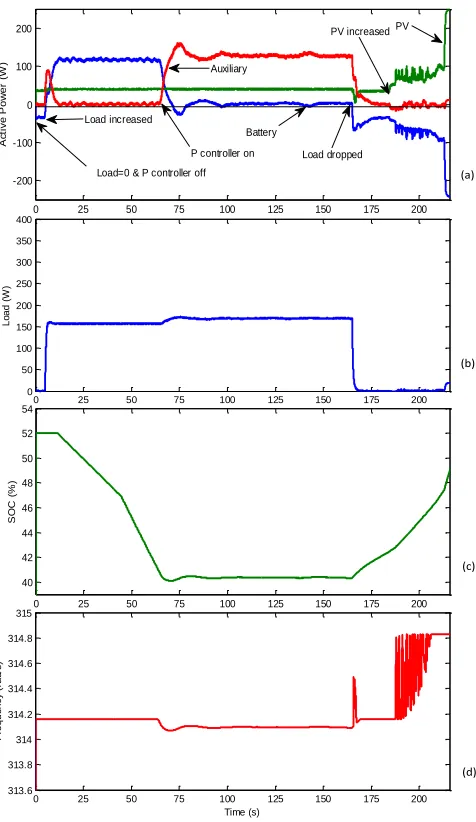
Fig. 14 shows a discharging scenario for the battery with an initial SOC value of 51%. Fig. 14(a) shows the experimental output power responses of the PV, battery and auxiliary units along with the load power in Fig. 14(b). The FLC is initially not activated and no load is connected to the system. The PV generation is around 30W which is absorbed completely to charge the battery. The load is then applied and the battery starts supplying the power demand shortage as the PV power is not enough. After t=50s, the FLC is activated and the auxiliary unit starts providing power according to the drop in bus frequency shown in Fig. 14(d). At around t=100s when the SOC drops to 47.19%, the battery contribution is gradually reduced to about 35W while the auxiliary unit contribution is gradually increased. At around t=250s, the SOC reaches a critical value of 42.98% as seen in Fig. 14(c) and consequently the battery stops discharging while the auxiliary unit provides 150W which is the difference between the PV and load powers. This way, the minimum SOC limit is preserved. At t=370s, the load is fully disconnected and consequently the power output of the auxiliary unit is reduced by the FLC to around 30W only as it is enough for the PV power to charge the battery at its maximum limit. At t= 440s, PV power is increased, but it is curtailed to keep the charging limited. In addition, the auxiliary unit is almost stopped by the FLC as the PV power is sufficient. At t= 470s, the load is re-connected and the FLC stops the curtailment to utilize more PV power for the new load without running the auxiliary unit.
Fig. 9. Output response for 94.9% SOC case: (a) power (b) frequency (c) SOC.
Fig. 10. Output responses for 40% SOC case and high load: (a) power (b) frequency (c) SOC.
0 2 4 6 8 10 12
-500 0 500 1000 1500 2000 2500
Time (h)
A
c
ti
v
e
P
o
w
e
r
(W
)
Used PV Load Battery Auxiliary Available PV
(c) (b) (a)
0 2 4 6 8 10 12
93 93.5 94 94.5 95 95.5 96
Time (h)
S
O
C
(
%
)
0 2 4 6 8 10 12
49.6 49.8 50 50.2 50.4 50.6
Time (h)
F
re
q
u
e
n
cy
(
H
z)
0 2 4 6 8 10 12
-1000 -500 0 500 1000 1500 2000 2500 3000 3500
Time (h)
A
c
ti
v
e
P
o
w
e
r
(W
)
Used PV Load Battery Auxiliary Available PV
(c) (b) (a)
0 2 4 6 8 10 12
39 39.2 39.4 39.6 39.8 40 40.2 40.4 40.6 40.8 41
Time (h)
S
O
C
(
%
)
0 2 4 6 8 10 12
49.5 49.6 49.7 49.8 49.9 50 50.1 50.2 50.3 50.4 50.5
Time (h)
F
re
q
u
e
n
cy
(
H
[image:8.612.324.548.52.324.2] [image:8.612.327.549.361.627.2]- -Bat PWM * dc V dc C v k c k v sL * V l i vc
1
L L2
C Converter controller DC L / DC DC Converter / DC AC Inverter batc PI batv PI -dc i dc v Inverter controller PWM - -PWM * pv V v k c k v sL * V l i vc
1
L L2
C Converter controller DC L / DC DC Converter / DC AC Inverter pvc PI pvv PI -pv i pv v Inverter controller PWM dc C
MPPT Droop controller
Droop controller - -dc C v k c k v sL * V l i vc
1
L L2
[image:9.612.52.294.55.455.2]C / AC DC Rectifier / DC AC Inverter Inverter controller PWM Droop controller dc v o i o i o i PV AC source Load A C B u s 1 Line L 2 Line L
Fig. 11. The microgrid prototype schematic diagram.
OPAL- RT Real Time Simulator Inverters DC/DC Converters Resistive Load Programmable Load Programmable PV Simulator Inverters Filters and Sensors Battery bank Inductive Load Isolation Transformer AC Variac Switches Circuit Breakers Box DC/DC Converters Sensors PWM Generation Boxes Small Power Box
Fig. 12. The microgrid prototype experimental setup.
TABLEIV
EXPERIMENTAL SETUP PARAMETERS
Inverters parameters PV current controller
Inverter-side
filter inductor 𝐿1 4mH
P-controller
gain 𝑘𝑝_𝑝𝑣𝑐 0.05
Filter
capacitor 𝐶 25μF
I-controller
gain 𝑘𝑖_𝑝𝑣𝑐 1
Grid-side
filter inductor 𝐿2 2mH Inverter voltage controller
Nominal
output voltage 𝑉𝑜 120V
Voltage
controller gain 𝑘𝑣 0.01
Nominal
frequency 𝜔𝑜 314.16 rad/s controller gain Current 𝑘𝑐 3
DC-link
capacitor 𝐶𝑑𝑐 1100μF
Virtual
inductor 𝐿𝑣 8mH
Line1
inductor 𝐿𝑙𝑖𝑛𝑒11mH Droop controller
Line2
inductor 𝐿𝐿𝑖𝑛𝑒22mH
Frequency drooping coefficient 𝑚 1 × 10⁻³ rad/s/ W Switching
frequency 𝑓𝑠𝑤 10kHz
Voltage drooping coefficient
𝑛 0.05
V/Var
DC/DC Converters Power measuring filter
Converter
inductor 𝐿𝐷𝐶 0.8mH
Cut-off
frequency 𝜔𝑐 2rad/s
Battery
voltage 𝑉𝑏𝑎𝑡 125V PV DC voltage regulator
PV output
voltage 𝑉𝑝𝑣 110V
P-controller
gain 𝑘𝑝−𝑑𝑐 20
Battery current controller I-controller
gain 𝑘𝑖−𝑑𝑐 2
P-controller
gain 𝑘𝑝_𝑏𝑎𝑡𝑐
5
× 10−3 Nominal DC-link voltage 𝑉𝑑𝑐 200V
I-controller
gain 𝑘𝑖_𝑏𝑎𝑡𝑐 1 State of charge limits
Battery voltage controller Max. SOC 𝑆𝑂𝐶𝑚𝑎𝑥∗ 95%
P-controller
gain 𝑘𝑝_𝑏𝑎𝑡𝑣1.5 Min. SOC 𝑆𝑂𝐶𝑚𝑖𝑛∗ 40%
I-controller
gain 𝑘𝑖_𝑏𝑎𝑡𝑣 50 Max. charging/ discharging power
PV voltage controller Max. charging
power 𝑃𝐶ℎ𝑎𝑟𝑔𝑒_𝑚𝑎𝑥∗ 70W
P-controller
gain 𝑘𝑝_𝑝𝑣𝑣 10 Max.
discharging power
𝑃𝐷𝑖𝑠𝑐ℎ𝑎𝑟𝑔𝑒_𝑚𝑎𝑥∗ 150W
I-controller
gain 𝑘𝑖_𝑝𝑣𝑣 250
[image:9.612.50.297.485.671.2]decision until it becomes zero at around 42s since the PV can supply the whole load although the SOC level is not very high in comparison to the situation at the beginning of the experiment. Similar to the case with the FLC, a battery charging current multiplier is used to speed up the increase in the value of the SOC, which reduces the time required for the experience. At around 315s, the load is dropped to zero and the PV power is curtailed to keep the charging power within the limit which is 70W. The SOC has exceeded the maximum allowable limit (95%) towards the end of the experiment as can be seen in Fig. 15(c) unlike the case with the FLC in Fig. 13(c) where the SOC is limited to the 95% limit. The frequency is maintained within its limits as can be seen from Fig. 15(d), but with more oscillations in comparison with the case of the FLC shown in Fig. 13(d). Although the P controller provides similar responses like the FLC, however, it is very clear from this case that the FLC is performing better than the P controller in terms of maintaining the limits required.
Fig. 13. Experimental output responses for 40% to 95% SOC case: (a) power (b) load (c) SOC (d) frequency.
Fig. 14. Experimental output responses for 51% SOC case: (a) power (b) load (c) SOC (d) frequency.
[image:10.612.52.294.269.660.2]Fig. 15 Experimental output responses for 40% to 95% SOC with proportional controller case: (a) power (b) load (c) SOC (d) Frequency
The proposed controller in the paper assumes an islanded microgrid, which has batteries as energy source and one of the purposes of the FLC is to prevent the battery SOC and charging/discharging power from exceeding their limits regardless of the variation in the load and intermittent power generated by the RES. If there is no battery in the microgrid, there is a need for changing the design of the FLC and amend its inputs/outputs and the rules accordingly. In case the battery is not available, there will be more usage of the micro gas turbine to satisfy the load demand. Also, in case of excess power from the PV, the micro gas turbine is still need to run to stabilize the AC bus and PV power curtailment will be crucial.
VIII. CONCLUSION
A fuzzy logic controller has been proposed for power management of an islanded AC microgrid. The proposed controller combines the FLC and bus-signalling techniques to control the power flow between different energy sources.
Fig. 16 Experimental output responses for 52% SOC with proportional controller case: (a) power, (b) load, (c) SOC, (d) Frequency
By varying the AC bus frequency, within the standards allowance, and making use of local droop controllers, the controller is implemented without any communication links between the microgrid units. The RES unit can properly react to curtail its power when needed and the auxiliary unit is left to float on the AC bus so it reacts instantaneously to frequency variation to supply power. The results showed that the proposed FLC is capable to satisfy the system requirements within the defined constrains. It maintains the SOC and charging/discharging power of the battery within their limits irrespective of the change in RES/load. The performance has been validated by real time simulation and experimentally. The performance of the FLC is superior to the performance when compared to a traditional droop control method (i.e. proportional controller in this case) in achieving the required goals. The proportional controller was not always able to maintain the SOC and charging/discharging power within their design limits.
(a)
(c)
(d) (b)
0 50 100 150 200 250 300 350
-100 -50 0 50 100 150
Time (s)
A
c
ti
ve
P
o
w
e
r
(W
)
Battery
SOC=41.05%
SOC=41.9% SOC=80.2%
Utilized PV Available PV
Load dropped
Auxiliary
P controller on
0 50 100 150 200 250 300 350
0 20 40 60 80 100 120
Time (s)
L
o
a
d
(
W
)
0 50 100 150 200 250 300 350
0 20 40 60 80 100 120
X: 314.8 Y: 80.21
Time (s)
S
O
C
(
%
)
X: 41.9 Y: 42.33
X: 130 Y: 50.02
X: 31.36 Y: 41.05
SOCmin SOCmax
0 50 100 150 200 250 300 350
313.6 313.8 314 314.2 314.4 314.6 314.8
Time (s)
F
re
q
u
e
n
cy
(
ra
d
/s)
(a)
(c)
(d) (b)
0 25 50 75 100 125 150 175 200
-200 -100 0 100 200
Time (s)
A
c
ti
ve
P
o
w
e
r
(W
)
Load dropped PV
Auxiliary
PV increased
P controller on Load increased
Load=0 & P controller off
Battery
0 25 50 75 100 125 150 175 200
0 50 100 150 200 250 300 350 400
Time (s)
L
o
a
d
(
W
)
0 25 50 75 100 125 150 175 200
40 42 44 46 48 50 52 54
Time (s)
S
O
C
(
%
)
0 25 50 75 100 125 150 175 200
313.6 313.8 314 314.2 314.4 314.6 314.8 315
Time (s)
F
re
q
u
e
n
cy
(
ra
d
[image:11.612.54.295.52.463.2] [image:11.612.318.556.53.464.2]IX. REFERENCES
[1] J. M. Guerrero, J. C. Vasquez, J. Matas, L. G. De Vicuña, and M. Castilla, “Hierarchical control of droop-controlled AC and DC microgrids — A general approach toward standardization,” IEEE Trans.
Ind. Electron., vol. 58, no. 1, pp. 158–172, Jan. 2011.
[2] L. Meng, E. R. Sanseverino, A. Luna, T. Dragicevic, J. C. Vasquez, and J. M. Guerrero, “Microgrid supervisory controllers and energy management systems: A literature review,” Renew. Sustain. Energy Rev., vol. 60, pp. 1263–1273, Jul. 2016.
[3] A. Chauhan and R. P. Saini, “A review on integrated renewable energy system based power generation for stand-alone applications: Configurations, storage options, sizing methodologies and control,”
Renew. Sustain. Energy Rev., vol. 38, pp. 99–120, Jun. 2014.
[4] R. Al Badwawi, W. Issa, T. Mallick, and M. Abusara, “DC microgrid power coordination based on fuzzy logic control,” in 18th European
Conference on Power Electronics and Applications, Karlsruhe,
Germany, 2016, pp. 1–10.
[5] B. Belvedere, M. Bianchi, A. Borghetti, C. A. Nucci, M. Paolone, and A. Peretto, “A Microcontroller-Based Power Management System for Standalone Microgrids With Hybrid Power Supply,” IEEE Trans.
Sustain. Energy, vol. 3, no. 3, pp. 422–431, Jul. 2012.
[6] C. Wang and M. H. Nehrir, “Power management of a stand-alone wind / photovoltaic / fuel cell energy system,” IEEE Trans. Energy Convers., vol. 23, no. 3, pp. 957–967, Sep. 2008.
[7] H. Mahmood and D. Michaelson, “A power management strategy for PV / battery hybrid systems in islanded microgrids,” IEEE J. Emerg. Sel.
Top. Power Electron., vol. 2, no. 4, pp. 1–14, Dec. 2014.
[8] W. Issa, S. Sharkh, T. Mallick, and M. Abusara, “Improved reactive power sharing for parallel-operated inverters in islanded microgrids,” J.
Power Electron., vol. 16, no. 3, pp. 1152–1162, May 2016.
[9] H. Mahmood, “Power management strategies for islanded microgrids,” Ph.D. dissertation, Dep. Elect. Comp. Eng., Univ. of Western Ontario, London, Ontario, Canada, 2015.
[10] W. Issa, A. El Khateb, N. Anani, and M. Abusara, “Smooth mode transfer in AC microgrids during unintentional islanding,” Energy
Procedia, vol. 134, pp. 12–20, Oct. 2017.
[11] W. R. Issa, A. H. El Khateb, M. A. Abusara, and T. K. Mallick, “Control strategy for uninterrupted microgrid mode transfer during unintentional islanding scenarios,” IEEE Trans. Ind. Electron., vol. 65, no. 6, pp. 4831- 4839, Nov. 2017.
[12] M. S. Ismail, M. Moghavvemi, T. M. I. Mahlia, K. M. Muttaqi, and S. Moghavvemi, “Effective utilization of excess energy in standalone hybrid renewable energy systems for improving comfort ability and reducing cost of energy: A review and analysis,” Renew. Sustain. Energy Rev., vol. 42, pp. 726–734, 2015.
[13] J. de Matos, F. e Silva, and L. Ribeiro, “Power control in AC isolated microgrids with renewable energy sources and energy storage systems,”
IEEE Trans. Ind. Electron., vol. 62, no. 6, pp. 3490–3498, Jun. 2015.
[14] D. Wu, F. Tang, T. Dragicevic, J. C. Vasquez, and J. M. Guerrero, “Autonomous active power control for islanded AC microgrids with photovoltaic generation and energy storage system,” IEEE Trans.
Energy Convers., vol. 29, no. 4, pp. 882–892, Dec. 2014.
[15] D. Wu, J. M. Guerrero, J. C. Vasquez, T. Dragicevic, and F. Tang, “Coordinated power control strategy based on primary-frequency-signaling for islanded microgrids,” 2013 IEEE Energy Convers. Congr.
Expo. ECCE 2013, pp. 1033–1038, 2013.
[16] A. Urtasun, E. L. Barrios, P. Sanchis, and L. Marroyo, “Frequency-based energy-management strategy for stand-alone systems with distributed battery storage,” IEEE Trans. Power Electron., vol. 30, no. 9, pp. 4794–4808, Sep. 2015.
[17] F. S. Tidjani, A. Hamadi, A. Chandra, P. Pillay, and A. Ndtoungou, “Optimization of standalone microgrid considering active damping technique and smart power management using fuzzy logic supervisor,”
IEEE Trans. Smart Grid, vol. 8, no. 1, pp. 475–484, Jan. 2017.
[18] A. Mahesh and K. S. Sandhu, “Hybrid wind/photovoltaic energy system developments: Critical review and findings,” Renew. Sustain. Energy Rev., vol. 52, pp. 1135–1147, Aug. 2015.
[19] D. Arcos-Aviles, J. Pascual, L. Marroyo, P. Sanchis, and F. Guinjoan, “Fuzzy logic-based energy management system design for residential grid-connected microgrids,” IEEE Trans. Smart Grid, vol. 9, no. 2, pp. 530–543, Mar. 2018.
[20] T. T. Teo, T. Logenthiran, W. L. Woo, and K. Abidi, “Fuzzy logic control of energy storage system in microgrid operation,” in 2016 IEEE
Innovative Smart Grid Technologies - Asia, 2016, pp. 65–70.
[21] R. AlBadwawi, M. Abusara, and T. Mallick, “A review of hybrid solar PV and wind energy system,” Smart Sci., vol. 3, no. 3, pp. 127–138, Apr. 2015.
[22] W. R. Issa, M. A. Abusara, and S. M. Sharkh, “Control of transient power during unintentional islanding of microgrids,” IEEE Trans.
Power Electron., vol. 30, no. 8, pp. 4573–4584, Aug. 2015.
[23] W. Issa, S. Sharkh, T. Mallick, and M. Abusara, “Improved reactive power sharing for parallel-operated inverters in islanded microgrids,” J.
Power Electron., vol. 16, no. 3, pp. 1152–1162, May 2016.
[24] X. Lu, J. M. Guerrero, K. Sun, J. C. Vasquez, R. Teodorescu, and L. Huang, “Hierarchical control of parallel AC-DC converter interfaces for hybrid microgrids,” IEEE Trans. Smart Grid, pp. 683–692, Jul. 2013. [25] R. Al Badwawi, W. Issa, T. Mallick, and M. Abusara, “Power
management of AC islanded microgrids using fuzzy logic,” in IET International Conference on Power Electronics, Machines and Drives
(PEMD), Glasgow, UK, 2016, pp. 1-6.
[26] R. AlBadwawi, “Supervisory control and power management of an AC microgrid,” Ph.D. dissertation, Dept. Renewable Energy, Univ. of Exeter, Penryn, UK, 2017.
[27] P. Venne, J.-N. Paquin, and J. Belanger, “The what, where and why of real-time simulation,” Power Energy Soc., vol. 1, pp. 37–49, 2010. [28] S. K. Khadem, M. Basu, and M. F. Conlon, “Intelligent islanding and
seamless reconnection technique for microgrid with UPQC,” IEEE J.
Emerg. Sel. Top. Power Electron., vol. 3, no. 2, pp. 483–492, Jun. 2015.
Rashid Al Badwawi received his BEng and MSc
degrees in Electrical and Electronics Engineering from Sultan Qaboos University, Oman, in 1995 and 2001, respectively; and his PhD in Renewable Energy from University of Exeter, UK in 2017. He has broad experience in managing large multi-discipline Oil/Gas projects (Oct. 1995 - Oct. 2005) and electrical power projects (Oct 2005 – now). He is currently working as Projects Panning Advisor at Oman Electricity Transmission Company. His research interests include renewable energy, energy management, microgrids, power electronics and fuzzy logic controller.
Walid R. Issa received his B.Sc. and M.Sc. degrees
in electrical engineering from Islamic University of Gaza (IUG), Palestine, in 2007 and 2011, respectively; and his PhD in Renewable Energy from University of Exeter, UK in 2015. He worked as a teaching assistant at IUG, 2007-2010. He was a lecturer at University College of Applied Science, Palestine, 2009-2011. He is currently a lecturer in Sheffield Hallam University, UK. His main research interests include power electronics, digital control, DC/AC and DC/DC converters and microgrids.
Tapas K. Mallick received the Ph.D. degree from
Ulster University, Coleraine, U.K. in 2003. From 2007 to 2012, he was a Lecturer with Heriot-Watt University, Edinburgh, U.K. He is currently a Professor of renewable energy and Chair in Clean
Technologies with the Environment and
Sustainability Institute of the University of Exeter, Penryn, U.K. His research interests include renewable energies, concentrating photovoltaics, building integrated photovoltaics, integration of renewables, heat transfer, optics, and electrical modeling
Mohammad Abusara received his BEng degree