An examination of the role of service quality and perceived
value in visitor attraction experience
ORIADE, A and SCHOFIELD, Peter <http://orcid.org/0000-0002-9109-7674>
Available from Sheffield Hallam University Research Archive (SHURA) at:
http://shura.shu.ac.uk/23743/
This document is the author deposited version. You are advised to consult the
publisher's version if you wish to cite from it.
Published version
ORIADE, A and SCHOFIELD, Peter (2019). An examination of the role of service
quality and perceived value in visitor attraction experience. Journal of Destination
Marketing and Management, 11, 1-9.
Copyright and re-use policy
See
http://shura.shu.ac.uk/information.html
An examination of the role of service quality and perceived value in
visitor attraction experience
Ade Oriade and Peter Schofield
Abstract
The purpose of this paper is to examine the relationships between service quality, perceived value, satisfaction and behavioural intentions in UK attraction context. Data was collected in the Midlands Region of the UK from two visitor attractions utilising mixed-mode survey approach. A total of 507 usable questionnaires were analysed using ordinary least squares (OLS) multiple regression analysis to examine the relationship between the constructs. The findings confirm the cognitive-affective-conative order between the service constructs within the context of UK visitor attractions. This study has improved the understanding of the role of value in service experience, particularly attraction context, providing evidence that value exerts more influence on satisfaction and behavioural intention. More specifically emotional value exerts more influence on satisfaction and behavioural intention than other forms of value. Managers need to view the visitor experience holistically rather than concentrating on one or two service construct(s).
Key words: Value, Service Quality, Satisfaction, Behavioural Intentions, Attractions
Introduction
The number of studies that have been carried out on quality and satisfaction in tourism and hospitality is indicative of the importance associated with the subject. Researchers have explored service quality in different contexts and relationships between service quality and variables including price, productivity, customer satisfaction, benefits, well-being, profitability and behavioural
intention (Cole et al., 2002; Spinks et al., 2005; Lee et al., 2007; Nowacki, 2009; Zabkar et al., 2010; Wu and Li, 2015; Su, Swanson and Chen, 2016) have also been explored. While much work has been done in other sectors such as retail, hotel and some areas of tourism such as cruise, golf tourism and medical tourism, empirical evidence of the relationship between these variables in the visitor attraction sector has only recently been expanding.
proposed without the inclusion of perceived value (see for instance Zabak et al., 2010). Where it is examined it is often assessed holistically with little attention given to its components parts. McDougall and Levesque (2000) and Duman and Mattila (2005) suggest that perceived value has a significant influence on customer satisfaction. Gallarza and Saura (2006) state that it is imperative this area is explored, particularly in visitor attraction studies, where little work has been done. Equally, little research has assessed the moderating role of various factors associated with perceived value (Lee, Jin and Lee, 2014).
In the light of the discussion above, there is a strong basis for research based upon the theoretical foundations of services marketing and management that empirically investigates attraction visitor experience by examining the relationships between service quality, perceived value, satisfaction and behavioural intentions. This study firstly formulates a model that examines the relationship between service quality, perceived value, visitor satisfaction and behavioural intention. Secondly, it
investigates the role of attraction attributes and compares their effects on service quality and perceived value. Thirdly, it broadens the traditional research perspective on perceived value that focuses only on functional value by including social and emotional value in the investigation. Lastly, it tests the mediating effects of quality, value and satisfaction in the model.
Theoretical background
The Cognitive-Affective-Conative framework is adopted in this article as it offers an integrative model for understanding the relationship between perceptions and behaviour. The framework derives from the hierarchy of effects model (Lavidge and Steiner, 1961) explains that as the
consumer becomes aware of a product and develops knowledge of its constituent components, the service encounter facilitates some sort of evaluations which evokes corresponding attitudes. These attitudes enable the consumer to decide and act. The Cognitive-Affective-Conative framework is considered suitable for this project as it accommodates all the elements (i.e. service quality,
perceived value, visitor satisfaction and behavioural intentions) in attraction visitors experience. It is noted that cognitive response such as perception of quality precede emotional (satisfaction) and conative (behavioural intentions) responses (Chen and Chen, 2010).
Due to the growth in the attraction industry, attraction service providers must compete based on the quality of their products/services since attraction visitors are becoming more discerning and demanding (Swarbrooke, 2001). Quality has a significant role to play in the success or failure of tourism organisations (Ranjbarian and Pool, 2015) including those providing visitor attraction services. The concept of service quality has gained a wide interest in the literature in the past few decades and has been defined variously. Researchers have examined the construct in different contexts and developed different types of measures to help in defining, measuring and improving understanding of the construct. However, the concept has generated much controversy amongst academics particularly whether there is a generic set of dimension applicable to all service sectors (see Parasuraman et al., 1985; 1988).
In the late 1980s and up to the early 1990s, marketing and tourism related literature often
criticised, and as a consequence a more valid measure is likely to be achieved by directly assessing perception of performance of quality attributes. Cole et al. (2002) found that visitor perception of attribute performance positively influenced their perception of service quality. Hence, this discussion leads to the first hypothesis:
H1: Quality is positively related to the performance of the attraction attributes.
Value on the other hand is commonly conceptualized as the trade-off between the multiple benefits consumers receive and the sacrifices they make in acquiring or consuming a product. According to Monroe (1990) perceived benefits are a combination of physical attributes, service attributes and technical support available in relation to a particular use situation. The relationship between attribute performance or level and value is rarely researched in the services context (Patterson and Spreng, 1997). However, several studies have since examined the effect of performance of
product/service attributes on value (e.g. Petterson and Spreng, 1997; Kaenzig, Heinzle and Wustenhagen, 2013; Han, Meng and Kim, 2017), with varying outcomes. Lin (2003) in a product quality study confirmed the linkages between a product's attribute levels and the consumer's perception of value; a significant relationship between product attributes and customer perceived value was found. In a business-to-business, service context, Patterson and Spreng (1997) found all the six performance attributes examined positively related to perceived value. Kaenzig et al. (2013) in an investigation of the relative importance of product attributes in creating customer value equally found a significant relationship. Han et al (2017) using more generic tourism attributes found a significant relationship between perceived value and attributes of bicycle tourism. It is essential to understand if the same condition found in product attributes is applicable to tourism service, particularly visitor attractions.
H2: Value is positively related to the performance of the attraction attributes
Another contention in services management literature is that value is a more complete antecedent to satisfaction than quality (see McDougall and Levesque, 2000 and Gallarza and Saura, 2006). The results of Lee et al’s (2007) empirical investigation of dark visitor attractions in Korea indicated that all underlying dimensions of tourist’s perceived value had a significant effect on satisfaction.
However, Brady et al’s (2001) cross-cultural study of Americans and Ecuadorian fast-food restaurant customers revealed that value-satisfaction relationship will vary from culture to culture. Service value-customer satisfaction path was found applicable in the American context and not applicable to the Ecuadorians. Therefore, this study tests the validity of the perceived value-visitor satisfaction path in the visitor attraction context in the UK through the following hypothesis:
H3: Visitor satisfaction is positively related to the perceived value of the attraction
The impression given by the opposing opinions in the literature indicates no consensus on the causal order of service quality and visitor satisfaction: satisfaction-service quality or service
quality-satisfaction. The weight of evidence supports the service quality-satisfaction order in general services management (see Shamdasani, et al., 2008; Cronin et al., 2000) and in tourism (see Gonzalez, et al., 2007; Zabka et al., 2010).
To this end, the fourth hypothesis in this study is:
Mittal et al. (2001) in a study investigating attribute performance and customer satisfaction over time suggested that future research should focus on understanding why the relationship between attribute performance and overall customer satisfaction is strong or weak in different situations for the same product or for the same customer and over time. Mittal et al. (2001) argued that this is likely to provide better understanding of issues related to attribute performance and satisfaction. It was also noted that the antecedents of these two constructs are likely to be different.
However, a number of studies (e.g. Bojanic, 1996; McDougall and Levesque, 2000) have found that perceived value is a significant driver of customer satisfaction. In a more recent study Han et al., (2017), in bicycle tourism context, found that perceived value completely mediate the relationship between product attributes and satisfaction. This arguably may not be applicable in attraction context. It is therefore important to examine the influence of perceived value in the relationship between satisfaction and attraction attribute performance hence the fifth hypothesis is:
H5: The influence of attraction attribute performance on visitor satisfaction is mediated by the perceived value of the attraction
Studies have inferred the likelihood of variables intervening in the relationship between service quality and behavioural intentions. Services management literature has been hypothesising perceived value as a prominent mediator of behavioural intentions (for example see Petrick, 2002; Chen, 2012). Monroe (1990) found perceived value as a precursor to a person’s willingness to buy and as an outcome of perceived product quality and perceived sacrifice. The results of Brady et al’s (2001) study indicated that there is no direct path between customers’ service quality evaluation and their behavioural intentions rather it was submitted that the effect is indirect through the consumer’s service value assessment.
This leads to the sixth hypothesis:
H6: The influence of perceived service quality on behavioural intentions is mediated by perceived value of the attraction
Perceived value has gained increased recognition as a reliable variable in predicting behavioural intentions (Heillier et al., 2003). Value has been argued to be critical indicator of repurchase intentions (Lee, Petrick, and Crompton, 2007; Chen and Chen,
2010). Zeithaml’s (1988) conceptualisation of the perceived value of a service revealed that
perceived value leads to purchase intentions. Sweeney et al. (1997) concluded that overall value had the greatest influence on willingness to buy than functional, technical and product quality. Pura (2005) and Lee et al (2014), in studies of effect of customer perceived value on attitudinal and behavioural component of loyalty concluded that behavioural intentions were significantly influenced by customer perceived value.
H7: Behavioural intention is positively related to the perceived value of the attraction
assertion in both wider service marketing research (see for example Zeithalm et al 1996; Zeithalm, 2000, Zhao et al., 2012; Wu et al., 2014) and the tourism and hospitality field (see for example Yuan and Jang, 2007; Zabka et al., 2010; Howat and Assaker, 2013; Lee, Jin and Lee, 2014). Even though there have been several examinations of this relationship, there are still contentions. For instance, Olorunniwo and Hsu (2006) noted that there are mixed opinions on the existence of a direct relationship between perceived quality and behavioural intentions in all service contexts. Whilst Cronin etal. (2000) found a significant direct link between perceived quality and behavioural intentions in six service sectors: fast food, entertainment, spectator sports, participative sports, health care and long haulage ground transport, it was however noted that when data from individual sectors was tested separately only four of the sectors displayed a direct link between perceived quality and behavioural intentions. It will therefore be important to test the direct relationship between service quality and behavioural intentions in themed attractions. In view of this it is proposed that:
H8 Behavioural intention is positively related to the perceived service quality of the attraction
It has been established that satisfaction is a powerful predictor of revisit intention as it represents a universal evaluation and general attitudinal construct (Mittal et al., 2001; Yuan and Jang, 2007). Similarly, Wu and Li (2015) found support for the proposition that visitor satisfaction reinforces visitors’ intentions of using a service again and engaging in positive word-of-mouth. Consumers who are not familiar with the attributes of a product usually rely on word of mouth to acquire
information (Bansal and Voyer, 2000) hence Harrison-Walker (2001) suggests that in comparison to external marketing strategies, word of mouth is more important and influential in terms of
customers’ attitude and behaviour. Yuan and Jang, (2007) in their exploratory study of a wine festival conclude that quality does not directly influence behavioural intentions but has an indirect effect through satisfaction. Other studies that have found an indirect relationship between service quality and behavioural intentions include Woodside et al. (1989). In the same vein, Lee et al. (2007), in an examination of the multiple dimensions of perceived value for tourism at a Korean war-related tourist site found that perceived value has an indirect effect on recommendation. In view of this, Lee
et al. (2007) concluded that war-related tourist site satisfaction mediates the relationship between all the tourist perceived value dimensions of the site and tour recommendation. Howat and Assaker (2013) in an outdoor aquatic centre context found that satisfaction fully mediates the impact of perceived quality and perceived value on behavioural intentions.
H9 (a): The influence of quality on behavioural intention is mediated by visitor satisfaction
H9 (b): The influence of value on behavioural intention is mediated by visitor satisfaction.
The relationship between the constructs and hypotheses based on previous research are shown in Figure 1.
INSERT FIGURE 1 ABOUT HERE
Data collection
Data was collected in the Midland Region of the UK. Two visitor attractions, Blists Hill Victorian Town (BHVT) and Alton Towers (AT), were selected because of their popularity in the region. Having been given an approval to collect data at the Blists Hill Victorian Town site the questionnaire
administration took place at the exit of the site. Exiting visitors were approached at this location and encouraged to participate in the survey. Exit surveys often have a convenience sampling element, even if by design it is to gather data by random sampling. It is often impractical to intercept, engage and receive the cooperation of exiting potential participants at attractions, malls or destinations in a perfectly random manner (Woodside and Dubelaar, 2002). Data was collected by intercepting visitors who were leaving the site, explaining the purpose of the study and seeking their cooperation in participating in the survey. Each questionnaire took roughly 15 minutes to complete. A total of 247 questionnaires were completed for BHVT.
For the Alton Towers survey, a total of 323 completed questionnaires were collected. Data for Alton Towers was wholly collected from online sources adopting mixed-mode approach (Dillman, 2007). Five Alton Towers’ online forums were contacted to seek approval for their members to participate in the survey. The names of the five forums would not be mentioned as permission was not sought in this regard. The five forums’ profiles are as follows: AATAX (2149 members), CTNY (5480
members), ETTW with 4130 membership, GMMV (membership size not known) and IMHZ (1716 members). It was envisaged that access will be gained to sample respondents randomly. This was not, however, achieved due to privacy issues, hence a convenience sampling approach was also adopted here. Information as to how many people did or did not agree to participate in the survey was not ascertained. No checks could be made to determine non-response bias.
Scale development
The perceived quality scale used was developed in another research by the authors using sequential, mixed-methods approach. The scale consists of six quality dimensions: ‘activities’, ‘staff’, ‘operation and environment’, ‘retail’, ‘access’ and ‘ease of use’. Perceived value was measured using items used by Sweeney and Soutar (2001), Bello and Etzel (1985) and Weber (2001). Satisfaction was measured using a multi-item scale adapted from Oliver’s (1997) universal scale and behavioural intention was measured using items used by Baker and Crompton (2000); Brady, Cronin and Brand (2002); Lee et al (2007) and Zabka et al (2010). Creswell (2009) warns that when pre-validated items are modified or combined, the original validity and reliability may not hold for the new instrument; considering this, validity and reliability of the modified items were re-established.
Pearson scores were calculated for the index of attraction attributes, overall satisfaction,
behavioural intention (via Positive word of mouth, intention to recommend and intention to revisit) and overall value. The correlation of overall satisfaction, overall perceived value, the three
The scale’s discriminant validity was established because the correlation of the index of attraction factors with overall satisfaction (0.62) is greater than the three measures of behavioural intention - Positive word of mouth (0.62); Intention to recommend (0.57) and Intention to revisit (0.61). Further perusal of the correlation scores revealed that nomological validity was also confirmed. Visitor satisfaction and attraction attributes correlate with behavioural intentions in a theoretically predicted manner. In the literature, (see for example Cole et al., 2002) a high level of visitor satisfaction, and/or perception of high service quality are likely to enhance visitors’ intention to revisit a site and engage in positive word-of-mouth communication with family and friends. Additional evidence to buttress the achievement of nomological validity is predicated on the theoretical premise that visitors are more likely to recommend than revisit since recommending is easier than revisiting. From the results, overall satisfaction correlates in a theoretically predicted way with intention to recommend (0.74) having higher correlation that intention to revisit (0.58). To this end, the scale displayed theoretically predictable characteristics as it correlates with other measures to which it was theoretically related.
Respondents' profile and demographic characteristics
The combined samples from the two attractions numbered 507 but only 445 supplied information regarding their gender, of which 45% were male and 55% female. The majority (49%) of the
respondents were within the age range of 18 to 24 years (see Table 1). Over 40% were students; this is quite understandable because the online survey was largely distributed via university and college emails. The gender composition is similar to most family-oriented attraction visitor profiles in the literature (e.g. Spinks et al., 2005). The summary of the whole demographic profile of the
respondents that completed the survey for the two sites can be found in Table 1.
INSERT TABLE 1 ABOUT HERE
Results
followed by Factor 4 – Retail (β = .16, p<.05). Only Factors 1 – activities and 4 - Retail were statistically significant.
INSERT TABLE 2 ABOUT HERE
Examination of the value factors – social and personal value, monetary value and emotional value against the attraction factors also confirmed that the activities dimension exerts the highest
influence on value. When all the three value factors when individually regressed on the six attraction factors the analysis show that Factor 1 – activities was statistically significant at the 95% confidence level in all the cases. Overall value explained 46% of the dependent variable; thus, Hypothesis 2 (H2) was supported.
To analyse the impact of perceived value on visitor satisfaction, overall visitor satisfaction was regressed on three value factors (Table 3). The results indicate that social and personal value, monetary value and emotional value together explain 37% of the variability in visitor satisfaction with emotional value exerting the most influence (β – .42).
INSERT TABLE 3 ABOUT HERE
Investigating the influence of the perceived quality of the attractions on visitor satisfaction, overall satisfaction was regressed on overall quality. The result of the analysis supports the view that quality influences satisfaction with a R² of 0.28 indicating that 28% of overall quality explains overall
satisfaction (β = 0.53, p<.001) (see Table 4). In addition, four further regression models were run assessing the impact of overall quality on ‘I was delighted with the attraction’ (SAT 1), ‘I was pleased that I decided to visit the attraction’ (SAT 2), ‘The experience I had visiting the attraction exceeded my expectation’ (SAT 3) and ‘Visiting the attraction was exactly what I needed’ (SAT 4). Overall quality explained the following variances in the four satisfaction measures: SAT 1 – 32%, SAT 2 – 25%, SAT 3 – 32% and SAT 4 – 25%. All the satisfaction variables were significant at 95% confidence level further supporting the existence of a quality-satisfaction relationship. Therefore, Hypothesis 4 (H4) was accepted.
INSERT TABLE 4 ABOUT HERE
independent variable significantly affects the dependent variable, and (3) the mediator variable affects the dependent variable when both the independent and the mediator variable are in the model. If these conditions manifest in the hypothesized direction, then the influence of the
independent variable on the dependent variable should be less in the third regression equation than in the second (Baron and Kenny 1986). Further to this, perfect mediation exists if the independent variable has no influence on the dependent variable when the mediator is controlled. The effect of the variable, perceived value of the attractions mediating the effect of attraction attribute
performance (independent variable) on visitor satisfaction (dependent variable) was assessed employing the above procedures.
The results of the procedures are shown in Figure 2 and Table 5. The regression analysis showed that the influence of attraction attribute performance on perceived value was significant (t = 10.57, p < .001). The influence of attraction attribute performance on overall visitor satisfaction was also significant (t = 10.50, p < .001). Additionally, perceived value significantly affected overall satisfaction (t = 6.61, p < .001), and attraction attribute quality in the same equation also influenced overall satisfaction significantly (t = 4.57, p > .001). This indicates a partial mediation (Baron and Kenny 1986).
INSERT FIGURE 2 ABOUT HERE
The indirect influence of attraction attribute performance on satisfaction through perceived value was also examined using the Sobel (1982) test to explicitly assess the significance of mediation effects. A test statistic with a normal distribution was derived using the unstandardized coefficients and the standard errors from the regressions above. The statistical significance of this test statistic was then evaluated. As shown in Table 6, the mediation effect of perceived value on attraction attribute performance and overall visitor satisfaction was significant p < .001.
INSERT TABLE 5 ABOUT HERE
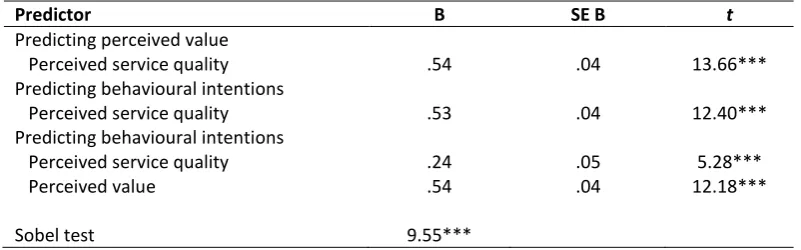
In summary, the Sobel (1982) statistic showed that perceived value mediated the effect of attraction attribute performance on overall visitor satisfaction. Baron and Kenny’s (1986) procedure indicated a partial mediation effect. Therefore, Hypothesis 5 was supported. The partial mediating effect means that, attraction attribute performance had some direct effect on overall visitor satisfaction. The same procedures as above were followed to test Hypothesis 6 (H6), the influence of perceived service quality on behavioural intentions through the mediating effect of perceived value;
regression analysis indicated that the effect of service quality on visitor satisfaction was significant (t = 8.60, p<.001). Likewise, the effect of service quality on behavioural intention was significant (t = 12.40, p<.001). Further to this satisfaction significantly influenced behavioural intentions (t = 19.22, p<.001) as did service quality (t = 3.59, p<.001) in this same equation. However, the impact of service quality was less in the third equation than the second thereby signifying a partial mediation (Baron and Kenny, 1986). The analysis showed that the effect of perceived value on visitor satisfaction was significant (t = 15.86, p<.001). Equally, the influence of perceived value on behavioural intentions was significant (t = 18.15, p<.001). Furthermore, both satisfaction (t = 16.70, p<.001) and perceived value (t = 8.55, p<.001) had significant influenced on behavioural intentions when both variables were present in the same equation. Nevertheless, the effect of perceived value was less in the third equation than in the second one thereby indicating a partial mediation of satisfaction in the model (Baron and Kenny, 1986). See Table 7 for the summary of results for all hypothesis tests.
INSERT TABLE 6 ABOUT HERE
In testing Hypothesis 7 (H7) - value positively influences behavioural intentions, relationships between the three Value Factors and Behavioural Intention 1 (BI1 – I would speak highly of the attraction to friends and relatives) were examined, the Factors were found to explain 41% of the variance in BI1. When Behavioural Intention 2 (BI2 - I would recommend the attraction to others) was considered, the Factors explained 40% of the variance in BI2. For the significant coefficients (β) in the Value Factor- Behavioural Intention 1 model, for every unit increase in emotional value, the tendency for visitors to speak highly of the attraction to friends and relatives increased by .384 units; for a unit increase in monetary value, Behavioural Intention 1 increased by .205 units and; a unit increase in Social and Personal value resulted in a 0.175 unit increase in visitors speaking favourably of the attraction to others. For the Value Factor- Behavioural Intention 2 equation, an increase in emotional value results in .473 units increase in visitors’ willingness to recommend the attraction to others and a unit increase in monetary value produced a 0.182 unit increase in Behavioural Intention 2. Social and personal value was not statistically significant in this model.
For the Value Factor- Behavioural Intention 3 model only emotional value (β – .394, p<.001) was found to have a significant effect on revisit intentions. Overall, Hypothesis 7 (H7) was supported as all the regression model examined to assess the influence of the perceived value of the attraction on behavioural intentions reflect the general state of the literature (e.g. Cronin et al., 2000; Lee et al.,
2007 and Chen and Chen, 2010). However, these findings are at variance with Gallarza and Saura’s (2006) study results that did not find direct effects of social, play, aesthetics, and time and effort value dimensions on loyalty.
The hypothetical relationship between service quality and behavioural intentions was also verified. The results of the impact of Overall Quality on BI1, BI2 and BI3 indicate the independent variable explained 27% variance in BI1, 22% variance in BI2 and 14% variability in BI3. In all cases the
independent variable was significant at 95% confidence level. In addition, the regression coefficients indicated that Overall Quality had significant impact on Behavioural Intents exerting highest
Although the results are somewhat lower compared to for example perceive value results; however, the results support Hypothesis 8 (H8).
Discussion
The focus of this research was to examine the relationship between quality, value, satisfaction and behavioural intentions in the UK visitor attraction industry using Alton Towers and Blists Hill Victorian Town as the context. Nine hypotheses, formulated based on the literature, were tested. Also, the effects of attraction attributes on quality and value, and value factors on satisfaction and behavioural intentions were examined. The study supports Cronin et al’s (2000) argument that the relationship existing between the service constructs is far more complex than that generally reported in the literature. The findings of this study, like those of Cronin et al. (2000) and Petrick (2004), show that perceived quality directly affects perceived value, visitor satisfaction and
behavioural intentions. Also, it has indirect effects on behavioural intentions through both perceived value and visitor satisfaction. The complexity of the relationship is not limited to quality; the
perceived value of attractions also exhibits similar convolution. It was found that perceived value has a direct influence on both satisfaction and behavioural intentions. These findings are consistent with previous research by Tam (2004) and Chen and Chen (2010), albeit in other sectors. Perceived value also has an indirect influence on behavioural intentions through visitor satisfaction. This result supports Tam’s (2004) work, which also reported perceived value as having an indirect effect on behavioural intentions through customer satisfaction.
This finding however, is a complete departure from Gallarza and Saura’s (2006) work that found no link between service quality and satisfaction or Bolton and Drew (1991) who modelled satisfaction as an antecedent to service quality. The vast majority of studies in this area (e.g. Brady et al., 2002; Cole and Illum, 2006; Zabkar et al., 2010) support the quality-satisfaction relationship; moreover, Brady et al (2005) contend that this order is obtainable irrespective of setting/context.
The general state of the literature regarding the direct relationship of service quality and
behavioural intentions is quite mixed. Cronin et al (2000), for example, found significant direct link between perceived quality and behavioural intentions in fast food, entertainment, spectator sports, participative sports, health care and long haul ground transport. It was, however, noted that when data from individual sectors was tested separately only four of the sectors displayed a direct link between perceived quality and behavioural intentions. Gonzales et al (2007) found buying intentions and word of mouth communication are positively influenced by perceived quality although they found that satisfaction exerts more influence. Whilst it is acknowledged that the direct relationship of service quality and behavioural intentions may not exist in all service contexts, this relationship was found at Alton Towers and Blists Hill Victorian Town.
Further examination of the effect of attraction attributes (through the factors) on value suggests that visitors’ perception of value is influenced by activities at both the Alton Towers and Blists Hill Victorian Town visitor attractions. This result is in line with Patterson and Spreng’s (1997) study in business-to-business contexts that found one dimension of performance the most important in explaining value and satisfaction. This suggests that mangers and developers of visitor attractions need to investigate and design activities which will enhance visitors’ perception of value. It must be noted that this is an area that is seldom researched in tourism; there is a need for further
investigation in this area. Other attraction dimensions have substantial impacts, and therefore, considered also to be important; they should not be overlooked in product and marketing strategy development.
The result show that value, from all dimensions, has a meaningful influence on visitors’ satisfaction and behavioural intentions. This finding reflects Sweeney and Soutar‘s (2001) assertion that
consumers assess product not only from functional or performance, value for money and usefulness bases, but also in terms of pleasure derived from the product (emotional value) and social imports of the product as it is communicated to families, friends and other acquaintances (social value). This is also consistent with Chen and Hu’s (2010) findings.
Conclusion and Implications
The findings of this study support several dominant theoretical propositions concerning the relationships that exist between perceived quality, value, customer satisfaction and behavioural intentions when viewed from visitor attractions perspective. All the hypotheses tested in this regard were supported. Consistent with prior research in services management (Cronin et al., 2000) and tourism (Petrick, 2004 and Chen and Chen, 2010), the cognitive responses (quality and value) precede emotional (satisfaction) and conative (behavioural intentions) responses.
One significant contribution of this study is that attraction attributes exert more influence on perceived value than on perceived quality; this has some theoretical implications on the
conceptualisation of quality and the role assigned to attributes in relation to quality. If attributes constitute quality, it is only logical that they exert more influence on it than any other construct. Another significant contribution of this study is the further expansion of knowledge in the quality-value-satisfaction-behavioural sequence in attraction service experience as it examines the direct and indirect relationships in the service construct. The model provides us with an understanding of the interaction between the service constructs examined in this research, responding to Gallarza and Saura’s (2006) call that this area be explored, particularly in visitor attraction context.
On the whole, the assessment of the tested model revealed that the service constructs are extensively integrated; hence managers in the industry need to study them carefully and avoid abandoning one for the other - for instance, customer satisfaction and service quality are often the focus of attention within a tourism context, whereas, this study and many others indicate that other constructs, such as value, are crucial in visitors’ repurchase and referral intentions. Another
most, as well as design the required aspects of service to stimulate visitor perception of value to position the product effectively in the mind of the target audience.
Limitations and recommendations for further research
This research has contributed to knowledge by developing and testing a model that examined the relationship between perceived quality, value, satisfaction and behavioural intentions in the visitor attraction context. Whilst care was taken in the design and conduct of the study, as with any other research project, some limitations were identified.
Due to the nature of visitor attraction operations, which make access to the visitor difficult, a multiple method of data collection was adopted including a web-based survey. Web-based surveys are often criticised for not having high response rates to enable the results to be generalized beyond the scope of the sample (Sill and Song, 2002). This may result from technological problems with delivery, for instance the incompatibility of the survey system with web browser or computer system used by respondents and security issues. Problems with spam mails are also likely to cause problems with delivery in some instances. In a case like this, intended respondents may not be reached, contributing to low response rates and an impact on representativeness. Also, associated with the constraint of adopting multiple methods of data collection was the implementation of a non-random sampling method. Future research could employ a probability sampling approach and may also want to consider a broader spectrum of attraction visitors.
The model developed in this study was only tested in a heritage visitor attraction with enactment and a theme park and did not include all possible service constructs involved in visitors’ experience. Therefore, generalisability of the results to other attraction contexts should be considered with caution because quality is context specific and visitor attractions vary significantly in size, type and visitor appeal. In addition, data collected from the two attractions was aggregated because this provides a basis for exploring the commonality and differences between them. However, this limited the set of available attributes to those common to both attractions. Again, the focus of the study was on the relationship between service quality, perceived value, visitor satisfaction and behavioural intentions. Some insights were gained on the influence of attraction attributes on value. Further research should therefore explore this domain, compare the effect in different types of attractions and examine the direct influence on other constructs such as loyalty.
References
Baker, D. A. and Crompton, J. L. (2000), “Quality, satisfaction and behavioural intentions”, Annals of Tourism Research, Vol. 27 No. 3, pp. 785-804.
Bansal, H. S. and Voyer, P. A. (2000), “Word-of-mouth processes within a services purchase decision context”, Journal of Service Research, Vol. 3 No. 2, pp. 166-177.
Bello, D. C. And Etzel, M. J. (1985), “The role of novelty in the pleasure travel experience”, Journal of Travel Research, Vol. 24 No.1, pp. 20-26.
Brady, M. K., Knight, G. A., Cronin, J. J., Tomas, G., Hult, M. and Keillor, B. D. (2005)
Removing the conceptual lens: a multinational, multi-setting comparison of service evaluation models, Journal of Retailing Vol. 81 No. 3, pp.215-230.
Brady, M. K. Cronin, J. J. and Brand, R. R. (2002). Performance-only measurement of service quality: application and extension, Journal of Business Research, Vol. 55, pp. 17-31.
Brady, M. K.; Robertson, C. J. and Cronin, J. J. Jr. (2001). Managing behavioural intentions in diverse cultural environments: an investigation of service quality, service value, and satisfaction for
American and Ecuadorian fast-food customers, Journal ofInternational Management, Vol. 7, pp. 129-149.
Bolton, R. N. and Drew, J. H. (1991). A multi-stage model of customers’ assessments of service quality and value, Journal of Consumer Research, Vol. 17, pp. 375-384.
Bojanic, D.C. (1996). Consumer perceptions of price, value and satisfaction in the hotel industry: an exploratory study, Journal of Hospitality and Leisure Marketing Vol. 4 No. 1, pp. 5-22.
Chen, S. C. (2012). The customer satisfaction–loyalty relation in an interactive eservice setting: The mediators. Journal of Retailing and Consumer Services, Vol. 19 No. 2, pp. 202-210.
Chen, C-F and Chen, F-C (2010). Experience quality, perceived value, satisfaction and behavioural intentions for heritage tourists, Tourism Management, Vol. 31 No.1, pp. 29-35.
Chen, J. S. and Hsu, C. H. C. (2001). Developing and validating a riverboat gaming impact scale,
Annals of Tourism Research, Vol. 28 No. 2, pp. 459-476.
Chen, P-T and Hu, H-H (2010). How determinant attributes of service quality influence customer-perceived value: an empirical investigation of the Australian coffee outlet industry, International Journal of Contemporary Hospitality Management, Vol. 22 No. 4, pp. 535 – 551.
Cole, S. T. and Illum, S. F. (2006). Examining the mediating role of festival visitors’ satisfaction in the relationship between service quality and behavioural intentions, Journal of Vacation Marketing, Volo. 12 No. 2, pp. 160-173.
Cole, S T.; Crompton, J. L. and Willson, V. L. (2002). An empirical investigation of the relationship between service quality, satisfaction and behavioural intentions among visitors to a wildlife refuge,
Journal of Leisure Research, Vol. 34 No. 1, pp. 1-024.
Cronin. J. J. Brady, M. K. and Hult, G. T. M. (2000). Assessing the effect of quality, value and customer satisfaction on behavioural intensions in service environments, Journalof Retailing, Vol. 76 No. 2, pp. 193-218.
Dillman, D. A. (2007). Mail and internet surveys: the tailored design method, 2nd edition, New Jersey, John Wiley and Sons.
Duman, T. and Mattila, A. S. (2005). The role of affective factor on perceived cruise vacation value, Tourism Management, Vol. 26, pp. 311-323.
Gallarza, M. G., and Saura, I. G. (2006) Value dimensions, perceived value, satisfaction and loyalty: An investigation of university students’ travel, Tourism Management, Vol. 27, pp. 437-452.
Gonzalez, M. E. A., Comesana, L. R. and Brea, J. A. F. (2007). Assessing tourist behavioural intentions through perceived service quality and customer satisfaction, Journal of Business Research, Vol. 60, pp. 153-160.
Han, H., Meng, B. and Kim, W. (2017). Bike-traveling as a growing phenomenon: Role of attributes, value, satisfaction, desire, and gender in developing loyalty, TourismManagement, Vol. 59, pp. 91-103.
Harrison-Walker, L. J. (2001). The measurement of word-of-mouth communication and an investigation of service quality and customer commitment as potential antecedents, Journal of Service Research, Vol. 4 No. 1, pp. 60-75.
Howat, G., and Assaker, G. (2013). The hierarchical effects of perceived quality on perceived value, satisfaction, and loyalty: Empirical results from public, outdoor aquatic centres in Australia. Sport Management Review, Vol. 16 No. 3), pp. 268-284.
Kaenzig, J., Heinzle, S. L., and Wüstenhagen, R. (2013). Whatever the customer wants, the customer gets? Exploring the gap between consumer preferences and default electricity products in Germany.
Energy Policy, Vol. 53, pp. 311-322.
Lavidge, R. J. and Steiner, G. A. (1961) A model for predictive measurements of advertising effectiveness. Journal of Marketing, Vol. 25(October), pp. 59–62.
Lee S Y et al Lee, S. Y., Petrick, J. F. and Crompton J. (2007). The Roles of Quality and
Intermediary Constructs in Determining Festival Attendees' Behavioural intensions, Journal of Travel Research, Vol. 45, pp. 402-412.
Lee CK et al (2007). Lee, C K; Yoon, Y. S. and Lee, S. K. (2007) Investigating the relationship among perceived value, satisfaction, and recommendation: the case of the Korean DMZ Tourism
Management, Vol. 28 No. 1, pp. 204-214.
Lee, S., Jin, N and Lee, H. (2014). The Moderating Role of Water Park Service Quality, Environment, Image, and Food Quality on Perceived Value and Customer Loyalty: A South Korean Case Study,
Lin, C. F. (2003). Quality-delivery system: a conceptual framework of attribute level value linkages,
Total Quality Management and Business Excellence, Vol. 14 No. 10, pp. 1079-1092.
McDougall, G. H. and Levesque, T. (2000). Customer satisfaction with services: putting perceived value into equation, Journal of Services Marketing, Vol. 14, pp. 392-410.
Mittal, V.; Katrichis, J. M. and Kumar, P. (2001). Attribute performance and customer satisfaction over time: evidence from two field studies, Journal of Services Marketing, Vol. 15 No. 5, pp. 343-356.
Monroe, K. B. (1990) Pricing: Making profitable decisions, New York: McGraw-Hill.
Nowacki, M. M. (2009) Quality of visitor attractions, satisfaction, benefits and behavioural intentions of visitors: verification of a model, International Journal of Tourism Research, Vol. 11, pp. 297-309.
Oliver, R.L. (1997). Satisfaction: A behavioural perspective on the consumer, New York,
NY: McGraw-Hill.
Olorunniwo, F., and Hsu, M. K. (2006). A typology analysis of service quality, customer satisfaction and behavioral intentions in mass services. Managing Service Quality: AnInternational Journal, Vol. 16 No. 2, pp. 106-123.
Parasuraman, A. Zeithaml, V. A. and Berry, L. L. (1985). A conceptual model of service quality and its implications for future research, Journal of Marketing, Vol. 49 (fall), pp. 41-50.
Parasuraman, A. Zeithaml, V. A. and Berry, L. L. (1988). SERVQUAL: A multiple-item scale for measuring consumer perceptions of service quality, Journal of retailing, Vol. 64 No. 1, pp. 12-40.
Patterson, P. G. and Spreng, R. A. (1997). Modelling the relationship between perceived value, satisfaction and repurchase intentions in business-to-business, services context: an empirical examination, International Journal of Service IndustryManagement, Vol. 8 No. 5, pp. 414-434.
Petrick, J. F. (2002). Development of a multi-dimensional scale for measuring the perceived value of a service, Journal of Leisure Research, Vol. 34 No. 2, pp. 119–34.
Petrick, J. F. (2004). The roles of quality, value and satisfaction in predicting cruise passengers’ behavioural intentions, Journal of Travel Research, Vol. 42 No. 4, pp. 397– 407.
Pura, M. (2005). Linking perceived value and loyalty in location-based mobile services, Managing Service Quality, Vol. 15 No. 6, pp. 509-538.
Ranjbarian, B. and Pool, J. K. (2015). The Impact of Perceived Quality and Value on Tourists’ Satisfaction and Intention to Revisit Nowshahr City of Iran, Journal of QualityAssurance in Hospitality and Tourism, Vol. 16, pp. 103–117
Ryan, C. (1995) Researching tourist satisfaction: issues, Concepts and problems, London: Routledge.
Sandoval-Chavez, D. A. and Beruvides, M. G. (1998). Using opportunity costs to determine the cost of quality: a case study in continuous-process industry,
Shamdasani, P.; Mukherjee. A. and Malhotra, N. (2008). Antecedents and consequences of service quality in consumer evaluation of self-service internet technologies, The Service Industries Journal, Vol. 28 No. 1, pp. 117-138.
Sill, S. J. and Song, C. (2002). Innovations in survey research, Social Science Computer Review, Vol. 20 No. 1, pp. 22-30.
Sobel, M. E. (1982). Asymptotic Intervals for Indirect Effects in Structural Equations
Models, in S. Leinhart, (ed.) Sociological Methodology, San Francisco, CA: Jossey-Bass, pp. 290-312.
Spinks, W., Lawley, M. and Richins, H. (2005). Satisfaction with Sunshine Coast Tourist Attractions: The influence of individual visitor characteristics, The Journal of Tourism Studies, Vol. 16 No. 1, pp. 12-23.
Su, L., Swanson, S.R. and Chen, X., (2016). The effects of perceived service quality on repurchase intentions and subjective well-being of Chinese tourists: The mediating role of relationship quality.
Tourism Management, Vol. 52, pp. 82-95.
Swarbrooke, J. (2001). Key challenges for visitor attraction managers in the UK. Journal of Retail & Leisure Property, Vol. 1 No.4, pp. 318-336.
Sweeney, J. C., and Soutar, G. N. (2001). Consumer perceived value: The development of a multiple item scale, Journal of Retailing, Vol. 77 No. 2, pp. 203–220.
Sweeney, J.C.; Soutar, G. N. and Johnson, L. W. (1997). Retail service quality and perceived value, Journal of Retailing and Consumer Service, Vol. 4 No. 1, pp. 39-48.
Tam, J. L. (2004). Customer satisfaction, service quality and perceived value: an integrative model.
Journal of marketing management, Vol. 20 No.7-8, pp. 897-917.
Woodside, A. G. and Dubelaar, C. (2002). A general theory of tourism consumption system: a
conceptual framework and an empirical exploration, Journal of TravelResearch, Vol. 14, pp. 120-132
Woodside, A. G.; Frey, L. L. and Daly, R. T. (1989) Linking service quality, customer satisfaction and behavioural intention, Journal of Health Care Marketing, Vol. 9 No. 4, pp. 5–17.
Wu, L. Y., Chen, K. Y., Chen, P. Y., and Cheng, S. L. (2014). Perceived value, transaction cost, and repurchase-intention in online shopping: A relational exchange perspective. Journal of Business Research, Vol. 67 No. 1, pp. 2768-2776.
Wu, H. C., and Li, T. (2015). An empirical study of the effects of service quality, visitor satisfaction, and emotions on behavioral intentions of visitors to the museums of Macau. Journal of Quality Assurance in Hospitality and Tourism, Vol. 16 No. 1, pp. 80- 102.
Zabka, V., Brencic, M. M. and Dmitrovic T. (2010). Modelling perceived quality, visitor satisfaction and behavioural intentions at the destination level, Tourism Management, Vol. 31 pp. 537–546.
Zeithaml, V. A. (1988). Consumer Perceptions of Price, Quality and Value: A Means- End Model and Synthesis of Evidence, Journal of Marketing, Vol. 52 No 3, pp. 2-22.
Zeithaml, V. A. and Bitner, M. J. (2000). Services Manrketing: integrating customer focus across the firm, New York: McGraw-Hill.
[image:19.595.104.517.316.771.2]Zhao, L., Lu, Y., Zhang, L., and Chau, P. Y. (2012). Assessing the effects of service quality and justice on customer satisfaction and the continuance intention of mobile value-added services: An empirical test of a multidimensional model. Decision SupportSystems, Vol. 52 No. 3, pp. 645-656.
Table 1 Respondents' Profile and Demographic Characteristics
Demographic variables Blists Hill Victorian Town n (%) Alton Towers n (%) n (%) Gender Male Female 75(36.8%) 129(63.2%) 127(52.7%) 114(47.3%) 202(45.4%) 243(54.6%) Age
18 – 24 25 – 34 35 – 44 45 – 54 55 – 64 65 and Over
42(19.9%) 32(15.2%) 41(19.4%) 40(19.0%) 30(14.2%) 26(12.3%) 181(75.4%) 38(15.8%) 18(7.5%) 3(1.3%) - - 223(49.4%) 70(15.5%) 59(13.1%) 43(9.5%) 30(6.7%) 26(5.8%) Occupation
Social grade A Social grade B Social grade C1 Social grade C2 Social grade D Social grade E Student 5(2.6%) 59(30.6%) 31(16.1%) 17(8.8%) 16(8.3%) 34(17.6%) 31(16.1%) 1(0.4%) 27(11.5%) 29(12.4%) 5(2.1%) 25(10.7%) 3(1.3%) 144(61.5%) 6(1.4%) 86(20.1) 60(14.1 22(5.2%) 41(9.6%) 37(8.7%) 175(41%)
Number in party 1 2 3 4 5 6 7 5(2.4%) 81(39.3%) 34(16.5%) 26(12.6%) 22(10.7%) 12(5.8%) 26(12.6%) 7(3.0%) 31(13.1%) 18(7.6%) 42(17.7%) 43(18.1%) 24(10.1%) 72(30.4%) 12 (2.7%) 112 (25.3%) 52 (11.7%) 68 (15.3%) 65 (14.7%) 36 (8.1%) 98 (22.1%)
Nature of party
With a friend(s) With a Colleague(s) With family Other 39(19.3%) 8(4.0%) 145(71.8%) 6(3.0%) 152(63.3%) 7(2.9%) 68(28.3%) 6(2.5%) 191(37.7%) 15(3.0%) 213(42.0%) 12(2.4%)
Table 2 Regression of Overall Quality on the Attraction Factors
R R2 Adjusted R2 df F sig Durbin-Watson
.63 .40 .38 6 18.57 .000 1.94
Regression coefficient Model Unstandardized
coefficient
Standardize d coefficient
t sig Collinearity statistics
B SE β Toler
ance VIF
Factor 1: Activities
.205 .054 .30 3.802 .000 .586 1.706
Factor 2: Staff attributes
.056 .049 .08 1.147 .253 .664 1.505
Factor 3: Operations and environment
.088 .054 .123 1.633 .104 .626 1.596
Factor 4: Retail .106 .049 .158 2.138 .034 .659 1.518 Factor 5: Access .076 .045 .115 1.676 .096 .766 1.305 Factor 6: Ease of
use .062 .048 .089 1.300 .195 .765 1.307
Table 3 Regression of Overall Satisfaction on Value Factors
R R2 Adjusted
R2
df F sig Durbin-Watson
.610 .373 .367 3 65.152 .0001 2.013
Regression coefficients Model Unstandardized
coefficient
Standardize d coefficient
t sig Collinearity statistics
B SE β Tolerance VIF
Emotional value
.349 .047 .423 7.396 .000 .584 1.712
Monetary value
.118 .040 .153 2.964 .003 .719 1.390
Social and Personal value
[image:20.595.101.531.531.721.2]Table 4 Regression of Overall Satisfaction on Overall Quality
R R2 Adjusted
R2
df F sig Durbin-Watson
.530 .281 .279 1 172.747 .000 1.995
Regression coefficients
Model Unstandardized coefficient
Standardized coefficient
t sig Collinearity statistics
B SE β Tolerance VIF
Overall quality
[image:21.595.96.483.381.506.2].608 .046 .530 13.143 .000 1.000 1.000
Table 5 Value Mediation Analysis
Predictor B SE B t
Predicting perceived value
Attraction attribute performance .63 .06 10.57*** Predicting visitor satisfaction
Attraction attribute performance .69 .07 10.50*** Predicting visitor satisfaction
Attraction attribute performance Perceived value
.35 .51
.08 .08
4.57*** 6.61***
Sobel test 5.45***
***p< .001
Table 6 Value Mediation Analysis
Predictor B SE B t
Predicting perceived value
Perceived service quality .54 .04 13.66***
Predicting behavioural intentions
Perceived service quality .53 .04 12.40***
Predicting behavioural intentions Perceived service quality Perceived value
.24 .54
.05 .04
5.28*** 12.18***
Sobel test 9.55***
[image:21.595.93.494.586.711.2]Figure 1: A Proposed Model: Relationship Between Service Quality, Value,
Satisfaction and Behavioural Intentions
Figure 2: Perceived Value Mediation Model 1 after Baron and Kenny (1986)
Attraction Attributes
Quality Value
Visitor Satisfaction
Behavioural Intention
H1 H2
H4 H3
H7
H 9b
H8
H9a
Overall satisfaction (Dependent Variable) Attraction attribute
performance (Independent Variable)
Perceived value of the attraction (Mediating Variable)
1.
.63(.06), t = 10.57***
3.
.35(.08), t = 6.61***
.51(.08), t = 6.61***
2.
[image:22.595.108.482.418.646.2]