FORMULATION DEVELOPMENT AND EVALUATION OF
MODIFIED RELEASE ANTISPASMODIC PELLETS
B. S. Venkateswaralu*1, B. Jaykar1, N.K.K. Sreedharan1, Palanisamy.P1, T.V. Narayana2
1Department of Pharmaceutics, Vinayaka Mission’s College of Pharmacy, Vinayaka
Missions University Salem, Tamil Nadu
2
Department of Pharmaceutics, Vikas Institute of Pharmaceutical Sciences,
Rajamundhry (A.P.)
ABSTRACT
Antispasmodic agents are used in the treatment of Irritable bowel
syndrome (IBS). The formulation of antispasmodic agent in pellet, is to
improve its oral bioavailability and possibility to restrict its absorption
at colon, pellets were prepared by drug layering technique in three
trails (T1 – T3), and further Four formulations (F1 – F4) were prepared
with varying concentration polymers such as Eudragit S100, Eudragit
L100 D55, Eudragit NE 30 D with suitable plasticizer. These
formulations were subjected to various evaluation parameters like
microscopic evaluation, flow properties, particle size distribution,
assay and In-vitro drug release. In vitro release of the Formulation F4
was to optimized formulation, it posses to similarity factory with in
Innovator products.
KEYWORDS: IBS, Eudragit S100, Eudragit NE 30 D, Eudragit L100D 55, plasticizer.
INTRODUCTION
The controlled release drug delivery systems provide a therapeutic release of drug to the
proper site in the body to achieve and maintain the desired drug concentration. An ideal
dosage regimen in therapy of any disease is the one which immediately attains the desired
therapeutic concentration of the drug in plasma or at the site of action and maintains it
constant for the entire duration of treatment. This is usually achieved by repeated
administration of a drug in a suitable amount (dose) and at a particular frequency.[1-2]
Volume 4, Issue 8, 1324-1335. Research Article ISSN 2277– 7105
Article Received on 14 June 2015,
Revised on 05 July 2015, Accepted on 26 July 2015
*Correspondence for
Author
Dr. B.S. Venkateswaralu Department of
Pharmaceutics, Vinayaka Mission’s College of
Pharmacy Vinayaka Missions University Salem, Tamil Nadu.
An alternative approach to maintain the desired therapeutic plasma concentrations constantly
for the entire duration of treatment is the design and use of controlled release dosage forms.
Controlled release drug delivery systems are those dosage formulations designed to release an
active ingredient at rates predesigned, which differ significantly from their corresponding
conventional dosage forms. The controlled release drug delivery systems are aimed at
controlling the rate of drug delivery, sustaining the duration of therapeutic activity and/or
targeting the delivery of the drug to tissue. Drug release from these systems should be at a
desired rate predictable and reproducible. Pellets may be manufactured by using different
methods. The methods used for pelletization are essentially the same as the granulation
methods. The most widely used processes are extrusion and spheronization, solution or
suspension layering, and powder layering. Other processes with limited application in the
development of pharmaceutical palletized products include globulation, balling, and
compression.[3]
The aim and objective of the present study was to develop modified release pellets in form of
capsule. Pellets with a coating for modified release have a lower risk of dose dumping than
coated tablets. To develop modified release capsules of 24 hours release for to reduce the
dosing frequency when compared with the tablet for treating irritable bowel syndrome.
MATERIALS AND METHODS
Materials: Antispasmodic drug was received as a gift sample from Caplin Point Research Laboratory. Micro crystalline cellulose 101, Hypromellose 6 cps, Povidone K-30, Purified
Talc, Purified Talc, Eudragit L30 D 55, Eudragit NE 30 D and Eudragit S 100 gifted by FMC
Bio-polymer (India).[4-5]
Determination of λmax of pure drug: The λmax of pure drug is carried out by UV absorption spectrum by finding the maximum absorption and that absorption λmax is the
wavelength of the pure drug. (Fig.No:1)
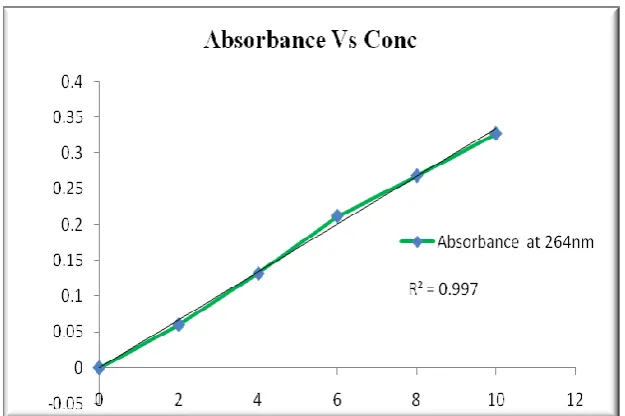
Standard Curve of Drug substance in pH 6.8 phosphate Buffer
100 mg of drug substance was dissolved in 100 ml calibrated volumetric flask and
completing to volume with pH 6.8 phosphate Buffer. From this 10ml pipette out in 100 ml
flask and this was finally diluted with pH 6.8phosphate Buffer to 10ml. The absorbance was
noted max at 264nm in UV spectrophotometer.
Standard curve of drug substance was determined by plotting absorbance V/s concentration at 264 nm, and it follows the Beer’s law. The R2
value found to be 0.997. . (Fig.No: 2)
Drug–Excipient Compatibility Study[6]
The successful formulation of a stable and effective solid dosage form depends on the careful
selection of the excipients that are added. Drug: Excipient compatibility studies carried out
with the selected excipients.
Sample preparation: Binary mixtures of the drug and excipients are prepared by placing the accurately weighed amount of the drug and excipients in polybag and mixed till homogenous
mixture is achieved. Then, these mixtures are filled in vials and closed with bromo butyl
rubber stoppers & crimped with tear off clear lacquer aluminum seals. These samples are
charged at 40°C/75% RH conditions.
Sample analysis: All vials will be inspected for the appearance, color and odour and will be recorded. The samples removed from 40°C/75% RH will be analyzed as per the Schedule.
Selection of Excipient: Based on the results of the Drug-Excipient Compatibility studies, excipients used in the formulation were selected.
Preformulation Studies[7-8]
Preformulation study relates to pharmaceutical and analytical investigation carried out
proceeding and supporting formulation development efforts of the dosage form of the drug
substance. Preformulation yields basic knowledge necessary to develop suitable formulation
for the toxicological use. It gives information needed to define the nature of the drug
substance and provide frame work for the drug combination with pharmaceutical excipients
in the dosage form.
Hence, the following preformulation studies were performed on the obtained sample of drug.
I. Organoleptic characters
II. Physical properties such as (1,2,3,4,5 & 6 table. No: 5)
1. Bulk Density (Db)
3. Angle of Repose (θ)
4. Hausner ratio
5. Carr’s index (or) % compressibility
6. Hausner ratio
The results are shown in Table. no: 5
[image:4.595.85.504.498.714.2]Drug Layering: The drug layering was done in three Trails (T1, T2 & T3)
Table No 1: Formulation trials T1 – T3 quantity are in mg/tablet.
S.No Ingredients Percentage quantity
T1 T2 T3
1 MCC Pellets 8.16 7.91 7.91
2 Drug Substance 81.63 79.13 78.02
3 Micro crystalline cellulose 101 8.16 7.91 8.59
4 Hypromellose 6 cps 0.82 3.86 ---
5 Povidone K-30 --- --- 4.19
6 Purified Talc 0.82 0.79 0.86
7 Colloidal silicon dioxide 0.41 0.40 0.43
8 Isopropyl alcohol Q.S Q.S Q.S
9 Purified water Q.S Q.S Q.S
TOTAL 100.00 100.00 100.00
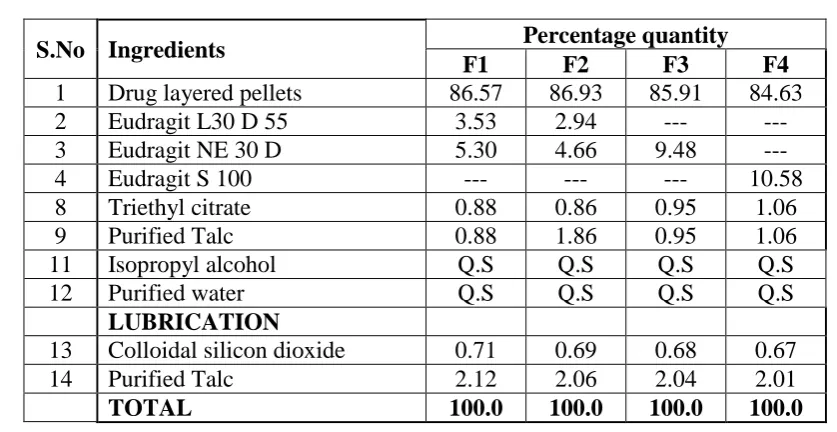
MR Coating: The drug layered pellets of Trial3 was coated with 4 trials (F1, F2, F3 & F4) with various concentration polymers.
Table No 2: Formulation trials F1 – F4
S.No Ingredients Percentage quantity
F1 F2 F3 F4
1 Drug layered pellets 86.57 86.93 85.91 84.63
2 Eudragit L30 D 55 3.53 2.94 --- ---
3 Eudragit NE 30 D 5.30 4.66 9.48 ---
4 Eudragit S 100 --- --- --- 10.58
8 Triethyl citrate 0.88 0.86 0.95 1.06
9 Purified Talc 0.88 1.86 0.95 1.06
11 Isopropyl alcohol Q.S Q.S Q.S Q.S
12 Purified water Q.S Q.S Q.S Q.S
LUBRICATION
13 Colloidal silicon dioxide 0.71 0.69 0.68 0.67
14 Purified Talc 2.12 2.06 2.04 2.01
TOTAL 100.0 100.0 100.0 100.0
Pellets were evaluated for physical characteristics like bulk density, tapped density,
compressibility index, Hausner’s ratio Table No. 6-11.
A. Particle Size Distribution
PSD was performed by sieve analysis method. The sieves are stacked one over the other in
descending order of the mesh size. Weigh the individual empty sieve and place an accurately
weighed quantity (about 10 capsules) in the sieve top. Cover the sieve at the top with the lid
provided, and place a receiver at the bottom to collect the sample after sieving. Fix and fasten
the sieves set up into the sieve shaker and set time at 10min, set the sieving speed rate at
power 10 switch on the sieve shaker. After the specified time take the sieves and weigh
individual sieve with sample and the sample weight was calculated table No: 6.
B. Weight variation
The uniformity of dosage units may be demonstrated by determining weight variation and/or
content uniformity. The weight variation method is as follows. Ten capsules are individually
weighed and the contents removed. The emptied capsules are individually weighed and the
net weight of the contents calculated by subtraction. From the results of an assay performed
as directed in the individual monograph, the content of active ingredient in each of the
capsules is determined table No: 6.
C. Content uniformity
The amount of active ingredient determined by assay is within the range of 5% to 115% of
the label claim for 9 of 10 dosage units assayed with no unit outside the range of 70% to
125% of label claim. Additional tests are prescribed when two or three dosage units are
outside of the desired range but within the stated extremes and all the capsules are within the
range of BP table No: 6
D. Moisture permeation test
The USP requires determination of the moisture permeation characteristics of single unit and
unit dose containers to assure their suitability for packing capsules.
The degree and rate of moisture penetration is determined by packing the dosage unit
together with a color revealing desiccant pellet, exposing the packaged unit to known relative
desiccating absorption of moisture) and comparing the pre and post weight of the packaged
unit table No: 6
E. Microbial examination
The test is carried out based on European Pharmacopoeia by using Pour plate method.
Prepare medium for at least 2 Petri dishes for each level of dilution. Incubate the plates
containing medium at 30 - 35ºC for 3 – 5 days and calculate the number of colonies. Take
arithmetic mean for culture medium of the counts and calculate the number of CFU (colony
forming unit) per gram or per Milliliter of product table No: 6
F. Dissolution test
For capsules place 900ml of dissolution medium in each vessel and allow the medium to
equilibrate to a temperature of 37 ± 0.5ºC .place one capsules in each of the basket and operate the apparatus at 100 rpm for specific time. With draw 10ml of the solution from each
vessel and replace with equal volume of fresh dissolution medium at specific time intervals.
Filter the solution through 0.45microns membrane filter and discard first few ml of the
filtrate. Dissolution study was carried out in pH 6.8 buffer for 1,2,4,6,8,10,12,14,16,18,20,22
& 24 hours by HPLC method table No: 7
Stability studies[13-14]
It is very essential that any product developed in the formulation department should be stable.
The regulatory agencies in different countries try to ensure that the stability studies are
carried out on the product. The formulation is subjected to accelerated stability conditions
(400C±20C/75% RH ±5%). The effects of temperature and time on the physical and chemical
characteristics of the tablet were evaluated for assessing the stability of the formulated tablets. The results indicate that there wasn’t any significant change in hardness & % drug
content. There is a significant weight gain and increased wetting time. Disintegration and in
vitro drug release was found to be increased a little more at 400C temperature. No significant
change was observed in drug content table. No:8
The international Conference on Harmonization (ICH) Guidelines titled “stability testing of
Table. No: 3: ICH guidelines for stability study
Study Storage condition Time period
Long term 25
0
C±20C/60%RH±5RH (or)
300C±20C/65%RH±5%RH 12 month
Intermediate 300C±20C/65%RH±5%RH 6 month
Accelerated 400C±20C/75%RH±5%RH 6month
RESULT AND DISCUSSION
[image:7.595.152.449.250.468.2]Determination of max of Drug substance by UV spectrum
Figure No 14 : UV Spectrum of Drug substance
The max of Drug substance is determined by UV spectrum, the graph indicates that the
maximum absorbance is observed at 264nm and it is the max of drug substance.
Table No 4: Standard curve values of Drug substance
S.No Concentration µg/ml Absorbance at 264nm
1 2 0.06
2 4 0.132
3 6 0.212
4 8 0.268
Figure No 2: Standard Curve of Drug substance
Drug: Excipient compatibility study: All the excipients which were taken for Drug: excipients compatibility study were compatible with the drug substance. Based on the study
results and Innovator product composition the following inactive excipients were selected for
formulation of the product.
Evaluation of Formulation Trials
Table No 5 : Flow Properties for Formulations F1 - F4
S.NO PARAMETERS F1 F2 F3 F4
1 Bulk density (g/ml) 0.588 0.597 0.596 0.596
2 Tapped density (g/ml) 0.635 0.635 0.643 0.643
3 Carr’s Index (%) 7.353 5.970 7.353 7.353
4 Hausner’s Ratio 1.079 1.063 1.079 1.079
Table No 6 : Particle size distribution, Moisture content values, Weight variation, Content uniformity and Microbial test for Formulations of F1 - F4
S.N*o Parameter Cumulative%
Retained of RLD*
Cumulative % Retained of Formulations
F1 F2 F3 F4
1 Sieve No#14 2.09 - - - -
2 Sieve No#16 22.18 5.86 0.02 0.02 1.22
3 Sieve No#18 49.37 61.44 7.2 72 91.38
4 Sieve No#20 68.2 84.12 93.41 91.61 99.29
5 Sieve No#25 - 93.45 96.8 95.2 100
6 Sieve No#30 89.96 96.38 99.94 98.34 100
7 Sieve No#40 99.58 100 100 100 100
8 Bowl 100 100 100 100 100
10 Weight variation 1.82% 1.65% 1.35% 1.16%
11 Content uniformity ( 200mg) 200.50 200.25 201.1 200.50
12
TAMC
(Total Aerobic Mould count)
NMT
(1000 CFU/gm) 110 105 120 90
13
TYMC (Total Yeast Mould count)
≤ 100 12 10 10 10
14 E.Coli NIL NIL NIL NIL NIL
15 Salmonella NIL NIL NIL NIL NIL
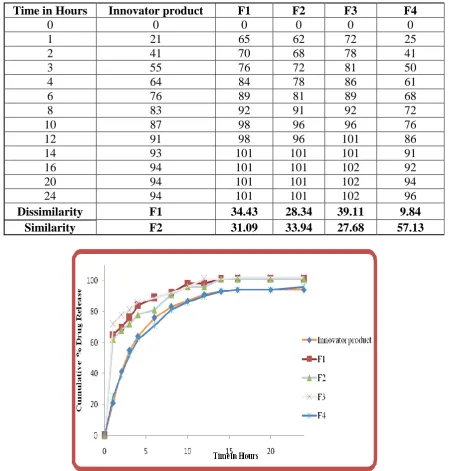
Comparative Dissolution Profile of Various Formulations Vs Innovator Product Table No 7: Comparative dissolution profile
Time in Hours Innovator product F1 F2 F3 F4
0 0 0 0 0 0
1 21 65 62 72 25
2 41 70 68 78 41
3 55 76 72 81 50
4 64 84 78 86 61
6 76 89 81 89 68
8 83 92 91 92 72
10 87 98 96 96 76
12 91 98 96 101 86
14 93 101 101 101 91
16 94 101 101 102 92
20 94 101 101 102 94
24 94 101 101 102 96
Dissimilarity F1 34.43 28.34 39.11 9.84
[image:9.595.73.523.271.743.2]Similarity F2 31.09 33.94 27.68 57.13
Stability study: The final batches were packed in PVC Alu-blisters & loaded in the stability
chambers at accelerated (40°C/75% RH) up to 3 months and at stress condition.
Table No 8: Stability Studies Test
Name
TIME
POINT Initial
40°C/75% RH
1st month 2nd month 3rd month
Dissolut ion by HPLC (%w/w)
Hours Mi n Ma x Av g RS D Mi n Ma x Av g RS D Mi n Ma x Av g RS D Mi n Ma x Av
g RSD
1 21 27 24 8.4 27 33 30 7.9 24 29 26 6.7 21 25 23 5.8
2 43 46 45 3.1 43 50 47 6.6 39 45 41 4.8 32 41 36 8.8
4 61 64 63 1.7 57 64 60 5.0 50 58 53 5.7 48 56 51 5.3
8 75 79 77 1.8 69 77 73 4.5 62 71 66 4.5 62 70 65 4.1
12 83 87 85 1.8 77 85 81 3.9 70 78 73 3.7 70 78 73 3.8
16 88 91 89 1.7 81 89 85 3.7 76 83 79 3.2 78 86 82 3.5
20 89 94 91 2.1 84 90 88 2.6 83 87 85 1.8 84 92 88 3.1
24 90 97 93 2.7 86 92 90 2.9 87 91 88 1.7 88 96 91 3.4
Related Substances by HPLC(%w/w) - (Proposed specification) Known
impurity I NMT 0.20 0.02 0.02 0.01 0.02
Known
impurity II NMT 0.20 0.01 0.01 0.01 0.01
unknown
impurity NMT 0.20 0.09 0.09 0.08 0.08
Total
impurities NMT 1.5 0.17 0.17 0.18 0.18
Water by KF
(% w/w) NMT 7.0 1.50 1.54 1.96 1.52
Assay by HPLC %w/w
NLT 90.0 and NMT
110.0
100.8 101.3 100.5 100.7%
SUMMARY AND CONCLUSION
The Dissertation work entitled, “Formulation Development and evaluation of Modified Release Antispasmodic Pellets” was carried out for the optimization of the formulation to
meet the quality standards with regard to API, excipients, manufacturing process and finished
product.
Drug-excipient compatibility studies were carried out for 3 months and the results showed
that there was no physical and chemical change in the API. This indicated that, the drug was
compatible with the formulation aspects. Hence MCC 101, Povidone K30, Purified Talc,
Colloidal silicon dioxide, Eudragit S 100, L100 D55, NE 30 D were selected as excipients
In-vitro parameter for the prepared pellets carried out such as particle size distribution by
sieve analysis, content uniformity, and weight variation test as per pharmacopoeial
specification. Moisture permeation test as per USP pharmacopoeial and microbial
examination carried out pour plate method. The result indicated the particles distribution
evenly for all the formulations. Content uniformity, weight variation test within the
pharmacopoeial specification moisture content was within the limits 1.54 to 1.67%. The
microbial examination reviewed the formulations aspects from E.Coli and Salmonella type
organism and TAMC & TYMC are within limit less then 1000 CFU/Grams and less than 100
CFU/Grams.
The Prototype formulations were developed (F1 to F4), and the F4 formulation was
optimized, the dissolution profile of the optimized batch F4 was similar to the Innovator
product.
The F4 formulation was taken for stability studies as per the ICH Guidelines, F-4 batch were
packed in PVC Blisters charged at 40ºC ± 2 / 75 ± 5 %RH for the period of three months. The
results were found satisfactory and it complies with the specifications.
ACKNOWLEDGEMENTS
Authors are thankful to Prof (Dr.).B.Jaykar, Principal Vinayaka Mission’s College of
Pharmacy, Salem, Tamil nadu and providing all the facilities for this research project.
REFERENCES
1. Tropac capsule chart, USA, 2000
2. Oral Delayed Release formulation and method of preparation, EP 0939 B1
3. Optimization of the Pelletization Process in a Fluid-Bed Rotor Granulator Using
Experimental Design, AAPS Pharm SciTech. 2002; 1(4): 35.
4. Handbook of pharmaceutical excipients, 6th edition
5. Eudragit® application guidelines 11th edition; 2009; 1 -5.
6. Swarbrick J, Boylan J.C., Encyclopedia of Pharmaceutical Technology, Second
Volume-1992; 531-536.
7. Clarke’s “Isolation and Identification of drugs”, 2nd edition, The pharmaceutical press,
London, 1986; 838.
9. Banker G.S. Anderson N.R., “Tablets” chapter 11 in “The theory and practice of industrial pharmacy” edited BY Lachman Edition, Varghese Publishing House, 1991;
296-317.
10.Fonner “Characterization of Granulation” in “Pharmaceutical dosage forms: Tablets”,
Volume. No:2, edited by Lieberman H.A., Lachman L., Marcel Dekker; Page.No:
240-249.
11.Carver, L.D.: Particle Size Analysis, Industrial Research, August1971; Page.No:39 – 43.
12.Agbada, C.O., and P.York.1994, “Dehydration of theophylline monohydrate powder
effects of particle size and sample weight”, Int. J. Pharm. 106; 33-40.
13.ICH Guideline Published by Europian Medicines agency CAMP /ICH/ 2736/99 August
2003.