Abstract—The present paper describes a numerical study on
wall-to-bed heat transfer characteristics of circulating fluidized bed (CFB) risers of cross section 0.15 (m) × 0.15 (m), 0.30 (m) × 0.30 (m), each of height 2.85 (m). 3-D CFD simulations for heat transfer characteristics were carried out under same operating conditions for heated portion (heater) of risers. For modeling and simulation, CFD code Ansys - Fluent version 13 was used.
Modeling and meshing were done using ProE and Ansys ICEM CFD software, respectively. The wall of heater was maintained at the constant heat flux q” = 1000 (W/m2). RNG k-ε model was
used for turbulence modeling. Gidaspow model for phase interaction was used for the simulation of two phase flow (air + sand mixture flow). Effect of increase in superficial velocity of air from 2.5 (m/s) to 4 (m/s) on heat transfer characteristics was studied experimentally and numerically for the CFB riser of riser of cross section 0.15 (m) × 0.15 (m). Effect of change in riser cross sectional area on heat transfer characteristics was also studied numerically when both the CFB risers were operated under same operating conditions. Results on heat transfer characteristics were obtained in terms of distribution of bed (air + sand mixture) temperature across the heater and local heat transfer coefficient along the height of the heater of the CFB risers. Results obtained through CFD simulations were compared with available experimental data which was obtained using available CFB setup of IIT Guwahati.
Index Terms— Bed temperature, CFB riser, CFD
simulations, Heat transfer coefficient.
I. INTRODUCTION
Recently use of circulating fluidized bed (CFB) boilers in power generation is gaining popularity because of its environmental compatibility and high efficiency. CFB is widely used for various industrial applications which include power generation, drying, cracking, and combustion. The increase in diversity in CFB applications demand the need for the development of more efficient experimental techniques, realistic simulations, and other research and design tools.
Versatile tool like CFD and related software’s may be therefore used to accomplish the research with accuracy and also to overcome the limitations of experimental aspects.
Manuscript received March 04, 2014; revised April 06, 2014
R.S. Patil is with the Mechanical Engineering Department, Birla Institute of Technology and Science, Pilani – K. K. Birla Goa Campus, Goa, 403726
India (corresponding author, phone: +91 9923138587; e-mail: ranjitp@ goa.bits-pilani.ac.in, [email protected]).
P. Mahanta is with the Mechanical Engineering Department, Indian
Institute of Technology, Guwahati, 781039 India (e-mail: pinak@ iitg.ernet.in).
M. Pandey is with the Mechanical Engineering Department, Indian
Institute of Technology, Guwahati, 781039 India (e-mail: [email protected]).
References [1]–[2] reported some information on turbulence parameters which was hard to obtain in laboratory conditions, but can be easily estimated using CFD tools.
Reference [3] reported dense flow hydrodynamic experiments measure either only the particle velocities or the particle concentrations until 1987.
Reference [4] reported studies on both the particle velocities and particle concentrations, which were determined together at the first time for the riser flow. Since then, modelers were able to compare and evaluate their theoretical models with experimental studies in detail [1].
Reference [5] reported on dispersed gas-solid flow with very high velocity and strong interphase interactions in a CFB riser. CFD simulation is a versatile tool to simulate two phase problems to predict heat transfer characteristics such as temperature, heat transfer coefficient, and hydrodynamic characteristics such as pressure, velocity, volume fraction.tc.
Reference [6] reported detailed discussion on the development of granular flow models.
References [7]–[9] reported the Eulerian–Eulerian (two-fluid) model with kinetic theory of granular flow, which is currently the most applicable approach to compute gas–solid flow in a CFB.
References [10]–[12] reported on different drag models, which were used to predict the most representative gas–solid interphase exchange coefficient.
Reference [13] reported on development of a model using a Particle Based Approach (PBA) to predict accurately the axial pressure profile in CFBs. This simulation model also accounts for the axial and radial distribution of voidage and the volume fraction of soild.
Reference [7] reported on gas / particle flow behavior in the riser section of a CFB, which was simulated using CFD package Fluent to predict velocity, volume fraction, pressure, and turbulence parameters for each phase.
Reference [14] reported a multifluid Eulerian model integrating the kinetic theory for solid particles using Fluent- CFD software, which was capable of predicting the gas–solid behavior of a fluidized bed. Comparison of the predictions of the models like the Syamlal–O’Brien, Gidaspow, Wen–Yu drag functions with experimental measurements on the time-average bed pressure drop, bed expansion, and qualitative gas–solid flow pattern indicates reasonable agreement for most operating conditions. Instantaneous and time-average local voidage profiles showed similarities between the model predictions and experimental results. Reference [15] reported on the gas and solid velocity, and volume fraction predicted through 2-D simulation of a CFB
riser.
Effect of Superficial Velocity of Air and Riser
Cross Sectional Area on Heat Transfer
Characteristics of Circulating Fluidized Bed
Reference [16] reported the simulations using Ansys CFX software version 10 and reported radial solid velocity profiles, computed on seven axial levels in the circular riser of a high-flux circulating fluidized bed (HFCFB) using a two phase 3-D computational fluid dynamics model.
Reference [17] reported the flow multiplicity phenomenon in circulating fluidized bed (CFB) risers, i.e. under the same superficial gas velocity and solids circulation rate, the CFB risers may sometimes exhibit multiple flow structures which was numerically and experimentally investigated.
Reference [18] reported that solid-phase wall boundary condition had little effect on axial voidage profile when the Gidaspow drag model was used. The particle–wall restitution coefficient ew plays a minor role in the holistic flow characteristics.
Literature review reveals that many researchers have reported CFD simulations based on Eulerian model to predict only hydrodynamic characteristics for two phase flow in the CFB riser.
Reference [19] however reported that there will be erosion of the lower splash region during operation of CFB boiler because lower splash region occupies dense hot stream of coal, limestone, and sand etc. For designing the entire CFB, the study on heat transfer characteristics in lower splash region is therefore equally important as like study on the hydrodynamic characteristics.Hence study in the present is based on the CFD simulations using Ansys 13 following Eulerian model to predict heat transfer characteristics of air-sand flow in the lower splash region of CFB riser of cross section 0.15 m × 0.15 m. Results obtained were compared with experimental data obtained using developed CFB facility. In the present paper, same computational methodology has been implemented for upper dilute region of risers during scale-up (increase in riser cross sectional area) study to predict the heat transfer characteristics.
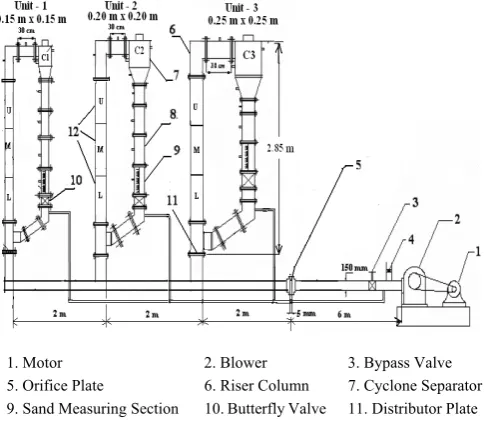
Reference [20] reported that risers of square and rectangular cross-sections are now widely employed in circulating fluidized bed applications’ in heat transfer area (boiler, biomass dryer etc). Also scale-up study is important in design point of view. Hence, there is a high demand to study the effects of scale-up on heat transfer characteristics of square cross-section risers. It is also reported that scale-up study has been performed at IIT Guwahati to predict the effect of scale-up on heat transfer characteristics using three CFB units as in Fig. 1, each of height 2.85 m with riser cross sections of 0.15 (m) × 0.15 (m), 0.20 (m) × 0.20 (m), and 0.25 (m) × 0.25 (m), respectively. However, because of limitations like requirement of extra fund and extra space in laboratory to launch new experimental CFB set up having riser of cross section 0.30 (m) × 0.30 (m), present paper approached to accomplish the further scale-up study through CFD simulations, which were performed under same operating conditions on upper dilute region of risers of different cross sectional area to predict heat transfer characteristics. Hence present paper describes computational methods to predict the effect of change in operating parameter like change in superficial velocity of air and change in geometrical parameter like change in cross sectional area of riser on heat transfer characteristics at lower denser and upper dilute region of CFB risers, respectively.
II. EXPERIMENTAL SETUP
Figure 1 presents the three CFB setups having risers of cross section area 0.15 (m) × 0.15 (m), 0.20 (m) × 0.20 (m),
and 0.25 (m) × 0.25 (m) with each riser height of 2.85 (m) designed and fabricated at IIT Guwahati [21]. Riser of CFB setup was made up of plexiglass to facilitate flow visualization. A positive displacement type blower powered by a 20 (HP) motor supplies air. Heater section’s positions are U (upper dilute or splash region of particles), M (middle dense region of particles) and L (lower splash or dense region).Experiments were conducted on the CFB unit with sand as the bed material and air as the fluidizing medium. Heat transfer characteristics along the riser were studied with incorporation of heater section in the upper and lowe splash regions; having the same cross sectional area as that of the riser (0.15 m × 0.15 m) and height of 0.6 (m). The heater section was fabricated with MS sheet of 2 (mm) thickness with a height of 0.6 (m). Nichrome wire or heater coil of 2 (kW) capacities was wound over the mica sheet of 1.5 (mm) thickness which covers the MS wall of the heater section. Another mica sheet, which acts as an electric insulator, was wrapped over the Nichrome wire. To avoid the heat losses by radiation, ceramic wool and asbestos sheets were wrapped over the assembly. Heat was supplied to the heater section with electrical supply through an auto transformer. To measure the temperature of the surface of the heater section and the bed, calibrated T- type thermocouples were installed at the same height on the wall as well as inside the heater section respectively as in Fig. 2.
1. Motor 2. Blower 3. Bypass Valve
5. Orifice Plate 6. Riser Column 7. Cyclone Separator
[image:2.595.307.550.362.573.2]9. Sand Measuring Section 10. Butterfly Valve 11. Distributor Plate
[image:2.595.378.510.598.767.2]Fig. 1 CFB Setup at IIT Guwahati
Ten set of thermocouples with equal spacing of 5.5 (cm) along the height of the heater section were used to measure the bed temperature and surface temperature of the heater section, as in Fig. 2. A section AA was taken in the lateral direction at 0.16 (m) above the inlet of the heater and another one section was taken in the lateral direction 0.44 (m) above the inlet of the heater. Five thermocouples were placed along the horizontal direction in these sections with equal spacing at the nondimensional distance [X/b] of 0.1, 0.3, 0.5, 0.7 and 0.9, respectively as in Fig. 2.
Here the nondimensional distance [X/b] is the distance X
measured from the left hand side wall of the heater to the thermocouple end, normalized with respect to the width b of the heater.
III. EXPERIMENTAL HEAT TRANSFER STUDY
Steady state experiments were conducted on the CFB setups under similar operating conditions to examine the effect of change in riser cross section on heat transfer characteristics. Experiments were carried out at superficial velocities 2.5 (m/s) and 4 (m/s) or at nondimensional velocity ratios U* (ratio of superficial velocity and minimum fluidizing velocity) of 5 and 8, particle size 460 (μm) and heat flux 1000 (W/m2). Further, experiments were conducted with certain sand inventory so that weight per unit area of distributor plate P of each CFB setup was 3050 (N/m2) maintained in each CFB unit. Experiments could not be conducted for the value of P more than 3050 (N/m2) because of constraint of maximum capacity of experimental setup (blower) to push the maximum weight of inventory of sand per unit area of distributor plate into the fast fluidization.
The local heat transfer coefficient h is calculated by
h ═ Q / [AS . (TS- TB)] (W.m-2.K-1) (1)
where Q is rate of heat supplied to the heater, measured using a Wattmeter. As is the surface area of heater, q” = Q/ As is the heat flux, T type calibrated thermocouples and data acquisition system with Dasy Lab software version 8.0 was used to measure the surface temperature TS and bulk mean bed temperature TB. The local heat transfer coefficient is measured at 10 locations (y = 1 to 10 as in Fig. 2) along the height of heater.
Average heat transfer coefficient (havg) along the heater section at its any particular location above the distributor plate is calculated by
0
1
.
Ha v g y
h
h
d y
H
(W.m-2.K-1) (2)where H is the height of the heater (0.6 m), hy is the local heat transfer coefficient. Local heat transfer coefficient (hy) is calculated at 10 different points (y = 1, 2...10 as shown in Fig. 2) along the height of heater section.
Uncertainty analysis was carried out for the heat transfer coefficient. Uncertainty is depending upon connections of thermocouples, accuracy of T type thermocouple ± 0.5 (°C), wattmeter accuracy ± 5 (W), accuracy in length measurement ± 1 (mm) etc. Uncertainty analysis, using the method of Kline and McClintok [22], showed that the heat transfer coefficients estimated in the present study were within ± 4 %.
IV. CFDMODELING AND SIMULATION
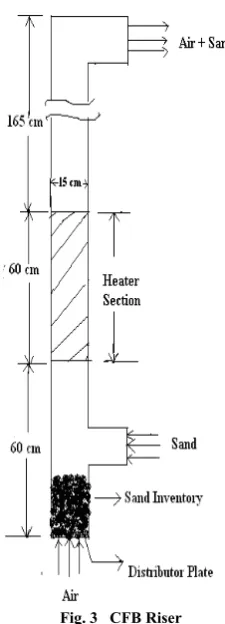
In Ansys – Fluent [23] the governing equations are discretized using the finite volume technique. The discretized equations, along with the boundary conditions, are solved to obtain a numerical solution. Eulerian multiphase model was used for the simulation of air-sand flow. 3-D CFD simulations were done on heater section (portion L, U as in Fig. 1 each of height 0.6 m). While meshing the heater, cell type selected was tetrahedral/hybrid with T grid meshing scheme. Selected boundary conditions as in Fig. 3 were air velocity at inlet, bottom of riser = 2.50 (m/s) or 4 (m/s), and volume fraction of sand = 0; volume fraction of sand at inlet at right hand side wall of riser = 1 and sand velocity = 0.00468 (m/s) or 0.0075 (m/s); outlet boundary condition was pressure outlet at top of the riser = 0 (Pa) gauge pressure of air-sand mixture. While simulating the riser in Ansys, 3D unsteady state solver was used. Other parameters selected were density of sand = 2600 (kg/m3), mean diameter of sand = 460 (µm), density of air = 1.225 (kg/m3), turbulence model used = RNG k-ε model, numerical method used for pressure velocity coupling = phase coupled SIMPLE, discretization scheme = 1st order upwind, under relaxation parameters for pressure = 0.1, density = 0.1, body forces = 0.1, momentum = 0.1, volume fraction = 0.2, energy = 0.1; convergence criteria = 0.001, solution initialization = from all zones, height of the sand inventory above the distributor plate in the different CFB risers was maintained to obtain the static pressure on distributor plate as 3050 (N/m2).
[image:3.595.371.484.454.767.2]In the Eulerian multiphase (gas-solid, two fluids) model, conservation equations of mass and momentum for both phases are developed and solved simultaneously. The link between the two phases is through the drag force in the momentum equations.
sf f s
K u u
Continuity (kth phase)
( ) ( )
1 n
u m
k k k k k pk
t p
(3)
where
k
f
for
fluid
k
s
for
solids
Momentum (fluid phase)
( f f f) ( f f f f)
f f f f sf s f f
u u u
t
p g K u u F
(4)
Momentum (solids phase)
( s s s) ( s s s s)
s s s s s sf f s s
u u u
t
p p g K u u F
(5)
Total volume fraction conservation
s
f
1
(6) Equation (3) represents the mass balance of each phase with temporal and spatial gradients on the left hand side and mass creation (m ) of the pth species (in this case, zero) by reaction or phase change. Equations (4) and (5) are momentum conservation equations for the fluid (air in this case) and solid phase, respectively. The left side represents temporal and spatial transport terms whereas the right hand side has terms for the various interaction forces involved. Note that the hydrodynamic pressure is shared by both phases and hence, the gradient of pressure (p
) is premultiplied by the respective volume fractions (
) in both equations. (
), (u
) and (g
) represent to density, velocity and acceleration due to gravity respectively. The stress term (
f) represents theshear stress in gas phase in (4). Equation (5) represents the solids phase equation, where (s) represents the shear stress term due to collision among particles.
Terms and
represent the momentum exchange or drag between the two phases in (4) and (5). These terms are equal in magnitude and opposite in sign and account for the friction at the interface between the phases. The terms (Ff) in (4) and (Fs
) in (5)
represent all other forces that may affect the flow, such as electrical, magnetic and other effects.
The drag is an effective way of representing the surface integral of all the forces that exist at the interface between the phases. Interphase momentum exchange factor of Gidaspow’s drag closure as in (7).
2.65
, , 0.687 , 2 , 2 0.8, 3 4 24
.[1 0.15.( . Re ) ]
. Re
0.8,
. .
150. 1.75. .
.
g
s g g
s f d s g s g
s
d s g s
g s
g
s g s g
s f s g
g s s
For
K C u u
d
C
For
K u u
d d
(7)
where Resand dsare the Reynolds number and diameter of solid particles respectively and other symbols have their standard meaning which already are defined.
Entire CFB riser of 0.15 m × 0.15 m was modeled and meshed with 230982 tetrahedral cells, which were selected for its simulation after grid independence test. Energy equation (8) was applied during heat transfer 3-D simulations for heater section as in Fig. 4.
.
( ) .( ( )) .(eff j j ( . )eff hj
j
E v E p k T h j v S
t
(8)where effective conductivity (keff ) and is the diffusion flux ( jj ) of species j.
The four terms of the right hand side in (8) represents energy transfer due to conduction, species diffusion, viscous dissipation and volumetric heat sources (
S
hj).Now, heat transfer simulations (by enabling energy equation) for the heater section were carried out using both multiphase models to obtain the bulk mean bed temperature (Tb) and wall temperature (Ts). Simulations were carried at constant heat flux q” = 1000 (W/m2) for different sand inventory and particle size for a superficial velocity of 4 (m/s). Local convective heat transfer coefficient h is calculated by using (1). Simulated results were compared with experimental results. Results and discussion is explained in the following section.
V. RESULTS AND DISCUSSION
A. Studies on Effects of Superficial Velocity of Air on Heat
Transfer Characteristics
Effects of superficial velocities of air on heat transfer characteristics have been presented in Figs. 4-6. Results were compared with available experimental data obtained using CFB setups of IIT Guwahati as in Fig. 1. Simulations were done in the lower splash region for the two superficial velocities of air – 2.5 (m/s) and 4 (m/s) at sand inventory of 7 (kg) i.e at static pressure of 3050 (N/m2) is due to weight of sand inventory per unit area of distributor plate.
sf s f
Fig. 4 Temperature (K) Contour for 0.15 m × 0.15 m CFB Riser at U
[image:5.595.124.247.49.283.2]= 2.5 m/s, P = 3050 N/m2
Fig. 5 Bed Temperature Distribution
Fig. 6 Axial Distribution of Heat Transfer Coefficient Sand velocity at inlet at right hand side wall of riser was 0.00468 (m/s) and 0.0075 (m/s) at U* = 5 and U* = 8 respectively for CFB unit 1. Remaining details are mentioned in section IV of present paper. Temperature counters is presented in Fig. 4. It is observed that bed temperature and heat transfer coefficient decreases with increase in superficial velocity of air. This is because sand concentration decreases across the section of the riser column and also near the wall of the heater with increase in superficial velocity of air which reduces the heat transfer from wall-to-bed due to conduction.
Fig. 7 Temperature Counter (K) – Upper Splash Region of 0.15 m × 0.15
m at U = 4 m/s and P = 3050 N/m2
Fig. 8 Temperature Counter (K) – Upper Splash Region of 0.30 m × 0.30m
at U = 4 m/s and P = 3050 N/m2
Fig. 9 Bed Temperature Distribution at a Section 2.24 m above the Distributor
Therefore bed temperature decreases with increase in superficial velocity of air, which results in increase in the driving temperature difference (TS –TB)and decrease in heat transfer coefficient, while the heat flux was held constant. The percentage difference between predicted values and experimental values was varying from 2% to 18% for bed temperature distribution and hence also for axial distribution of heat transfer coefficient, because heat flux was held same (eq. 1).
B. Studies on Effects of Riser Cross Sectional Area on
Heat Transfer Characteristics
Effects of riser cross section on heat transfer characteristics have been investigated. Riser of bed cross section 0.30 (m) × 0.30 (m) has been modeled and simulated using Ansys. Results obtained on bed temperature distribution and heat transfer coefficient have been compared with results obtained 0.15 (m) × 0.15 (m) CFB bed. Simulations have been completed for the upper splash region for both the risers with superficial velocity of air as 4 (m/s), and maintaining the pressure 3050 (N/m2) due to weight of sand inventory per unit area of the distributor plate. Eulerian multiphase model with Gidaspow phase interaction scheme was used to simulate the two phase flow. Particle size used was 460 μm and heat flux of 1000 W/m2 was applied at the walls of heater. Sand velocity at inlet at right hand side wall of risers was
Effect of bed Cross Section U* = 8, P = 3050 N/m2
295 300 305 310 315 320 325 330 335
0 0.1 0.2 0.3 0.4 0.5 0.6 0.7 0.8 0.9 1
Nondimensional Distance across Bed Width, X/ B
B
e
d Te
m
pe
ra
tur
e
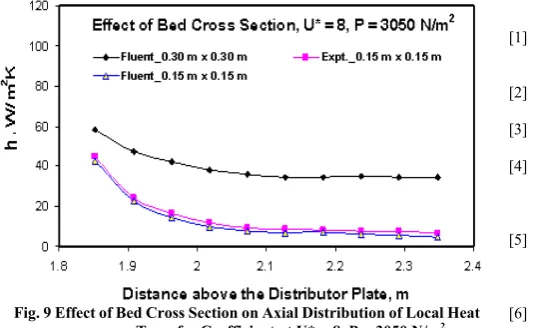
[image:5.595.50.295.314.662.2]Fig. 9 Effect of Bed Cross Section on Axial Distribution of Local Heat Transfer Coefficient at U* = 8, P = 3050 N/m2
0.0075 (m/s) at U* = 8 for CFB unit 1 (0.15 m × 0.15 m) and CFB unit of cross section 0.30 m × 0.30 m. Remaining details are mentioned in section IV of present paper. Temperature counters are presented in Figs. 7-8.
Figures 9-10 represent the bed temperature distribution across a bed cross section at 2.24 m above the distributor plate and axial variation of local heat transfer coefficient, respectively. Average bed temperature at lateral section at 2.24 m above the distributor plate was more in smaller cross section heater than larger cross section heater. This is expected because sand inventory in larger cross section CFB setup was kept proportionately more than the smaller size CFB setup so as to maintain the same weight of sand per unit area of the distributor plate. Therefore, weight of sand particles per unit surface area of the larger cross section heater was more than the smaller heater. Therefore at same heat flux applied at heater wall of each CFB setup, distribution of amount heat extracted due to conduction from wall of the heater took place into large number particles, which were comparatively more in larger cross section CFB setup, hence average bed temperature was less for lager size heater than smaller heater. It is observed that in the wall-to-bed heat transfer study, heat transfer coefficient increases with increase in bed size. This is because the driving temperature difference (TS –TB) in the larger size bed was lesser than the smaller size beds, while the heat flux was held fixed. This is because of the higher concentration of solid particles near the wall of the larger bed, and consequently, lower thermal resistance from the bed-to-wall causing better heat conduction.
VI. CONCLUSIONS
Heat transfer experiments were conducted on in-house fabricated CFB setup – at the bottom region (denser region of sand particles) via heater, and 3-D numerical simulations using Ansys. Numerical and experimental results were in good agreement for the riser of cross sectional area 0.15 m × 0.15 m. To accomplish the scale-up study, further CFD simulations were done on riser having cross sectional area 0.30 m × 0.30 m. Eulerian-Eulerian multiphase model with Gidaspow phase interaction scheme is found to be accurate model to simulate the two phase flow. Bed temperature decreases with increase superficial air velocity and riser cross sectional area. Heat transfer coefficient increases with decrease superficial velocity of air and increase in riser’s cross sectional area.
REFERENCES
[1] A. Almuttahar and F. Taghipour, “Computational fluid dynamics of high density circulating fluidized bed riser: Study of modeling parameters”, Powder Technol., vol. 185, 2008, pp.11–23.
[2] V. Ranade, Computational flow modeling for chemical reactor engineering, Acad. Press, 2002. pp. 19–20.
[3] A. Miller, D. Gidaspow, “Dense, vertical gas–solid flowin a pipe”,
AIChE J., vol. 38, 1992, pp.1801–1814.
[4] R. Bader, J. Findlay, T. Knowlton, “Gas/solid flow patterns in a 30.5-cm diameter circulating fluidized bed”, in: P. Basu, J. Large (Eds.), Circulating Fluidized bed Technology II, Pergamon Press, 1988.
[5] R.S. Patil, M. Pandey and P. Mahanta, “CFD simulations for heat transfer and hydrodynamic characteristics of circulating fluidized bed riser”, 1st International Conference on Energy Engineering and Eco- Balance (IC-EEE), MITR Pune, India, 16-18th Feb., 2009.
[6] D. Gidaspow, Multiphase flow and fluidization: continuum and kinetic theory description, Academic Press, Boston, 1994.
[7] S. Benyahia, H. Arastoopour, T. Knowlton, H. Massah, “Simulation of particles and gas flow behavior in the riser section of a circulating fluidized bed using the kinetic theory approach for the particulate phase”, Powder Technol., vol. 112, 2000, pp. 24–33.
[8] Y. Zheng, X. Wan, Z. Qian, F. Wei, Y. Jin, “Numerical simulation of the gas–particle turbulent flow in risers reactor based on k–ɛ–kp–ɛp–Θ
two fluid model”, Chem. Eng. Sci. vol. 56, 2001, pp. 6813–6822. [9] C. Chan, Y. Guo, K. Lau, “Numerical modeling of gas–particle flow
using a comprehensive kinetic theory with turbulent modulation”,
Powder Technol. vol.150, 2005, pp. 42–55.
[10] M. Syamlal, T. O, Brien, Derivation of a drag coefficient from velocity-voidage correlation, U.S. Dept. of Energy, Office of Fossil Energy, National Energy Technology Laboratory, Morgantown, West Virginia, April, 1987.
[11] D.Gidaspow,R.Bezburuah, J.Ding, “Hydrodynamics of circulating fluidized beds, kinetic theory approach”, Fluidization VII, Proceedings of the 7th Engineering Foundation Conference on Fluidization, 1992, pp. 75–82.
[12] H. Arastoopour, P. Pakdel, M. Adewumi, “Hydrodynamic analysis of dilute gas–solids flow in a vertical pipe”, Powder Technol., vol. 62, 1990, pp. 163–170.
[13] A. Gungor, “Predicting axial pressure profile of a CFB”, Chem. Eng.
Sci., vol. 140, 2008, pp. 448-456.
[14] F.Taghipour, N.Ellis and C. Wong, “Experimental and computational study of gas–solid fluidized bed hydrodynamics”, Chem. Eng. Sc., vol. 60, 2005, pp. 6857 – 6867.
[15] A. Almuttahar and F. Taghipour, “Computational fluid dynamics of a circulating fluidized bed under various fluidization conditions”,
Powder Technol., vol. 63, 2008, pp. 1696-1709.
[16] J.C.S.C. Bastos, L.M. Rosa, M. Mori, F. Marini, and W.P. Martignoni, “Modelling and simulation of a gas–solids dispersion flow in a highflux circulating fluidized bed (HFCFB) riser”, Catalysis Today, vol.130, 2008, pp. 462-470.
[17] A. Almuttahar and F. Taghipour, “Numerical and experimental studies on the flow multiplicity phenomenon for gas–solids two-phase flows in CFB risers”, Powder Technol., vol. 214, 2011, pp.177–187.
[18] X. Zhou, J. Gao, C. Xu, X. Lan, “Effect of wall boundary condition on CFD simulation of CFB risers”, Particuology, vol. 11, 2013, pp. 556 – 565.
[19] R.S Patil, M. Pandey, P. Mahanta, “Study on the heat transfer characteristics in the lower splash region of circulating fluidized bed riser”, 7th World Conference on Experimental Heat Transfer, Fluid Mechanics and Thermodynamics (ExHFT-7), Krakow, Poland, 2009, pp. 555.
[20] R.S. Patil, M. Pandey, P. Mahanta, “Parametric studies and effect of scale-up on wall-to-bed heat transfer characteristics of circulating fluidized bed risers”, Experimental Thermal and Fluid Sc., vol. 35, 2011, pp. 485–494.
[21] M.Pandey, P. Mahanta, R.S. Patil, M.V. Gawali, “Development of an experimental facility for the study of scale effects in circulating fluidized beds”, National Conference on Recent Advances in Mechanical Engineering (NCRAME), Silchar, India, 2008, pp.170-175.
[22] S.J.Kline, F.A. Mcclintok, “Describing uncertainties in single – sample experiments”, Mech. Eng. 1953, pp. 3.