Fatigue reliability using a multiple surface approach
Rui Teixeira
Researcher, Dept. of Civil Engineering, Structural and Environmental Engineering ,
Dublin, Ireland
Alan O’Connor
Professor, Dept. of Civil Engineering, Structural and Environmental Engineering ,
Dublin, Ireland
Maria Nogal
Professor, Dept. of Civil Engineering, Structural and Environmental Engineering ,
Dublin, Ireland
ABSTRACT: Reliability analysis for offshore wind turbine structural fatigue is an effort demanding task. The new trends in the design of these systems, such as, the usage of alternative computational fluid dynamics or finite element methods, are expected to further increase the effort required to assess fatigue in the design phase. There is a growing demand for techniques that enable practical fatigue design procedures.
The present paper researches on how to use fatigue damage surfaces in order to assess stress-cycle (SN) fatigue reliability. A Gaussian process predictor model is applied as a surrogate of the fatigue damage, allowing the interpolation of multiple Gaussian distributed surfaces. Probabilistic SN curves are
considered in the implementation, creating a double surface model where the Gaussian process model is built on top of the SN curve. Evaluation is performed on a 5MW turbine on a monopile foundation. Results of the implementation show that there is a significant advantage in using a surrogate of fatigue damage. These only require a limited number of time domain simulations to be defined. Moreover, the predictor surrogates accurately the design procedure within different material probabilistic
characteristics, and accounting for loading uncertainty. Fatigue reliability assessment with Gaussian process models may be performed with approximately 10% to 40% of the computational effort in relation to the fatigue assessment using binned environmental conditions .
The approach presented can be applied to any component and system, with the only requirement being the definition of a representative fatigue indicator to surrogate.
1. INTRODUCTION
Reliability analysis for offshore wind turbines (OWT) fatigue is a resource demanding task. Fa-tigue design requires the assessment of multiple op-erational scenarios that depend on different external conditions that load the OWT. Trends in the simu-lation of OWT indicate that complexity in the eval-uation of these systems is expected to increment in the future. Usage of alternative computational fluid
dynamics and finite element methods will increase the effort required to design OWT. In the particular case of fatigue, design techniques that enable prac-ticable reliability analysis are demanded.
Gaussian distributed interpolation surfaces. These work as probabilistic surrogates of the system’s op-erational SN fatigue. Implementation of a Gaussian predictor as an interpolator of SN fatigue allows the sampling of multiple design surfaces, where each generated surface encloses a probabilistically fea-sible full design assessment accordingly to Design Load Case (DLC) 1.2 of IEC61400 (IEC, 2005, 2009).
The advantage of applying this methodology is related to the need to perform only a limited number of time domain simulations, inferior to the expected number imposed by the standards, in order to assess the fatigue design. These simulations are mainly needed to characterize locally the probabilistic be-haviour of the loading.
The Gaussian process predictor model, jointly with a probabilistic SN curve, generates designs considering the probability associated with the ma-terial characteristics. The inherent probabilistic be-haviour of the structural fatigue design procedure is replicated, and the reliability of the studied OWT component quantified.
In order to enable comprehension on how to ap-ply Gaussian process predictors to evaluate SN fa-tigue reliability for OWT, applied to the tower com-ponent analysis, the following article is organized as follows; Section 2 presents a major overview on the usage of Gaussian process predictor models for reliability analysis discussing, previous works on reliability analysis, the SN fatigue design procedure and OWT modelling; Section 3 presents the theo-retical background of the meta-model studied; and Section 4 discusses the main findings of the imple-mentation performed. Finally, the main conclusions of the work developed are presented in Section 5.
2. META-MODELLING IN RELIABILITY ANALY -SIS
Gaussian process regression models have recently gained particular interest on structural reliability engineering problems (Forrester et al., 2006; Bi-chon et al., 2008; Echard et al., 2011, 2014; Yang et al., 2015).
In the case of OWT modelling, the usage of Gaussian process models in structural analysis is even more recent. In this context, Maki et al. (2012)
analyses an inland wind turbine using a Gaussian process model to decrease the effort required to evaluate the system. Yang et al. (2015) performs a reliability-based optimization of a Tripod foun-dation OWT using these as surrogates. In Morató et al. (2016) the same models are applied to eval-uate the response of an OWT to extreme loading. Teixeira et al. (2017b) discusses the application of Gaussian process models for fatigue design. Teix-eira et al. (2018b) uses a similar approach, however, investigating the importance of having a search cri-teria and a notion of improvement in the character-ization of the Gaussian process model.
When addressing fatigue calculations, Echard et al. (2013) was able, with the application of Gaus-sian process predictors, to reduce the cost of fatigue assessment by approximately a factor of 265. Yang and Wang (2012) compared the performance of a Gaussian process predictors with other meta-model when addressing fatigue of a bending stiffener.
The current paper discusses how reliability anal-ysis for OWT towers can be addressed by using a meta-model, Gaussian process model, that com-piles information from multiples sources of uncer-tainty.
2.1. OWT modelling
A 5MW turbine installed on a monopile is con-sidered for the representative analysis on meta-modelling of fatigue. This turbine, presented in more detail in Jonkman et al. (2009), is charac-terized by its wide applicability in OWT research. Some of its main generic characteristics are pre-sented in Table 1.
2.2. Stress-cycle Fatigue assessment for OWT
The most widely applied procedure to design OWT to fatigue uses the stress-cycle method. IEC (2005, 2009) certification to structural fatigue involves performing multiple time-domain evaluations of operation, assessing the operational loads, extract-ing load ranges and cycles and comparextract-ing these with the support of a specified SN curve by apply-ing the Palmgren-Miner’s rule, Equation (1).
Dt=
∑
Si
= nSi
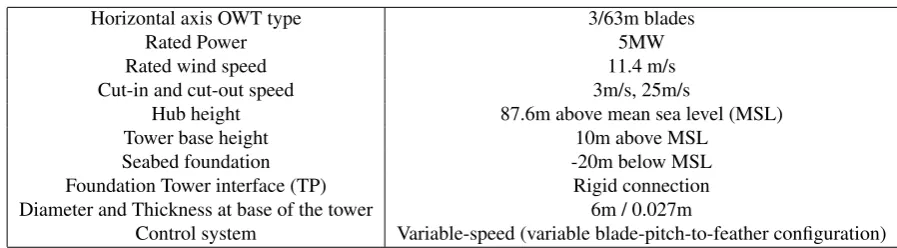
Table 1: NREL’s Monopile OWT model main generic characteristics.
Horizontal axis OWT type 3/63m blades
Rated Power 5MW
Rated wind speed 11.4 m/s
Cut-in and cut-out speed 3m/s, 25m/s
Hub height 87.6m above mean sea level (MSL)
Tower base height 10m above MSL
Seabed foundation -20m below MSL
Foundation Tower interface (TP) Rigid connection Diameter and Thickness at base of the tower 6m / 0.027m
Control system Variable-speed (variable blade-pitch-to-feather configuration)
whereDt is the damage generated in a specified
period of timet, for whichnSi is the recorded num-ber of cycles, or repetitions, of aSiload/stress range andNSi is the allowed number of cycles at Sigiven
by a specified SN curve. As the assessment is per-formed in at shorter than the lifetime T, Dt is re-ferred to as the short term SN damage rate and is used to approximate the longterm life-time fatigue (DT) for a specified design lifeT.
3. GAUSSIAN PROCESS PREDICTOR MODEL
Gaussian process predictor models, also widely known as Kriging models, approach a true func-tiong(x), depending onx⊂IRdin addimensional space, using an approximate regression function
G(x) that considers uncertainty within the regres-sion.
Assuming that g(x) can be characterized ∀x,
G(x) can be defined by using a sample of k sup-port points or observations of the true function. In the context of the Gaussian process predictors, these support points are designated as Design of Experiments (DoE); DoE = [XXX,YYY ==g(X)] with
XXX= [x1,x2, . . .xn]as a vector of realisations ofxand
YYY the respective true evaluations ofg(x).
The true response function g(x) is then be ap-proximated with
G(x) = f(βββ;x) +Z(x) (2)
f(βββ;x) =β1f1(x) +...+βpfp(x) (3)
where f(βββ;x) is a deterministic function
deter-mined by a regression model withp(p∈IN+) basis trend functions fp(x) and p regression coefficients
β to be defined by the known sample XXX.Z(x) is a
Gaussian stochastic process with zero mean that re-lates to a covariance matrixCof the support points:
C(xi,xj) =σ2R(xi,xj;θθθ); i,j=1,2,3, ...,k (4)
this matrix relates theXXX input points using; a pro-cess constant varianceσ2and a correlation function R(xi,xj;θθθ).
For the structural analysisseparableform corre-lations are widely applied (Roustant et al., 2012), Equation (5). Nevertheless, other types of correla-tion are available (Rasmussen, 2004) and may be also applied.
R(xi,xj;θθθ) = d
∏
i=1R(hi;θi), θθθ ∈IRd (5)
The correlation function depends on
h = [h1, . . . , hd], a set of incremental values of typex−xitype andθθθ hyperparameters.
For a given sample of support points the problem of prediction can then be solved through a gener-alised least squares formulation, where the estima-tors forβββ andσ2depend onθθθ.
The prediction for the true realisation g(u) in a pointuin the space is then given based on the Krig-ing expected valueµGand varianceσG2:
µG(u) = f(u)T βββ+c(u)TC−1(YYY−Fβββ) (6)
σG(u)2=σ2[1+D(u)T(FTC−1F)−1D(u)
−c(u)TC−1c(u)] (7)
D(u)≡FTC−1c(u)− f(u); (8)
with c(u) =c(u,xi), i=1,2, . . . ,k is the
trend functions evaluated at u. D(u) is introduced for the sake of brevity.
One particularity ofG(x)is that of the determin-istic prediction inX.
In order to account for the uncertainty in the DoE aτττ2component may be introduced in the
formula-tion ofC.
C(xi,xj) =C(xi,xj) +δδδ τττ.2 (9)
whereτττ2is the vector of varianceσY2of the
realiza-tions ofYYY∈g(x)used to define the surrogate model.
δδδ is the identity matrix of sizek.
4. SN FATIGUE REALIABILITY ANALYSIS US
-ING META-MODELS
A SN damage surface consists in an interpolation model where SN fatigue indicators and their un-certainty are defined through the application of a Gaussian process predictor model. Results for the implemented approach are discussed in the present section.
SN fatigue analysis and its uncertainty, in re-gard of the loading characterization, is a problem of mean. Sutherland (1999) highlighted before the sta-tistical behaviour of the SN fatigue when analysing wind turbines. SN fatigue design requires the cu-mulative responses to short-term operational condi-tions. These are commonly characterized by a load-ing spectra and, due to their repetitive and random character, a Dt probability distribution. As the op-erational conditions repeat, the cumulative distribu-tion gets in-filled by sample of Dt both above and below its short term mean value. The result is that the cumulative behaviour of the short-term damage rates approaches a sum of the mean value. There-fore, uncertainty in the SN fatigue calculations is highly related to the uncertainty in characterization of the meanDtat a specified operational conditions. This probabilistic behaviour of the SN fatigue is of interest for the application of meta-models as sur-rogates of SN fatigue.
A Latin Hypercube Sampling (LHS) scheme is applied in order to define the DoE. The LHS is one of the most widely applied techniques to gener-ate support points for meta-modelling. It allows to efficiently cover the DoE, accounting for the DoE
[image:4.595.306.549.235.541.2]probability distributions. Recorded oceanographic data, presented in Teixeira et al. (2018a), supported the definition of the LHS sampling space. The cor-relation of the LHS space was considered using the method presented in Iman and Conover (1982).
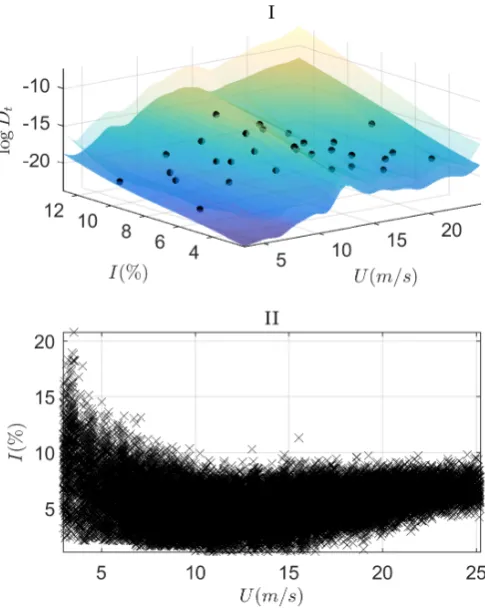
Figure 1 presents an example of a meta-model for fatigue calculations that predicts DT for the tower component.
Figure 1: (I) - Surface of damage indicators define by the short term SN fatigue. (II) - Operational prediction points to evaluate the DT.
In I a meta-model is created using a sample of support points (black markers). The expectation is for the definition of surrogate to be more efficient since only a limited subset of operational points need to be fully assessed. The meta-model acts then as a surrogate of theDt for all different operational conditions. Combined with II the lifetimeDT can be estimated without the need to perform exhaus-tive evaluations of the OWT model.
important variables that influence the response, and to define the extension of the space of variables to be assessed. Teixeira et al. (2017a) showed that the tower SN fatigue, for the turbine considered, is mostly influenced by the wind components. These are the mean wind speed (U) and the turbulence in-tensity (I). This occurs due to the relatively high stiffness of the tower component for the turbine considered, allied to the fact that it has no direct interaction with the waves. Additional considera-tions on the definition of the LHS sample are re-lated to the extent of the sampling space. At low
U, computing I at the maximum value above the rated speed (U=11.4 m/s), did not resulted in rele-vant loss of accuracy on the long term predictions. Most of the SN fatigue life decreases at operational
U above the rated speed. If no points are defined in specifiedxregions,G(x)predictions may be un-certain (have large σG2 or inaccurate µG). This is
a particular concern when overfitting occurs due to the usage large pvalues.
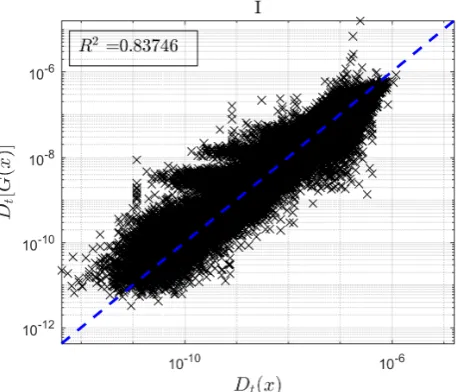
In order to implement a Gaussian process pre-dictor for reliability analysis, a representative SN curve from DNV (2014) was considered for vali-dation. A full one-year operational SN fatigue cal-culation was considered to validate the prediction given by the surrogate. A value of 0.83746 for the
R2 statistic was computed for the cross-validation between the predictions given byG(x)and the full one-year simulated operational data. The DT
pre-diction given by G(x) diverged with an error of 4.8% when comparing with the value given by the full one-year assessment. In Figure 2 it can be seen that most of the cross-validation divergence in mean value occurs at low Dt values. These have a smaller contribution toDT. It is important to
high-light that, despite R2 being a good measure of the fit, it does not account for the relative importance between evaluated points. Therefore, the absolute
DT error is a more comprehensive measure to eval-uate the fit. Nonetheless, it is noted that only in very rare occasions a big dataset is available for cross-validation.
[image:5.595.306.537.99.295.2]The uncertainty quantification model for the stress-cycle curve presented in Sørensen et al. (2008) was adopted in the current study to replicate
Figure 2: Cross validation of the tower SN fatigue pre-diction given by G(X)in comparison to a full one year assessment given by 51240 Dt evaluations at different
operational conditions. LHS of 25 points was applied to define the surrogate DoE.
the randomness of the SN curve. In order to merge the SN curve probabilistic behaviour with the un-certainty given by the SN fatigue design process (related to the procedure and loading estimation), a double surface approach is implemented.
Two main types of uncertainty are enclosed in the DoE points, the uncertainty in the mean value ofDt
due to the SN curve uncertainty, and the uncertainty in theDtdue to the sample size used to converge the
loading distribution. It is noted that further sources of uncertainty may be considered in the analysis, such as the ones described in Sørensen et al. (2008). These should be quantified when defining the indi-cators that support the characterization of the surro-gate.
IEC (2005, 2009) recommends 6 simulations with different seeds to estimate the SN contribu-tion from loading at each operacontribu-tional environmen-tal conditions. In the current assessment, 10 seeded simulation were used. The increase of the number of seeded simulations is a direct benefit of using
G(x), which reduces the computational effort of the assessment. It allows a more accurate characteriza-tion ofDt.
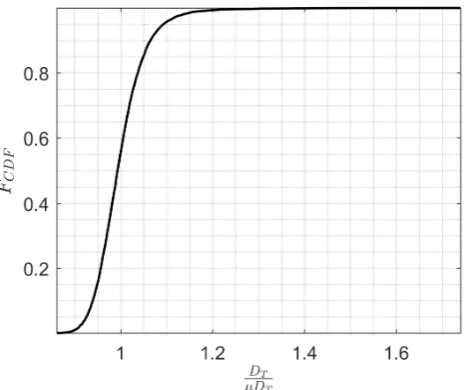
func-tion (CDF) that characterizes the probabilistic be-haviour ofDT. As the number of samples increases
[image:6.595.322.530.169.262.2]the density in the tail region also increases, and rel-atively large values of DT may be expected (when comparing with the mean value). Despite the SN curve uncertainty being modelled with a Gaussian distribution,DT is better approached with a lognor-mal model. Nevertheless, the lognorlognor-mal approxi-mation is not very accurate for tail region predic-tions. It may be of interest to truncate the data-set in the tail region in order to improve the accuracy in the probability of failure calculations. This may be particularly relevant for low probability of failures that are challenging to characterize.
Figure 3: Cumulative density function for DT, SN curve
considered from DNV (2014) withlogK1= 12.164 and
[image:6.595.52.287.322.517.2]logK2= 15.606. Distribution function was character-ized using 10000 samples.
Table 2 presents the probabilistic SN curve model applied.
The conversion from load to stress was assumed to be linearly dependent on the tower section. A finite-element model may be applied to define Dt. In alternative, the fatigue curve can be specified as a load-cycle curve (Freebury and Musial, 2000). To simplify the analysis, an uncertainty coefficient may be also considered to account for load stress conversion.
According to Sørensen et al. (2008), it is com-mon to consider in fatigue design a value ofT=60
Table 2: Random variables considered for the stress-cycle curve.logK1andlogK2are fully correlated.∆SN
is the point of slope change for the double slope SN curve. For the implementation considered, this load range was expected to occur at5×106
Variable Distribution E[ ] σ
mh D 3
-logK1 N f(∆SN) 0.20
ml D 5
-logK2 N f(∆SN) 0.25
D - Deterministic; N - Normal
years. Therefore, a T =60 is used to characterize the limit state for which fatigue failure is expected to occur. Failure occurs when DT in 60 years is larger than 1.
The probability of failure was calculated consid-ering as a function of the SN curve characteristics. As the SN curve model applied is dependent on
δSN, this variable was applied to research on the
variability of the reliability index (β) for different
curves. Figure 4 presents the results for tower’s β
depending on the∆SN.
Figure 4: Reliability index of the tower function of∆S
considering a T of 60 years. 100000 samples were applied to converge the DT distribution for each value
of∆SN. β=3.8is equivalent to a probability of failure of 1 in 10000.
[image:6.595.305.543.462.661.2]fol-lows; the DoE ofG(x)is defined considering mul-tiple SN curves accordingly to the probabilistic SN curve model,G(x)is characterized using the mean and the standard deviation of the DoE output, re-liability calculations consider sampling of design surfaces. The design surfaces are sampled from
G(x)∀x and used to predict operational DT. Each design surface is a deterministic realisation ofG(x). As the surrogate encloses uncertainty due to the SN curve and the loading sample, the damage surfaces sampled and used to predict DT replicate its
un-certainty. This sampling approach is no different than designing to SN fatigue accordingly to (IEC, 2005, 2009). Every sampled damage surface real-isation replicates a design procedure, as if the de-signer would perform 10 simulations at each envi-ronmental loading conditions and assess SN fatigue using one of the potential SN curves within the un-certainty considered.
Other variables of interest could be applied in or-der to characterize β. The sample size applied to
defined the DoE points is an example of ab indepen-dent variable within the model build that could be considered. In alternative, the presented example could be extended to consider other environmental variables. In the performed evaluation, the main in-terest was to present howG(x) may be applied for efficient reliability assessments.
The notorious advantage of using the G(x) pre-dictor for reliability analysis is mainly related to the computational cost. For the space considered, if bins of value 1 were used to divide the envi-ronmental conditions for U and I, 253 load cases would be needed to characterize the SN fatigue sign. With bins of value 2, this number would de-creases to 72 load cases. For the current applica-tion, only 25 load cases were assessed to design the OWT tower component to SN fatigue, 10% to 40% of the binned cases. Moreover, all the probabilis-tic information about the problem is compiled on a model that is able to predict operation while enclos-ing uncertainty.
To conclude, it is of relevance to highlight the universal character of the approach presented. It may be applied to design any component of any system. It is not exclusive to OWT. The only
re-quirement is to be able to define a representative indicator to build the meta-model, such asDt.
5. CONCLUSIONS
Application of Gaussian process predictor models as surrogates of stress-cycle fatigue was researched. These models were applied before as meta-models to mitigate the cost of the stress-cycle fatigue anal-ysis. In the present implementation they are also applied to enable efficient reliability assessments. Their capability to account for uncertainty is of in-terest for probabilistic calculations.
Two main probabilistic variables were consid-ered in the characterization of the meta-model. These relate to the material resistance and loading spectra definition. The main purpose of the assess-ment was to present how Gaussian process predic-tor models could be applied in probabilistic fatigue calculations. In addition, it is important to highlight that other sources of uncertainty may be considered in further applications.
Results showed that Gaussian process predictor models are efficient and accurate surrogates of the fatigue design. Their implementation allowed to reduce the computational time of the assessment from 251, and 72, to 25 load cases with minimum loss of accuracy. Moreover, their definition may enclose uncertainty in the design of experiments points, which can be interpolated over all the op-erational points allowing efficient reliability assess-ments. With the meta-model definition it is possible to sample the long-term fatigue cumulative distri-bution with limited computational cost. Research on the design variables and on the probability of failure can then be performed to enable comprehen-sive designs.
ACKNOWLEDGEMENTS
This work has received funding from the European Union Horizon 2020 R&D programme under the Marie Sklodowska-Curie grant agreement No. 642453.
6. REFERENCES
DNV (2014). “Design of offshore wind turbine struc-tures.” Offshore Standard DNV-OS-J101, DNV GL AS.
Echard, B., Gayton, N., and Bignonnet, A. (2014). “A reliability analysis method for fatigue design.” Inter-national Journal of Fatigue, 59, 292 – 300.
Echard, B., Gayton, N., and Lemaire, M. (2011). “Ak-mcs: an active learning reliability method combin-ing krigcombin-ing and monte carlo simulation.” Structural Safety, 33(2), 145–154.
Echard, B., Gayton, N., Lemaire, M., and Relun, N. (2013). “A combined importance sampling and krig-ing reliability method for small failure probabilities with time-demanding numerical models.”Reliability Engineering & System Safety, 111, 232–240.
Forrester, A., Keane, A. J., and Bressloff, N. (2006). “Design and analysis of" noisy" computer experi-ments.”AIAA journal, 44(10), 2331.
Freebury, G. and Musial, W. (2000). “Determining equivalent damage loading for full-scale wind turbine blade fatigue tests.”ASME Wind Energy Symposium, 50.
IEC (2005). “Wind turbines part 1: Design re-quirements.”Report No. 61400-1, International Elec-trotechnical Commission, Geneva, Switzerland.
IEC (2009). “Wind turbines part 3: Design requirements for offshore wind turbines.” Report No. 61400-3, International Electrotechnical Commission, Geneva, Switzerland.
Iman, R. L. and Conover, W.-J. (1982). “A distribution-free approach to inducing rank corre-lation among input variables.” Communications in
Statistics-Simulation and Computation, 11(3), 311–
334.
Jonkman, J., Butterfield, S., Musial, W., and Scott, G. (2009). “Definition of a 5-mw reference wind turbine for offshore system development.” National Renew-able Energy Laboratory, Golden, CO, Technical
Re-port No. NREL/TP-500-38060.
Maki, K., Sbragio, R., and Vlahopoulos, N. (2012). “System design of a wind turbine using a multi-level optimization approach.”Renewable Energy, 43, 101– 110.
Morató, A., Sriramula, S., and Krishnan, N. (2016). “Reliability analysis of offshore wind turbine support structures using kriging models.”Proc. ESREL
Con-ference, Glasgow, September.
Rasmussen, C. (2004). “Gaussian processes in machine learning.” Advanced lectures on machine learning, Springer, 63–71.
Roustant, O., Ginsbourger, D., and Deville, Y. (2012). “Dicekriging, diceoptim: Two r packages for the analysis of computer experiments by kriging-based metamodeling and optimization.” Journal of Statisti-cal Software.
Sørensen, J. D., Frandsen, S., and Tarp-Johansen, N. J. (2008). “Effective turbulence models and fatigue reli-ability in wind farms.”Probabilistic Engineering Me-chanics, 23(4), 531–538.
Sutherland, H. (1999). “On the fatigue analysis of wind turbines.” Report no., Sandia National Labs., Albu-querque, NM (US); Sandia National Labs., Liver-more, CA (US).
Teixeira, R., Nogal, M., and O’Connor, A. (2018a). “On the suitability of the generalized pareto to model ex-treme waves.”Journal of Hydraulic Reasearch, 56(6), 755–770.
Teixeira, R., O’Connor, A., and Nogal, M. (2018b). “Convergence analysis for offshore wind turbine op-erational fatigue reliability analysis.” Proc. IALCCE Conference, Ghent.
Teixeira, R., O’Connor, A., Nogal, M., Krishnan, N., and Nichols, J. (2017a). “Analysis of the design of experiments of offshore wind turbine fatigue reliabil-ity design with kriging surfaces.”Procedia Structural Integrity, number 5, 951-958.
Teixeira, R., O’Connor, A., Nogal, M., Nichols, J., and Spring, M. (2017b). “Structural probabilistic assess-ment of offshore wind turbine operation fatigue based on kriging interpolation.” Proc. ESREL Conference, Portoroz.