Open Access
Research article
Diabetes-specific genetic effects on obesity traits in American
Indian populations: the Strong Heart Family Study
Nora Franceschini*
1, Laura Almasy
2, Jean W MacCluer
2, Harald HH Göring
2,
Shelley A Cole
2, Vincent P Diego
2, Sandra Laston
2, Barbara V Howard
3,
Elisa T Lee
4, Lyle G Best
5, Richard R Fabsitz
6and Kari E North
1,7Address: 1Department of Epidemiology, University of North Carolina, Chapel Hill, NC, USA, 2Department of Genetics, Southwest Foundation for Biomedical Research, San Antonio, TX, USA, 3MedStar Research Institute, Washington, DC, USA, 4Center for American Indian Health Research, College of Public Health, University of Oklahoma Health Sciences Center, Oklahoma City, OK, USA, 5Missouri Breaks Industries Research, Inc., Timber Lake, SD, USA, 6Epidemiology and Biometry Program, National Heart, Lung and Blood Institute, Bethesda, MD, USA and 7Center for Genome Sciences, University of North Carolina, Chapel Hill, NC, USA
Email: Nora Franceschini* - [email protected]; Laura Almasy - [email protected]; Jean W MacCluer - [email protected]; Harald HH Göring - [email protected]; Shelley A Cole - [email protected]; Vincent P Diego - [email protected]; Sandra Laston - [email protected]; Barbara V Howard - [email protected]; Elisa T Lee - [email protected]; Lyle G Best - [email protected]; Richard R Fabsitz - [email protected]; Kari E North - [email protected]
* Corresponding author
Abstract
Background: Body fat mass distribution and deposition are determined by multiple environmental and
genetic factors. Obesity is associated with insulin resistance, hyperinsulinemia, and type 2 diabetes. We previously identified evidence for genotype-by-diabetes interaction on obesity traits in Strong Heart Family Study (SHFS) participants. To localize these genetic effects, we conducted genome-wide linkage scans of obesity traits in individuals with and without type 2 diabetes, and in the combined sample while modeling interaction with diabetes using maximum likelihood methods (SOLAR 2.1.4).
Methods: SHFS recruited American Indians from Arizona, North and South Dakota, and Oklahoma.
Anthropometric measures and diabetes status were obtained during a clinic visit. Marker allele frequencies were derived using maximum likelihood methods estimated from all individuals and multipoint identity by descent sharing was estimated using Loki. We used variance component linkage analysis to localize quantitative trait loci (QTLs) influencing obesity traits. We tested for evidence of additive and QTL-specific genotype-by-diabetes interactions using the regions identified in the diabetes-stratified analyses.
Results: Among 245 diabetic and 704 non-diabetic American Indian individuals, we detected significant
additive gene-by-diabetes interaction for weight and BMI (P < 0.02). In analysis accounting for QTL-specific interaction (P < 0.001), we detected a QTL for weight on chromosome 1 at 242 cM (LOD = 3.7). This chromosome region harbors the adiponectin receptor 1 gene, which has been previously associated with obesity.
Conclusion: These results suggest distinct genetic effects on body mass in individuals with diabetes
compared to those without diabetes, and a possible role for one or more genes on chromosome 1 in the pathogenesis of obesity.
Published: 14 October 2008
BMC Medical Genetics 2008, 9:90 doi:10.1186/1471-2350-9-90
Received: 8 January 2008 Accepted: 14 October 2008 This article is available from: http://www.biomedcentral.com/1471-2350/9/90
© 2008 Franceschini et al; licensee BioMed Central Ltd.
This is an Open Access article distributed under the terms of the Creative Commons Attribution License (http://creativecommons.org/licenses/by/2.0), which permits unrestricted use, distribution, and reproduction in any medium, provided the original work is properly cited.
Background
Body fat mass distribution and deposition are determined by multiple environmental and genetic factors. Obesity is associated with insulin resistance, hyperinsulinemia, and incident type 2 diabetes [1,2]. Moreover, insulin has ana-bolic effects on fat metabolism leading to fat deposition and obesity [3]. Obesity and diabetes are highly prevalent in American Indian populations. Among individuals between 45 and 74 years who were recruited into the Strong Heart Study, approximately 35% were obese [4] and type 2 diabetes prevalence varied by recruiting center from 33% in South and North Dakota men to 72% in Ari-zona women [5]. The estimated age-adjusted rates of dia-betes were higher in recruiting centers with a higher prevalence of obesity [5].
Diabetes and obesity are associated with increased mor-bidity and mortality in the general population [6] and among American Indian subjects, and they account for increased incident hypertension [7], and fatal and nonfa-tal cardiovascular disease (CVD) events [8]. The identifi-cation of genes for obesity in the environmental and genetic milieu of type 2 diabetes may bring us one step closer to the identification of the functional genes that influence susceptibility to obesity, a major public health problem among American Indian populations.
The genetic component of obesity-related traits among American Indians has been previously described [9-11]. In our previous work [11], we identified evidence for dis-tinct genetic effects on obesity related traits in diabetic compared to non-diabetic Strong Heart Family Study (SHFS) participants. A significant additive genotype-by-diabetes interaction was observed for body mass index (BMI), waist-to-hip ratio (WHR) and percent body fat. The purpose of the present study is to localize these genetic effects on obesity-related traits while accounting for interaction with diabetes status.
Methods
The SHFS recruitment and genotyping methods have been described elsewhere [12,13]. Briefly, American Indian subjects from 13 tribes were recruited from centers located in Arizona, Oklahoma and North and South Dakota. Clinical information and laboratory measures were obtained during a study exam. Anthropometric measures of body weight (kg) and height (m) were used to estimate BMI (kg/m2). WHR (in cm) was also recorded. Percentage body fat was measured using Quantum II bioelectric impedance (RJL Systems, Clinton Township, MI) [12]. The percentage of body fat was calculated using a formula based on total body water [13]. Type 2 diabetes was defined as a fasting blood glucose of 126 mg/dl or higher, history of diabetes or use of diabetic medications [14]. The SHFS protocols were approved by the Indian Health
Service Institutional Review Board (IRB), the IRBs from participating institutions and by the 13 tribes participat-ing in these studies. The study was conducted in accord-ance with the principles of the Declaration of Helsinki. Written consent was obtained from all individuals of this study.
Participants, who are members of extended families, were genotyped for approximately 400 microsatellite markers spaced at average 10 cM intervals across the autosomal chromosomes. Pedigree relationships were verified using the Pedigree Relationship Statistical Tests program [15], which employs likelihood-based inference statistics for genome-wide identity-by-descent (IBD) allele sharing. Mendelian inconsistencies and spurious double recom-binants were detected using the SimWalk2 program [16]. The overall blanking rate for both types of errors was less than 1% of the total number of genotypes for Arizona, Dakota and Oklahoma. Marker allele frequencies were estimated using maximum likelihood methods estimated from all individuals [17] and multipoint IBD sharing was estimated using Loki software [18].
We conducted a genome scan of obesity traits while mod-eling interaction with diabetes status using maximum likelihood methods implemented in SOLAR 2.1.4. We studied 976 individuals from extended families enrolled between 1998 and 1999 (SHS phase 3). We examined the distribution of the obesity-related quantitative traits of body weight, BMI, WHR and percentage of body fat, and excluded observations greater than 2.5 standard devia-tions above or below the mean (< 5 observadevia-tions excluded). The traits were adjusted for the effects of age, age2, sex, age-by-sex interaction and study center using linear regression models and an alpha = 0.05. The WHR trait was scaled for analysis by multiplying by 10. We examined the evidence for additive genotype-by-dia-betes interaction on obesity traits using maximum likeli-hood variance decomposition methods extended to allow for the genetic covariance between diabetic and non-dia-betic subjects [19,20]. We tested the hypothesis of interac-tion using the likelihood ratio test comparing a model including genotype-by-diabetes interaction to restricted models in which such interaction is excluded. We esti-mated the genetic correlation between diabetic and non-diabetic individuals (ρG) and the genetic standard devia-tions for diabetic and non-diabetic subjects. To test for dif-ferential additive genetic effects among diabetic and non-diabetic subjects, we compared a model in which ρG (dia-betic, non-diabetic) =1 to a model without constraints. To test for differences in the magnitude of the genetic effects among diabetic and non-diabetic subjects, we compared a model in which the genetic standard deviations of the two groups are constrained to be equal to a model without
these constraints. We considered evidence for genotype-by-environment interaction if the genetic correlation between diabetics and non-diabetics was different than 1 and/or the genetic variance for obesity traits in diabetics was significantly different than in non-diabetics.
We also tested for QTL-specific diabetes-by-obesity inter-action. For these analyses, we compared a model in which the QTL standard deviations are constrained to be equal, to a model without constraints, using the likelihood ratio statistics. When comparing models with variances con-strained to be equal, interpretation of significant differ-ences were based on the assumption of an asymptotic chi-square distribution for the likelihood test statistic. For models that restricted the genetic correlation to one (the upper boundary of the parameter space, i.e., ρG = 1.0), the test statistic is asymptotically distributed as a 50:50 mix-ture of a chi-square and a point mass at 0 [19]. The gene-by-environment analysis has an additional QTL variance component compared with the standard linkage model, therefore we corrected for the increase in degrees of free-dom and all reported LOD scores are corrected LOD score [21].
For the obesity traits showing significant additive geno-type-by-diabetes interaction at alpha = 0.05 (ρG ≠ 1), we performed genome scans accounting for the diabetes interaction. We adjusted the obtained LOD scores for the difference in the number of parameters between the poly-genic and linkage versions of the interaction model, tak-ing into account that each of the QTL standard deviations has a boundary at the null hypothesis.
We used the University of California Santa Cruz http:// genome.ucsc.edu and the miRBase database http://micro rna.sanger.ac.uk/ websites to search for candidate genes and microRNAs.
Results
Over 10,000 relative-pairs were available for analysis (Table 1). Approximately 57% of participants were obese (BMI > 30 kg/m2) and 26% had diabetes (Table 1).
Indi-viduals with diabetes had higher mean weight, BMI, WHR and percentage of body fat than those without diabetes. Approximately 62% of diabetic subjects were using oral hypoglycemic drugs or insulin therapy.
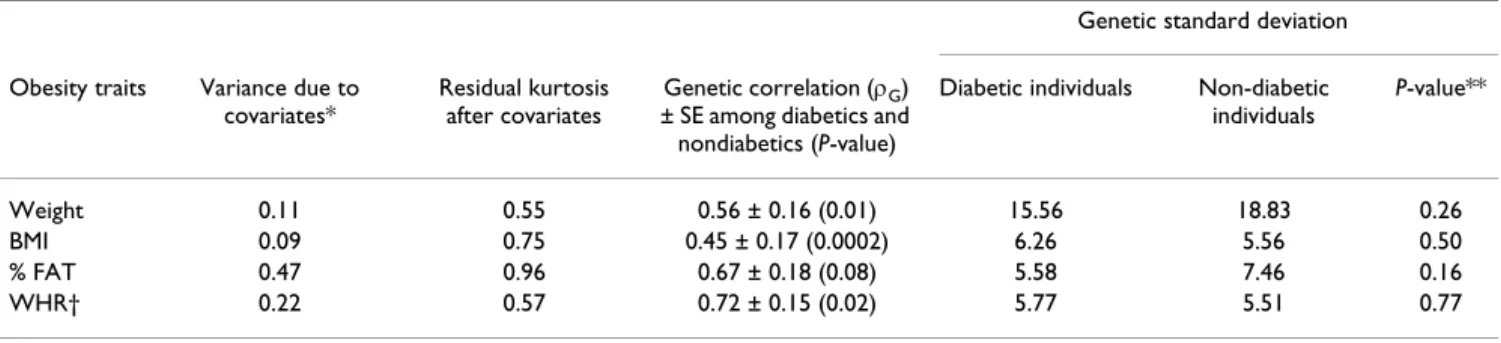
We detected significant additive genotype-by-diabetes interaction for weight (ρG ≠ 1, p = 0.01), BMI (p = 0.0002) and WHR (p = 0.02), suggesting that at least some of the genes influencing these obesity traits differed in diabetic compared to non-diabetic subjects (Table 2).
Analysis accounting for the genotype-by-diabetes interac-tion identified a QTL for weight on chromosome 1 at 242 cM (marker D1S249, LOD = 3.7) (Figure 1). For compar-ison, the diabetes-specific signal at 1q32 for other obesity-related traits is also shown in Figure 1. Stratified analyses by diabetes showed that the chromosome 1 signal was more prominent in diabetic subjects (LOD = 2.7) (Figure 2). The 1-LOD support interval was between D1S238 and D1S425 covering the regions 1q31.1-q32.2, and approxi-mately 23.8 MB. Additional QTLs identified in our linkage analysis of obesity traits accounting for diabetes status are reported in the Additional file 1.
We then evaluated the evidence for genotype-by-diabetes interaction at the QTL level, using the combined samples of diabetic and non-diabetic individuals and the maxi-mum LOD score QTL identified on the diabetes-stratified analysis. The QTL- specific genotype-by-diabetes interac-tion was significant for weight on chromosome 1 at 242 cM (p for interaction < 0.001).
Discussion
This study identified a diabetes-specific QTL for body weight on chromosome 1 among American Indians, which was less prominent for BMI and for the fat distribu-tion trait of WHR. Diabetes and obesity are strongly asso-ciated in American Indian and other populations, and environmental factors such as diet and lifestyle play an important role in both conditions. Our findings suggest a role for diabetes-specific genes influencing body fat depo-sition in American Indians. Further studies are required to
Table 1: Descriptive characteristics of American Indian subjects by diabetes status
Overall participants Diabetic individuals Non-diabetic Individuals
Number 976 255 721
Mean age (SD) 42 (16) 53 (14) 38 (15)
Sex female/male 563/400 156/94 407/306
Mean Weight (kg) (SD) 88.7 (20.9) 91.4 (20.4) 87.7 (21.0)
Mean BMI (kg/m2) (SD) 31.8 (7.0) 33.7 (6.6) 31.1 (7.0)
Mean % body fat (SD) 36.5 (9.8) 38.4 (8.6) 35.9 (10.1)
Mean WHR (SD) 0.93 (0.09) 0.97 (0.06) 0.92 (0.09)
Number of relative-pairs 10,271 598 6,303
explore the generalizability of these findings to popula-tions of different ethnic/racial and cultural backgrounds, in which the prevalence of obesity and diabetes vary from American Indians. Nevertheless, our findings suggest that the genetic susceptibility to obesity and type 2 diabetes may share common genetic pathways, by complex inter-actions of genes influencing obesity in the milieu of dia-betes.
Several prior studies have showed linkage to the chromo-some 1 region for diabetes-related traits and obesity [22], although genetic interactions have not been explored at this QTL. The 1q32 region was identified in linkage anal-ysis of type 2 diabetes in African American participants of the Hypertension Genetic Epidemiology Network (Hyper-GEN) (LOD = 1.9) [23]. Among non-diabetic individuals, linkage to this QTL was described in studies of fasting
glu-Table 2: Additive genotype-by-diabetes interaction for obesity related quantitative traits in American Indian participants of the Strong Heart Family Study
Genetic standard deviation Obesity traits Variance due to
covariates*
Residual kurtosis after covariates
Genetic correlation (ρG) ± SE among diabetics and nondiabetics (P-value)
Diabetic individuals Non-diabetic individuals P-value** Weight 0.11 0.55 0.56 ± 0.16 (0.01) 15.56 18.83 0.26 BMI 0.09 0.75 0.45 ± 0.17 (0.0002) 6.26 5.56 0.50 % FAT 0.47 0.96 0.67 ± 0.18 (0.08) 5.58 7.46 0.16 WHR† 0.22 0.57 0.72 ± 0.15 (0.02) 5.77 5.51 0.77
BMI, body mass index; WHR, waist-to-hip ratio; FAT, body fat; SE, standard error. * age, sex, center; ** P-values for the likelihood ratio comparing a model in which the genetic variances for obesity traits in diabetics and non-diabetics are equal to a model without constrains. †The trait was scaled by multiplying by 100.
Multipoint LOD Scores on Chromosome 1 for Obesity Traits Accounting for Diabetes Interaction
Figure 1
Multipoint LOD Scores on Chromosome 1 for Obesity Traits Accounting for Diabetes Interaction. Adjusted for
age, age2, sex, age-by-sex interaction within centers.
Loci (cM) 0 50 100 150 200 250 300 LOD scores 0 1 2 3 4 Weight (kg) BMI (kg/m2) Waist-to-hip Maximal LOD = 3.7 at 242 cM Near marker D1S249
cose among Pima Indians (LOD = 1.5) [24] and among participants of the Framingham Offspring Study (LOD = 1.8) [25], and in studies of fasting insulin among Hyper-GEN males (LOD = 2.1) [26]. In addition, a West African study of type 2 diabetic sib-pairs described a LOD score of 1.6 for BMI and 1.5 for fat mass (estimated by bioelectric impedance), between the 1q25.1-q31.1 regions, which are within the 1-LOD score support region of our linkage peak [22]. Participants in this West African study were about 5 BMI units heavier than the population from which they were enrolled [22].
Within the 1-LOD support region lays the ADIPOR1 gene. The adiponectin 1 receptor mediates adiponectin effects on fatty acid oxidation and glucose uptake through activa-tion of AMP-activated protein kinase and peroxisome pro-liferator-activated receptor-α [27]. ADIPOR1 deficient (-/-) mice show increased adiposity and decreased glucose tolerance, associated with decreased locomotor activity and energy expenditure [27]. ADIPOR1 variants have been associated with type 2 diabetes, pre-diabetes states and measures of obesity although not in all studies [28-33]. For example, among Caucasian obese individuals (mean BMI 32 kg/m2) with impaired glucose tolerance,
ADIPOR1 SNPs were associated with measures of body
size including weight, waist, hip circumference and BMI [30]. In addition, a gene-gene interaction of ADIPOR1 and ADIPONECTIN was observed in increased overall and abdominal adiposity and higher substrate oxidation [34]. Therefore, ADIPOR1 is a potential candidate gene for plei-otropic effects on obesity and diabetes susceptibility in humans.
It is difficult to gauge the LOD score evidence reported herein in the face of the number of comparisons made in conducting gene-by-diabetes genome scans. In total, we conducted three genome scans (a minimum model, a maximal model and an interaction model). If we were to use a too conservative Bonferoni correction, we would need to observe a P = 0.05/3 * 380 markers: P = 0.00004 or a corresponding LOD score of 3.7. However, given the correlation and non-independence of the three genome scans of each obesity trait, a systematic correction would be extremely difficult.
Multiple interacting genes may underlie this QTL on chro-mosome 1, and therefore, densely genotyping this region is the next logical step to be taken to identify these genes
Multipoint LOD Scores on Chromosome 1 for Weight by Diabetes Status
Figure 2
Multipoint LOD Scores on Chromosome 1 for Weight by Diabetes Status. Adjusted for age, age2, sex, age-by-sex interaction within centers.
Loci (cM) 0 50 100 150 200 250 300 LOD Score 0 1 2 3 4 Diabetes No Diabetes QTL specific interaction P<0.001 at 242 cM Maximal LOD = 2.7
1 LOD support interval between D1S238 and D1S425 (1q31.1-q32.3)
influencing obesity in the context of diabetes. Our find-ings are limited to American Indian populations and should be validated in replication samples of other popu-lations.
Conclusion
In summary, we identified a diabetes-specific QTL on chromosome 1 at 242 cM for weight in American Indians, in the region where the ADIPOR1 gene is located. This gene has been associated with multiple measures of body size and diabetes-related traits in humans and experimen-tal models and, therefore, it is likely a good candidate for susceptibility to fat deposition in diabetic individuals. Importantly, our findings support that this region of the genome likely harbors susceptibility variants for obesity that are importantly different in type 2 diabetes individu-als and those with normal glucose metabolic profile. Thus, future studies should more comprehensively evalu-ate the ADIPOR1 gene, especially with respect to the com-plex relationship between body weight and type 2 diabetes.
Competing interests
The authors declare that they have no competing interests.
Authors' contributions
NF, JWM and KN participated in the design of the study and drafted the manuscript. NF and HHHG performed the statistical analysis. SAC and SL carried out the molec-ular genetic studies. VPD, BVH, ETL, LGB and RRF con-tributed with acquisition of data and revision of the manuscript. All authors read and approved the final man-uscript.
Additional material
Acknowledgements
We thank the Strong Heart Family Study participants, the Indian Health Service hospitals and clinics staff, the directors of the SHS clinics and the many collaborators and staff of the Strong Heart Study. The opinions expressed in this paper are those of the author(s) and do not necessarily reflect the views of the Indian Health Service.
This research was funded by a cooperative agreement that includes grants U01 HL65520, U01 HL41642, U01 HL41652, U01 HL41654, and U01 HL65521 from the National Heart, Lung, and Blood Institute. Development of SOLAR and the methods implemented in it are supported by US Public Health Service grant MH059490 from the National Institutes of Health. Dr Franceschini is supported by the AHA #0675001N grant.
References
1. Ford ES, Williamson DF, Liu S: Weight change and diabetes inci-dence: findings from a national cohort of US adults. Am J
Epi-demiol 1997, 146(3):214-222.
2. Resnick HE, Valsania P, Halter JB, Lin X: Relation of weight gain and weight loss on subsequent diabetes risk in overweight adults. Journal of epidemiology and community health 2000, 54(8):596-602.
3. Unger RH: Lipid overload and overflow: metabolic trauma and the metabolic syndrome. Trends in endocrinology and
metab-olism: TEM 2003, 14(9):398-403.
4. Welty TK, Lee ET, Yeh J, Cowan LD, Go O, Fabsitz RR, Le NA, Oopik AJ, Robbins DC, Howard BV: Cardiovascular disease risk factors among American Indians. The Strong Heart Study. Am J
Epi-demiol 1995, 142(3):269-287.
5. Lee ET, Howard BV, Savage PJ, Cowan LD, Fabsitz RR, Oopik AJ, Yeh J, Go O, Robbins DC, Welty TK: Diabetes and impaired glucose tolerance in three American Indian populations aged 45–74 years. The Strong Heart Study. Diabetes Care 1995, 18(5):599-610.
6. Must A, Spadano J, Coakley EH, Field AE, Colditz G, Dietz WH: The disease burden associated with overweight and obesity. Jama 1999, 282(16):1523-1529.
7. Wang W, Lee ET, Fabsitz RR, Devereux R, Best L, Welty TK, Howard BV: A longitudinal study of hypertension risk factors and their relation to cardiovascular disease: the Strong Heart Study. Hypertension 2006, 47(3):403-409.
8. Howard BV, Lee ET, Cowan LD, Devereux RB, Galloway JM, Go OT, Howard WJ, Rhoades ER, Robbins DC, Sievers ML, et al.: Rising tide of cardiovascular disease in American Indians. The Strong Heart Study. Circulation 1999, 99(18):2389-2395.
9. Almasy L, Goring HH, Diego V, Cole S, Laston S, Dyke B, Howard BV, Lee ET, Best LG, Devereux R, et al.: A novel obesity locus on chromosome 4q: the Strong Heart Family Study. Obesity
(Sil-ver Spring) 2007, 15(7):1741-1748.
10. Diego VP, Goring HH, Cole SA, Almasy L, Dyer TD, Blangero J, Dug-girala R, Laston S, Wenger C, Cantu T, et al.: Fasting insulin and obesity-related phenotypes are linked to chromosome 2p: the strong heart family study. Diabetes 2006, 55(6):1874-1878. 11. North KE, MacCluer JW, Williams JT, Welty TK, Best LG, Lee ET, Fabsitz RR, Howard BV: Evidence for distinct genetic effects on obesity and lipid-related CVD risk factors in diabetic com-pared to nondiabetic American Indians: the Strong Heart Family Study. Diabetes Metab Res Rev 2003, 19(2):140-147. 12. North KE, Howard BV, Welty TK, Best LG, Lee ET, Yeh JL, Fabsitz
RR, Roman MJ, MacCluer JW: Genetic and environmental con-tributions to cardiovascular disease risk in American Indians: the strong heart family study. Am J Epidemiol 2003, 157(4):303-314.
13. Lee ET, Welty TK, Fabsitz R, Cowan LD, Le NA, Oopik AJ, Cucchiara AJ, Savage PJ, Howard BV: The Strong Heart Study. A study of cardiovascular disease in American Indians: design and methods. Am J Epidemiol 1990, 132(6):1141-1155.
14. Report of the Expert Committee on the Diagnosis and Clas-sification of Diabetes Mellitus. Diabetes Care 1997, 20(7):1183-1197.
15. Sun L, Wilder K, McPeek MS: Enhanced pedigree error detec-tion. Hum Hered 2002, 54(2):99-110.
16. Sobel E, Papp JC, Lange K: Detection and integration of genotyp-ing errors in statistical genetics. Am J Hum Genet 2002, 70(2):496-508.
17. Boehnke M: Allele frequency estimation from data on rela-tives. Am J Hum Genet 1991, 48(1):22-25.
18. Heath SC, Snow GL, Thompson EA, Tseng C, Wijsman EM: MCMC segregation and linkage analysis. Genet Epidemiol 1997, 14(6):1011-1016.
19. Williams JT, Van Eerdewegh P, Almasy L, Blangero J: Joint multipoint linkage analysis of multivariate qualitative and quantitative traits. I. Likelihood formulation and simulation results. Am J Hum Genet 1999, 65(4):1134-1147.
20. Towne B, Siervogel RM, Blangero J: Effects of genotype-by-sex interaction on quantitative trait linkage analysis. Genet
Epide-miol 1997, 14(6):1053-1058.
21. Blangero J, MacCluer JW, Kammerer CM, Mott GE, Dyer TD, McGill HC Jr: Genetic analysis of apolipoprotein A-I in two dietary environments. Am J Hum Genet 1990, 47(3):414-428.
Additional file 1
Strong Heart Family Study additional QTLs. Click here for file
[http://www.biomedcentral.com/content/supplementary/1471-2350-9-90-S1.pdf]
Publish with BioMed Central and every scientist can read your work free of charge "BioMed Central will be the most significant development for disseminating the results of biomedical researc h in our lifetime."
Sir Paul Nurse, Cancer Research UK Your research papers will be:
available free of charge to the entire biomedical community peer reviewed and published immediately upon acceptance cited in PubMed and archived on PubMed Central yours — you keep the copyright
Submit your manuscript here:
http://www.biomedcentral.com/info/publishing_adv.asp
BioMedcentral 22. Chen G, Adeyemo AA, Johnson T, Zhou J, Amoah A, Owusu S,
Ache-ampong J, Agyenim-Boateng K, Eghan BA, Oli J, et al.: A genome-wide scan for quantitative trait loci linked to obesity pheno-types among West Africans. International journal of obesity (2005) 2005, 29(3):255-259.
23. Avery CL, Freedman BI, Heiss G, Kraja A, Rice T, Arnett D, Miller MB, Pankow JS, Lewis CE, Myers RH, et al.: Linkage analysis of dia-betes status among hypertensive families: the Hypertension Genetic Epidemiology Network study. Diabetes 2004, 53(12):3307-3312.
24. Pratley RE, Thompson DB, Prochazka M, Baier L, Mott D, Ravussin E, Sakul H, Ehm MG, Burns DK, Foroud T, et al.: An autosomal genomic scan for loci linked to prediabetic phenotypes in Pima Indians. J Clin Invest 1998, 101(8):1757-1764.
25. Meigs JB, Panhuysen CI, Myers RH, Wilson PW, Cupples LA: A genome-wide scan for loci linked to plasma levels of glucose and HbA(1c) in a community-based sample of Caucasian pedigrees: The Framingham Offspring Study. Diabetes 2002, 51(3):833-840.
26. North KE, Franceschini N, Borecki IB, Gu CC, Heiss G, Province MA, Arnett DK, Lewis CE, Miller MB, Myers RH, et al.: Genotype-by-sex interaction on fasting insulin concentration: the HyperGEN study. Diabetes 2007, 56(1):137-142.
27. Kadowaki T, Yamauchi T, Kubota N, Hara K, Ueki K, Tobe K: Adi-ponectin and adiAdi-ponectin receptors in insulin resistance, dia-betes, and the metabolic syndrome. J Clin Invest 2006, 116(7):1784-1792.
28. Damcott CM, Ott SH, Pollin TI, Reinhart LJ, Wang J, O'Connell JR, Mitchell BD, Shuldiner AR: Genetic variation in adiponectin receptor 1 and adiponectin receptor 2 is associated with type 2 diabetes in the Old Order Amish. Diabetes 2005, 54(7):2245-2250.
29. Stefan N, Machicao F, Staiger H, Machann J, Schick F, Tschritter O, Spieth C, Weigert C, Fritsche A, Stumvoll M, et al.: Polymorphisms in the gene encoding adiponectin receptor 1 are associated with insulin resistance and high liver fat. Diabetologia 2005, 48(11):2282-2291.
30. Siitonen N, Pulkkinen L, Mager U, Lindstrom J, Eriksson JG, Valle TT, Hamalainen H, Ilanne-Parikka P, Keinanen-Kiukaanniemi S, Tuomile-hto J, et al.: Association of sequence variations in the gene encoding adiponectin receptor 1 (ADIPOR1) with body size and insulin levels. The Finnish Diabetes Prevention Study.
Diabetologia 2006, 49(8):1795-1805.
31. Hara K, Horikoshi M, Kitazato H, Yamauchi T, Ito C, Noda M, Ohashi J, Froguel P, Tokunaga K, Nagai R, et al.: Absence of an association between the polymorphisms in the genes encoding adi-ponectin receptors and type 2 diabetes. Diabetologia 2005, 48(7):1307-1314.
32. Wang H, Zhang H, Jia Y, Zhang Z, Craig R, Wang X, Elbein SC: Adi-ponectin receptor 1 gene (ADIPOR1) as a candidate for type 2 diabetes and insulin resistance. Diabetes 2004, 53(8):2132-2136.
33. Vaxillaire M, Dechaume A, Vasseur-Delannoy V, Lahmidi S, Vatin V, Lepretre F, Boutin P, Hercberg S, Charpentier G, Dina C, et al.: Genetic analysis of ADIPOR1 and ADIPOR2 candidate poly-morphisms for type 2 diabetes in the Caucasian population.
Diabetes 2006, 55(3):856-861.
34. Loos RJ, Ruchat S, Rankinen T, Tremblay A, Perusse L, Bouchard C: Adiponectin and adiponectin receptor gene variants in rela-tion to resting metabolic rate, respiratory quotient, and adi-posity-related phenotypes in the Quebec Family Study. Am J
Clin Nutr 2007, 85(1):26-34.
Pre-publication history
The pre-publication history for this paper can be accessed here: