R E S E A R C H
Open Access
Waist circumference and pulmonary function:
a systematic review and meta-analysis
Fernando César Wehrmeister
*, Ana Maria Baptista Menezes, Ludmila Correa Muniz, Jeovany Martínez-Mesa,
Marlos Rodrigues Domingues and Bernardo Lessa Horta
Abstract
Background:Studies have reported an impact of central obesity on people’s health. The literature is scarce on the effects of waist circumference (WC) on pulmonary function. Our objective was to review the literature on the association between WC and pulmonary function.
Methods:A systematic review was carried out in the PubMed, CINAHL, Web of Science and Scopus databases. The search included published, in press and online documents up to December 2011. A meta-analysis was carried out to obtain the pooled effect, and a meta-regression was performed to evaluate sources of heterogeneity.
Results:From the 547 studies identified, 10 were included. The meta-analysis revealed an inverse relationship between WC and pulmonary function parameters, indicating that the effect was greater among men (forced expiratory volume in 1 second (FEV1β=−15.9 (95% confidence interval =−23.2,−8.5); forced vital capacity (FVC)β=−16.6 (95% confidence interval =−21.0,−12.2)) compared with women (FEV1β=−5.6 (95% confidence interval =−9.1,−2.1); FVC β=−7.0 (95% confidence interval =−9.1,−4.8)). The meta-regression identified sex as the characteristic that most contributed to the heterogeneity (R2= 54.8% for FEV1and R
2
= 85.7% for FVC).
Conclusions:There seems to be an inverse relationship between WC and pulmonary function, mainly in men. More population-based studies should be performed, especially among children and adolescents, to confirm these findings.
Keywords:Anthropometry, Forced vital capacity, Forced expiratory volume, Pulmonary function tests, Review, Waist circumference
Background
Our lifestyle has changed in the past decades. Nowadays many of us have adopted unhealthy habits that may im-pair our health [1]. The global obesity rate is a result of such behaviors and is one of the main causes of chronic diseases worldwide [2]. Obesity has been associated with many chronic diseases such as cardiovascular disorders among many others; recently, some respiratory diseases and consequent loss in pulmonary function have been associated with obesity, changing dramatically overall health, life quality and lifespan [3]. Asthma is an ex-ample of a respiratory disease associated with obesity, as reported by many studies. A review by Noal and collea-gues showed an association between overweight/obesity and asthma in adolescents [4].
The wide use of body mass index (BMI) as an obesity measure is explained by its simplicity, but it does not provide information on body fat distribution [5,6]. Stud-ies have recently focused on abdominal fat accumulation and its consequences on population health. Few population-based studies using high-end equipment are published; hence, the standardized waist circumference (WC) measured by trained personnel [3,5,7-11] has been used as an estimate of abdominal fat.
The effects of obesity on pulmonary function para-meters are influenced by the amount and distribution of body fat [12-14]. Studies have shown that central obes-ity, which may be measured by WC or by waist-to-hip ratio, can influence respiratory mechanics regardless of BMI [12,14]. Both BMI and WC are usual measures of overweight and obesity, but also indicators of body size, and they therefore may be associated with pulmonary function parameters such as forced expiratory volume in
* Correspondence:[email protected]
Postgraduate Program in Epidemiology, Federal University of Pelotas, Rua Marechal Deodoro 1160, 3º piso, Pelotas, RS CEP 96020-220, Brazil
1 second (FEV1) and forced vital capacity (FVC) [5,9].
The abdominal fat, measured by WC, correlates to intra-abdominal and subcutaneous adipose tissue, and is a better indicator of intra-abdominal fat (considered harmful to health) than BMI [15]. Obesity-related health risks are better explained by WC than BMI [16], as the WC provides information on fat distribution that cannot be obtained from BMI [15]. Besides, WC may affect ven-tilatory mechanics because it limits diaphragm expan-sion [6].
A review study on physiology of obesity and its effects on pulmonary function showed that central obesity is more likely to affect pulmonary volumes, without direct effects on pulmonary obstruction [6]. The aim of the present review is therefore to evaluate the association between WC and pulmonary function parameters reporting a combined effect measure through a meta-analysis.
Methods
Search strategy
A systematic review was carried out using independent keywords in the following electronic databases: PubMed, Web of Science, Scopus and CINAHL. The use of inde-pendent keywords allows a broader search as it rules out potential mistyping and other errors when using Mesh Terms (Medical Subject Headings) in different data-bases. The keywords used were: (‘waist circumference’ OR ‘abdominal circumference’ OR ‘central obesity’ OR ‘abdominal obesity’OR ‘waist-hip ratio’) AND (‘ spirom-etry’ OR ‘lung function tests’ OR ‘pulmonary function tests’ OR ‘respiratory function tests’ OR ‘forced expira-tory volume’OR FEV OR‘forced vital capacity’OR FVC OR‘peak expiratory flow rate’OR PEFR). In the Web of Science database, we needed to include ‘TS=’before the parentheses for each subset of terms. The search was carried out on 1 January 2012 including all papers pub-lished until the end of 2011, with no data limits.
Criteria for inclusion and exclusion of papers
To be included in the review, papers should be based on population-based observational (cross-sectional or co-hort) studies and should report the association between WC and pulmonary function parameters. Studies among specific groups (twins or people affected by a specific ill-ness) were not included. Studies reporting only the peak expiratory flow rate assessed by peak flow and not by spirometer and that did not use linear regression during analysis were excluded from the present review.
Stages of reference selection
All references were imported into Endnote software (EndNote X3; Thompson Reuters Inc. Philadelphia, PA,
USA). One of the authors (FCW) later read the titles and excluded those that did not report the outcomes of interest. Two authors (FCW and LCM) then read all abstracts independently. All disagreements with respect to inclusion/exclusion of papers were judged by a third author (JM-M). Independent reading of full texts was again done by two reviewers (FCW and LCM), while a third reviewer was used when disagreements happened. Information from papers was retrieved by two independ-ent referees (FCW and LCM) and occasional disagree-ments were decided by the third reviewer (JM-M). After this stage, the list with all references from the selected papers was examined to look for other references that have not yet been included.
Data extraction
Characteristics of studies, such as sample size, design, country, WC and pulmonary function measurement pro-cedures, were extracted from papers. We also extracted linear regression coefficients (β) and dispersion measures (standard error and standard deviation, when available, or upper/lower bounds of 95% confidence intervals (CIs)). The data extraction was carried out by two inde-pendent reviewers (FCW and LCM) and divergences were solved by consensus.
Evaluation of selected papers
period of time? (Item 15) Was there adequate adjust-ment for confounding in the analyses from which the main findings were drawn? (Item 16) Were losses of patients to follow-up taken into account? (Item 17) Did the study have sufficient power to detect a clinically im-portant effect where the probability value for a differ-ence being due to chance is less than 5%?
Each item scored one point, except for Item 4 that could result in 0 (no), 1 (partially) and 2 (yes). The scor-ing could therefore range from 0 to 18 points. Papers were categorized as: high chance of bias (0 to 5 points), average chance of bias (6 to 11 points) and low chance of bias (12 to 18 points). Papers were scored independ-ently by two referees and occasional disagreements were decided by the third reviewer.
Meta-analysis
A meta-analysis was carried out with data on FEV1and
FVC. To obtain the pooled effect, a random model [18] was employed in all analysis, due to the high heterogen-eity observed (I2
>90%) and possible differences in the measurement of WC. Only studies that measured the as-sociation between WC as a continuous variable with ab-solute values for FEV1and FVC were included. As linear
regression was used in all studies, those presenting results in liters were changed into milliliters. When the results of the study were not in accordance with such demands (WC in percentiles or predicted values for FEV1 and FVC), the authors were contacted by email
(three attempts) to obtain information to enable inclu-sion of the study in the meta-analysis. Two out of four authors replied.
For meta-analysis purposes, we pooled the regression coefficients (β) of the association investigated. During meta-analysis, studies presenting results stratified by sex were included twice, as independent analysis. After con-tact with the correspondence author of one study [3], the regression coefficients of the association between WC and FEV1and FVC, which were in quintiles, were
changed into centimeters, dividing each quintile by its respective increments (6.3 cm in men and 6.9 cm in women), because according to the author the relation-ship was linear. The only study among children and ado-lescents [9] was not included in the meta-analysis. Lastly, a meta-regression was performed to assess the contribution of some variables to the heterogeneity be-tween studies. In the meta-regression, besides variables from the study (sex, WC measurement method, sample size and age, and statistical adjustment for height, weight and age), other variables that could potentially explain the results’ heterogeneity were included: geographical continent where the study was carried out and the Human Development Index, obtained previously and/or during the year of the research.
Results
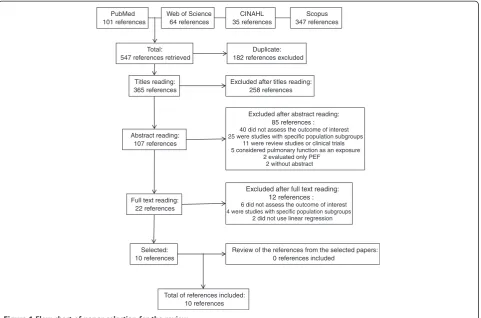
A total of 547 references were retrieved: 101 from PubMed, 64 from Web of Science, 35 from CINAHL and 347 from Scopus. From these 547 references, 182 were duplicated–leaving 365 titles to be read. After the selection stages, 10 papers were included in the review. All stages of reference selection, and numbers of papers included/excluded are displayed on the flow chart (Figure 1). Additional information can be visualized in Additional file 1.
The details of each study are shown in Table 1. The 10 studies selected for analysis were published between 1999 and 2011, and seven were cross-sectional (Table 1). Sample size in the studies ranged from 718 [9] to 21,550 [3] individuals. Most studies included individuals older than 18, and only one study involved children and ado-lescents [9]. Only one study from a developing country was found [19]. All pulmonary function parameters were measured by spirometry, while waist circumference was measured with tape by trained staff. However, distinct body sites were used to locate and measure waist cir-cumference. Depending on the study, measurements were taken on the navel line, the smallest circumference or the midpoint between the ribs and iliac crest. Seven out of 10 studies included presented sex-stratified ana-lysis. Based on the Downs and Black checklist, all papers scored >12, indicating a low chance of bias.
Association of waist circumference with FEV1
FEV1 was analyzed as a continuous variable and as
per-centage of the predicted value. All studies, except the one with children and adolescents [9], presented an inverse re-lationship between WC and FEV1; however, this
relation-ship was not statistically significant in all studies (Table 1). Canoy and colleagues and Ubilla and colleagues used quintiles and terciles, respectively, to evaluate the associ-ation of WC with FEV1[3,19]. In the study by Canoy and
colleagues, carried out in the UK among adults, each step from one WC quintile to another represented a decrease in FEV1of 120.3 ml (95% CI = −134.6, –106.1) in men
and 53.2 ml (95% CI = −62.0, −44.5) in women [3] (Table 1). On the other hand, the study by Ubilla and col-leagues showed no association of WC (terciles) with FEV1
for men or women [19]. When treated as a continuous variable, the effect of a 1-cm increase in the WC resulted in a decrease of 4 ml in women [20] to 20 ml in men [20] (Table 1). Only one cohort study presented longitudinal analysis [7] –showing that the larger the WC difference (in standard deviations) from one follow-up to the other, the lower the FEV1.
Association of waist circumference with FVC
The association of WC with FVC, however, seems to be larger than that for FEV1. When the FVC was studied as
continuous information, a 1-cm increment in WC decreased FVC by 13 ml in both sexes [5] (Table 1). However, studies presenting sex-stratified analysis showed that the decrease in FVC (absolute values) was higher in men than women for the WC increase as a continuous variable [8,20] or in quintiles [3] (Table 1). The FCV analyzed as a percentage of predicted values also presented an inverse relationship with WC; a similar pattern was observed with absolute values. In men, as the WC increased the predicted FVC value decreased from 0.170 [20] to 0.350 [11]. In women, this decrease ranged from 0.150 [21] to 0.176 [11] (Table 1).
Association of waist circumference with the FEV1/FVC relation
From the 10 studies in this review, five presented results for the association between WC and the FEV1/FVC
rela-tion, but only two showed statistically significant results [11,22], both in adults. Paek and colleagues observed, in South Korea, a reduction in the FEV1/FVC relation of
0.029% for each 1-cm increase in WC, adjusted for sex, age, weight and other covariates [22] (Table 1). On the contrary, Ochs-Balcom and colleagues presented
sex-stratified results and, different to FEV1and FVC, the
ef-fect was the same among men and women [11] (Table 1).
Meta-analysis and meta-regression
The meta-analysis was carried out with FEV1 and FVC
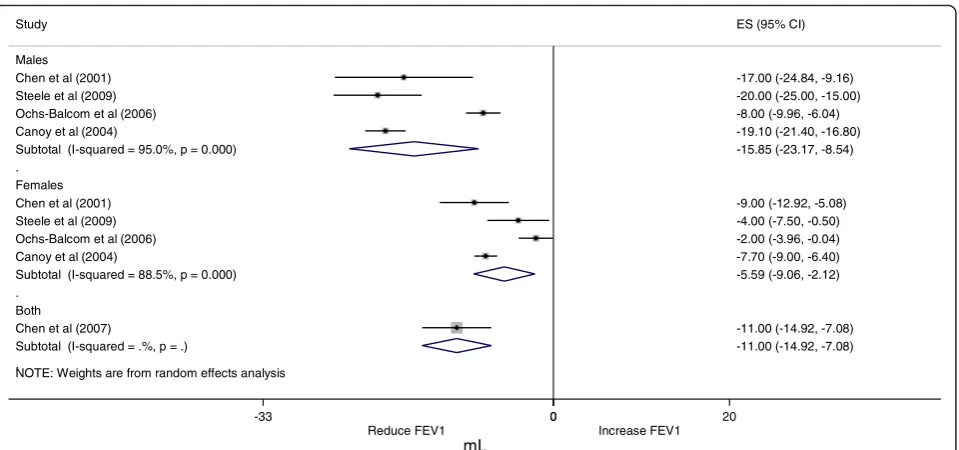
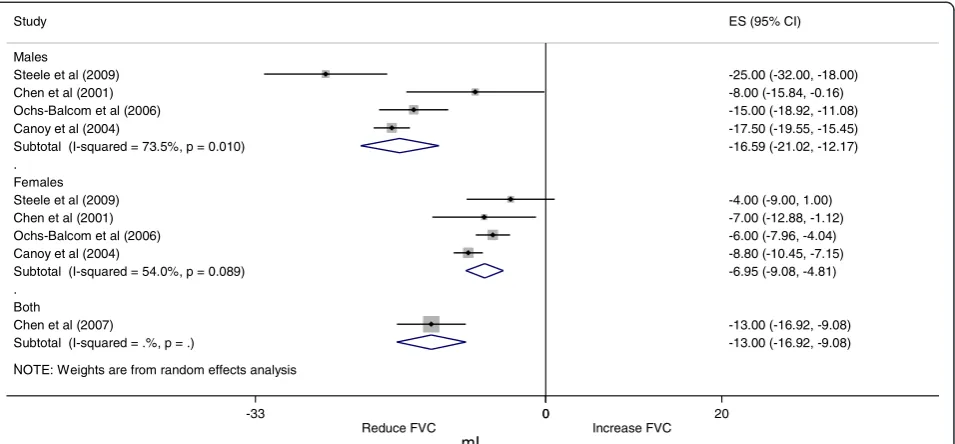
values. The pooled effect of the association between WC and FEV1is displayed in Figure 2 and the association
be-tween WC and FVC is shown in Figure 3. We decided to present only sex-stratified effects due to an apparent difference in the association according to sex. Despite the small number of studies in the meta-analysis, the ef-fect in men (FEV1 β = −15.9 (95% CI = −23.2, –8.5);
FVCβ=−16.6 (95% CI =−21.0,–12.2)) presented larger magnitude compared with that in women (FEV1 β = −5.6 (95% CI = −9.1, –2.1); FVC β = −7.0 (95% CI = −9.1,–4.8)). The FEV1/FVC relation was not used in the
meta-analysis due to the very low number of studies showing these results (only three out of five studies met the inclusion criteria).
When the individual contribution of each characteristic in the heterogeneity by meta-regression (Table 2) was ana-lyzed, we observed that including sex in the model resulted in a reduction of 54.8% for FEV1and 85.7% for FVC. Other PubMed
101 references
Web of Science 64 references
CINAHL 35 references
Scopus 347 references
Total: 547 references retrieved
Duplicate: 182 references excluded
Titles reading: 365 references
Excluded after titles reading: 258 references
Abstract reading: 107 references
Excluded after abstract reading: 85 references :
40 did not assess the outcome of interest 25 were studies with specific population subgroups
11 were review studies or clinical trials 5 considered pulmonary function as an exposure
2 evaluated only PEF 2 without abstract
Full text reading: 22 references
Excluded after full text reading: 12 references :
6 did not assess the outcome of interest 4 were studies with specific population subgroups
2 did not use linear regression
Selected: 10 references
Review of the references from the selected papers: 0 references included
Total of references included: 10 references
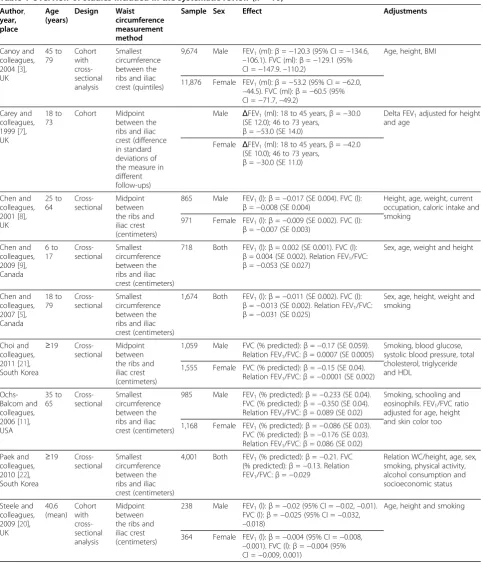
Table 1 Overview of studies included in the systematic review (n= 10) Author, year, place Age (years) Design Waist circumference measurement method
Sample Sex Effect Adjustments
Canoy and colleagues, 2004 [3], UK 45 to 79 Cohort with cross-sectional analysis Smallest circumference between the ribs and iliac crest (quintiles)
9,674 Male FEV1(ml):β=−120.3 (95% CI =−134.6, –106.1). FVC (ml):β=−129.1 (95% CI =−147.9.–110.2)
Age, height, BMI
11,876 Female FEV1(ml):β=−53.2 (95% CI =−62.0, –44.5). FVC (ml):β=−60.5 (95% CI =−71.7,–49.2)
Carey and colleagues, 1999 [7], UK
18 to 73
Cohort Midpoint between the ribs and iliac crest (difference in standard deviations of the measure in different follow-ups)
Male ΔFEV1(ml): 18 to 45 years,β=−30.0 (SE 12.0); 46 to 73 years,
β=−53.0 (SE 14.0)
Delta FEV1adjusted for height and age
Female ΔFEV1(ml): 18 to 45 years,β=−42.0 (SE 10.0); 46 to 73 years,
β=−30.0 (SE 11.0)
Chen and colleagues, 2001 [8], UK 25 to 64 Cross-sectional Midpoint between the ribs and iliac crest (centimeters)
865 Male FEV1(l):β=−0.017 (SE 0.004). FVC (l):
β=−0.008 (SE 0.004)
Height, age, weight, current occupation, caloric intake and smoking
971 Female FEV1(l):β=−0.009 (SE 0.002). FVC (l):
β=−0.007 (SE 0.003)
Chen and colleagues, 2009 [9], Canada 6 to 17 Cross-sectional Smallest circumference between the ribs and iliac crest (centimeters)
718 Both FEV1(l):β= 0.002 (SE 0.001). FVC (l):
β= 0.004 (SE 0.002). Relation FEV1/FVC:
β=−0.053 (SE 0.027)
Sex, age, weight and height
Chen and colleagues, 2007 [5], Canada 18 to 79 Cross-sectional Smallest circumference between the ribs and iliac crest (centimeters)
1,674 Both FEV1(l):β=−0.011 (SE 0.002). FVC (l):
β=−0.013 (SE 0.002). Relation FEV1/FVC:
β=−0.031 (SE 0.025)
Sex, age, height, weight and smoking
Choi and colleagues, 2011 [21], South Korea
≥19 Cross-sectional
Midpoint between the ribs and iliac crest (centimeters)
1,059 Male FVC (% predicted):β=−0.17 (SE 0.059). Relation FEV1/FVC:β= 0.0007 (SE 0.0005)
Smoking, blood glucose, systolic blood pressure, total cholesterol, triglyceride and HDL
1,555 Female FVC (% predicted):β=−0.15 (SE 0.04). Relation FEV1/FVC:β=−0.0001 (SE 0.002)
Ochs-Balcom and colleagues, 2006 [11], USA 35 to 65 Cross-sectional Smallest circumference between the ribs and iliac crest (centimeters)
985 Male FEV1(% predicted):β=−0.233 (SE 0.04). FVC (% predicted):β=−0.350 (SE 0.04). Relation FEV1/FVC:β= 0.089 (SE 0.02)
Smoking, schooling and eosinophils. FEV1/FVC ratio adjusted for age, height and skin color too 1,168 Female FEV1(% predicted):β=−0.086 (SE 0.03).
FVC (% predicted):β=−0.176 (SE 0.03). Relation FEV1/FVC:β= 0.086 (SE 0.02) Paek and
colleagues, 2010 [22], South Korea
≥19 Cross-sectional
Smallest circumference between the ribs and iliac crest (centimeters)
4,001 Both FEV1(% predicted):β=−0.21. FVC (% predicted):β=−0.13. Relation FEV1/FVC:β=−0.029
Relation WC/height, age, sex, smoking, physical activity, alcohol consumption and socioeconomic status
Steele and colleagues, 2009 [20], UK 40.6 (mean) Cohort with cross-sectional analysis Midpoint between the ribs and iliac crest (centimeters)
238 Male FEV1(l):β=−0.02 (95% CI =−0.02,–0.01). FVC (l):β=−0.025 (95% CI =−0.032, –0.018)
Age, height and smoking
tested variables were not important to lower the hetero-geneity of the results during meta-analysis (Table 2).
The reasons for exclusion of papers from the meta-analysis were: pulmonary function measurement expressed as time change [7] or as percentage of predicted value [21,22], WC in terciles [19] or a study with children [9].
Discussion
The present review highlights a potential negative relation-ship between WC and pulmonary function, especially with respect to FEV1and FVC. The clinical relevance of these
findings must be interpreted with caution due to the few number of studies included in the present meta-analysis.
The major strengths of this review are the exclusive in-clusion of population-based studies, improving external validity of the results. Another interesting aspect is the
use of linear regression, which allowed us to establish the amount of pulmonary function reduction for each increase in waist circumference; this would not be pos-sible if we included studies using cutoff points for pul-monary function parameters.
One possible limitation is the use of different spirometers among the studies. Nevertheless, most of the reviewed studies used portable spirometers; the paper from Liistro and colleagues shows a good reproducibility for FEV1using
10 different portable spirometers in a multicenter study [23]; regarding FVC, some of the spirometers showed large confidence intervals. We therefore cannot rule out a po-tential bias for some of the lung function parameters, but if there is such bias it is conservative.
It is important to observe that nearly all included studies were cross-sectional (or with cross-sectional analysis) and
Table 1 Overview of studies included in the systematic review (n= 10)(Continued)
Ubilla and colleagues, 2008 [19], Chile
21 to 28
Cohort with cross-sectional analysis
Navel line (terciles, middle as reference)
550 Male FEV1(ml): lower tercile,β= 93.1 (95% CI = 14.4, 200.6); upper tercile,
β=−76.9 (95% CI =−183.2, 29.5). FVC (ml): lower tercile,β= 80.7 (95% CI = 43.0, 204.4); upper tercile,β=−98.8 (95% CI =−221.2, 23.6)
Age, height, smoking, number of siblings, schooling and gestational age. Nutritional variables throughout life, except BMI
671 Female FEV1(ml): lower tercile,β=−62.1 (95% CI =−132.1, 7.9); upper tercile,
β=−22.1 (95% CI =−93.7, 49.5). FVC (ml): lower tercile,β=−96.2 (95% CI =−177.1,–15.2); upper tercile,β=−42.5 (95% CI =−125.3, 40.3)
BMI, body mass index; CI, confidence interval; FEV1, forced expiratory volume in 1 second; FVC, forced vital capacity; HDL, high-density lipoprotein; SE, standard error; WC, waist circumference.
NOTE: Weights are from random effects analysis .
.
. Males Chen et al (2001) Steele et al (2009) Ochs-Balcom et al (2006) Canoy et al (2004)
Subtotal (I-squared = 95.0%, p = 0.000)
Females Chen et al (2001) Steele et al (2009) Ochs-Balcom et al (2006) Canoy et al (2004)
Subtotal (I-squared = 88.5%, p = 0.000)
Both
Chen et al (2007)
Subtotal (I-squared = .%, p = .) Study
-17.00 (-24.84, -9.16) -20.00 (-25.00, -15.00) -8.00 (-9.96, -6.04) -19.10 (-21.40, -16.80) -15.85 (-23.17, -8.54)
-9.00 (-12.92, -5.08) -4.00 (-7.50, -0.50) -2.00 (-3.96, -0.04) -7.70 (-9.00, -6.40) -5.59 (-9.06, -2.12)
-11.00 (-14.92, -7.08) -11.00 (-14.92, -7.08) ES (95% CI)
Reduce FEV1 Increase FEV1 0
-33 0 20
mL
evaluated adults (18 years or older). In addition, only one study was carried out in a developing country [19], indi-cating the need for future studies in these countries.
The prevalence of obesity and body shapes may differ between developed and poorer countries. The study by Ford and colleagues points out an increase in abdominal obesity, measured by WC, in the USA [24], while other countries do not have enough data to draw such conclu-sion. Other factors that may influence the WC measure are age, sex, physical activity, skin color and overall adi-posity [15], all characteristics that change drastically among different countries. The effect of WC on FEV1
and FVC in children and adolescents could not be assessed in the present review because only one Canad-ian study evaluated this age group [9]. In contrast to
what was observed in older people and adults, a direct relationship between WC and pulmonary function para-meters (FEV1and FVC) was observed in this study,
pos-sibly due to the growth process that occurs during adolescence, as WC is considered an indication of body size, consequently influencing pulmonary volumes in children and adolescents.
Klein and colleagues attempted to establish a geomet-rical relationship between weight, BMI and WC (consid-ered as the circumference of a cylinder) [15]. WC mirrors body shape, while BMI provides an estimate of body mass and volume [15]. Different measures of adiposity such as indices and others (Dual-energy X-ray Absorptiometry, air displacement plethysmography, bioimpedance among others) have been used in epidemiological studies. How-ever, some of these measures are very expensive and can-not be used in most of the studies. In the present review, we observed that WC was measured differently according to the study, which could influence the magnitude of the association with pulmonary function parameters. How-ever, the meta-regression results show that the WC meas-urement method could not explain the heterogeneity of results. Wang and colleagues report 14 different sites to measure WC, all between the 10th rib and iliac crest [25]. Klein and colleagues describe five main methods to meas-ure WC in clinical settings or in epidemiologic studies: midpoint between the last rib and iliac crest; navel level; wider or narrower waist circumference; right below the rib cage; and right above the iliac crest [15].
Owing to discrepancy in measuring the WC, Wang and colleagues carried out a study in the USA to establish Table 2 Individual contribution of each variable in the
decrease of heterogeneity, measured by meta-regression
AdjustedR2(%)
Variable FEV1 FVC
Sexa 54.8 85.7
Waist circumference measurement method 0.0 0.0
Age 0.0 0.0
Sample 0.0 0.0
Adjustment for height, weight and age 0.0 0.0
Study quality (modified Downs and Black scale) 0.0 0.0
Human Development Index 10.2 0.0
Geographical continent where study was carried out 7.7 0.0
FEV1, forced expiratory volume in 1 second; FVC, forced vital capacity.aFor this analysis, the study reporting measurements for both genders [5] was not included.
NOTE: Weights are from random effects analysis .
.
. Males
Steele et al (2009) Chen et al (2001) Ochs-Balcom et al (2006) Canoy et al (2004)
Subtotal (I-squared = 73.5%, p = 0.010)
Females Steele et al (2009) Chen et al (2001) Ochs-Balcom et al (2006) Canoy et al (2004)
Subtotal (I-squared = 54.0%, p = 0.089)
Both
Chen et al (2007)
Subtotal (I-squared = .%, p = .) Study
-25.00 (-32.00, -18.00) -8.00 (-15.84, -0.16) -15.00 (-18.92, -11.08) -17.50 (-19.55, -15.45) -16.59 (-21.02, -12.17)
-4.00 (-9.00, 1.00) -7.00 (-12.88, -1.12) -6.00 (-7.96, -4.04) -8.80 (-10.45, -7.15) -6.95 (-9.08, -4.81)
-13.00 (-16.92, -9.08) -13.00 (-16.92, -9.08) ES (95% CI)
Reduce FVC Increase FVC 0
-33 0 20
mL
which WC measuring method was the most accurate to predict abdominal fat [25]. The researchers measured the WC in 111 individuals (adults) using the following sites: narrower circumference in the midpoint between the last rib and iliac crest, and immediately below the lowest rib and right above the iliac crest. The authors repeated the measurement three times in a subgroup (n= 98). All four methods were highly correlated (r >0.99) in men and women. They also provided reliable information on the trunk fat percentage, especially in women (R2
>0.65 in women and R2<0.45 in men). Klein and colleagues thus discuss that there is no best site for measuring the WC [15]. In this review, apparently, there are no differences in the magnitude of the association between WC with FEV1
or FVC regardless of the measuring method to obtain the WC.
Obese people, especially those with severe obesity, have higher metabolic demands and also increased re-spiratory demands [13]. Much has been said about the disadvantages of BMI to measure body fat, especially be-cause it measures body density. New indexes are there-fore considered best for evaluating fat [26] and fat distribution in the body [15]. As previously known, obes-ity mainly when measured by BMI is not a good param-eter to evaluate body fat distribution [6,26]. Abdominal obesity, measured by WC, was initially discussed as a risk factor for cardiovascular mortality and morbidity. Nowadays, other diseases are being studied to investigate the association with central obesity, including conditions related to pulmonary function [27]. One of the most dis-cussed explanations in the literature is that abdominal fat may interfere in pulmonary mechanics, causing restrictions during breathing, potentially reducing re-spiratory volumes, such as FEV1and FVC [6,13,28]. This
mechanical effect is more evident if central obesity is considered instead of overall or peripheral fat [10,12].
The excess of fat in the abdomen and thoracic region may lead to decreases in the compliance and resistance of respiratory system, increasing energetic demands of breathing [28]. Measuring the compliance of the respira-tory system is a hard task, however, as it must be relaxed and inactive to provide an accurate measure [6]. Another potential mechanism is that the increase in WC may have an effect on the diaphragm, limiting its movements [6]. There is no difference in the effect size on the respiratory system when different abdominal obesity indicators are used, such as WC and waist-to-hip ratio, and thoracic fat indicators [6], suggesting an interdependency of these measures with respect to pulmonary function parameters.
The intention to run the analysis stratified according to potential heterogeneity sources was only workable for sex as other variables were not present in most studies, resulting in very few studies to be analyzed. The meta-analysis is very difficult to perform because not all
studies present the same units to measure both WC (measured in centimeters, standard deviations or percen-tiles) or pulmonary function parameters (measured as absolute values and percentage of the predicted values).
During the evaluation of the high heterogeneity in our findings, indicated by the highI2value in the meta-analysis, intrinsic factors to the study and some asso-ciated with the country where the research was carried out were assessed by the meta-regression. Heterogeneity was better explained by sex:R2= 54.8% for men andR2= 85.7 for women. It is known that the main determinants of pulmonary function are age, height and sex [29]. An-other factor that could explain the difference in the mag-nitude of the association between WC with pulmonary function is the body fat accumulation pattern. In women, fat accumulates around the hips; while in men the abdo-men is usually where fat is accumulated [30].
As a consequence, perhaps, the effect of WC on pul-monary function in men tends to be larger than that in women. The Human Development Index explained 10.2% of heterogeneity of the results. One plausible explanation is that the Human Development Index and physical activ-ity are positively correlated [31], and physical inactivactiv-ity is a major risk factor for obesity and other health conditions, most of them also associated with WC increases.
Conclusions
Increases in WC result in decreased pulmonary function parameters, such as FEV1and FVC in people older than
18 years, but it does not affect the relation between the two parameters. We also identified that the effect of WC on pulmonary function parameters was greater among men compared with women. Central obesity is possibly associated with restrictive patterns, but not airways ob-struction; however, it cannot be entirely ruled out. Longitu-dinal studies, especially among children and adolescents, are needed to verify the effects in these age groups, as well as the long-term effects of WC on pulmonary function.
Additional file
Additional file 1:PRISMA 2009 flow diagram.
Abbreviations
BMI: body mass index; CI: confidence interval; CINAHL: Cumulative Index to Nursing and Allied Health Literature; FEV1: forced expiratory volume in 1 second; FVC: forced vital capacity; WC: waist circumference.
Competing interests
The authors declare that they have no competing interests.
Authors’contributions
reviewed the manuscript. All authors read and approved the final manuscript.
Received: 3 July 2012 Accepted: 18 October 2012 Published: 16 November 2012
References
1. US Department of Health and Human Services:Healthy People 2020. New York: Office of Disease Prevention and Health Promotion; 2010. 2. Kelly T, Yang W, Chen CS, Reynolds K, He J:Global burden of obesity in
2005 and projections to 2030.Int J Obes (Lond)2008,32:1431–1437. 3. Canoy D, Luben R, Welch A, Bingham S, Wareham N, Day N, Khaw KT:
Abdominal obesity and respiratory function in men and women in the EPIC–Norfolk Study, United Kingdom.Am J Epidemiol2004,
159:1140–1149.
4. Noal RB, Menezes AM, Macedo SE, Dumith SC:Childhood body mass index and risk of asthma in adolescence: a systematic review.Obes Rev2011, 12:93–104.
5. Chen Y, Rennie D, Cormier YF, Dosman J:Waist circumference is associated with pulmonary function in normal-weight, overweight, and obese subjects.Am J Clin Nutr2007,85:35–39.
6. Salome CM, King GG, Berend N:Physiology of obesity and effects on lung function.J Appl Physiol2010,108:206–211.
7. Carey IM, Cook DG, Strachan SP:The effects of adiposity and weight change on forced expiratory volume decline in a longitudinal study of adults.Int J Obes Relat Metab Disord1999,23:979–985.
8. Chen R, Tunstall-Pedoe H, Bolton-Smith C, Hannah MK, Morrison C: Association of dietary antioxidants and waist circumference with pulmonary function and airway obstruction.Am J Epidemiol
2001,153:157–163.
9. Chen Y, Rennie D, Cormier Y, Dosman JA:Waist circumference associated with pulmonary function in children.Pediatr Pulmonol2009,44:216–221. 10. Lazarus R, Gore CJ, Booth M, Owen N:Effects of body composition and fat
distribution on ventilatory function in adults.Am J Clin Nutr1998, 68:35–41.
11. Ochs-Balcom HM, Grant BJ, Muti P, Sempos CT, Freudenheim JL, Trevisan M, Cassano PA, Iacoviello L, Schunemann HJ:Pulmonary function and abdominal adiposity in the general population.Chest2006,129:853–862. 12. Collins LC, Hoberty PD, Walker JF, Fletcher EC, Peiris AN:The effect of body
fat distribution on pulmonary function tests.Chest1995,107:1298–1302. 13. Jubber AS:Respiratory complications of obesity.Int J Clin Pract2004,
58:573–580.
14. Lazarus R, Sparrow D, Weiss ST:Effects of obesity and fat distribution on ventilatory function: the normative aging study.Chest1997,111:891–898. 15. Klein S, Allison DB, Heymsfield SB, Kelley DE, Leibel RL, Nonas C, Kahn R:
Waist circumference and cardiometabolic risk: a consensus statement from shaping America’s health: Association for Weight Management and Obesity Prevention; NAASO, the Obesity Society; the American Society for Nutrition; and the American Diabetes Association.Diabetes Care2007, 30:1647–165.
16. Janssen I, Katzmarzyk PT, Ross R:Waist circumference and not body mass index explains obesity-related health risk.Am J Clin Nutr2004, 79:379–384.
17. Downs SH, Black N:The feasibility of creating a checklist for the assessment of the methodological quality both of randomised and non-randomised studies of health care interventions.J Epidemiol Community Health1998,52:377–384.
18. DerSimonian R, Laird N:Meta-analysis in clinical trials.Control Clin Trials
1986,7:177–188.
19. Ubilla C, Bustos P, Amigo H, Oyarzun M, Rona RJ:Nutritional status, especially body mass index, from birth to adulthood and lung function in young adulthood.Ann Hum Biol2008,35:322–333.
20. Steele RM, Finucane FM, Griffin SJ, Wareham NJ, Ekelund U:Obesity is associated with altered lung function independently of physical activity and fitness.Obesity (Silver Spring)2009,17:578–584.
21. Choi JH, Park S, Shin YH, Kim MY, Lee YJ:Sex differences in the relationship between metabolic syndrome and pulmonary function: the
2007 Korean National Health and Nutrition Examination Survey.Endocr J
2011,58:459–465.
22. Paek YJ, Jung KS, Hwang YI, Lee KS, Lee DR, Lee JU:Association between low pulmonary function and metabolic risk factors in Korean adults: The Korean National Health and Nutrition Survey.Metab Clin Exp2010, 59:1300–1306.
23. Liistro G, Vanwelde C, Vincken W, Vandevoorde J, Verleden G, Buffels J: Technical and functional assessment of 10 office spirometers: a multicenter comparative study.Chest2006,130:657–665.
24. Ford ES, Mokdad AH, Giles WH:Trends in waist circumference among U.S. adults.Obes Res2003,11:1223–1231.
25. Wang J, Thornton JC, Bari S, Williamson B, Gallagher D, Heymsfield SB, Horlick M, Kotler D, Laferrère B, Mayer L, Pi-Sunyer FX, Pierson RN Jr: Comparisons of waist circumferences measured at 4 sites.Am J Clin Nutr
2003,77:379–384.
26. Bergman RN, Stefanovski D, Buchanan TA, Sumner AE, Reynolds JC, Sebring NG, Xiang AH, Watanabe RM:A better index of body adiposity.Obesity (Silver Spring)2011,19:1083–1089.
27. Leone N, Courbon D, Thomas F, Bean K, Jego B, Leynaert B, Guize L, Zureik M:Lung function impairment and metabolic syndrome: the critical role of abdominal obesity.Am J Respir Crit Care Med2009,179:509–516. 28. Piper AJ, Grunstein RR:Big breathing: the complex interaction of obesity,
hypoventilation, weight loss, and respiratory function.J Appl Physiol2010, 108:199–205.
29. Knudson RJ, Schroter RC, Knudson DE, Sugihara S:Influence of airway geometry on expiratory flow limitation and density dependence.Respir Physiol1983,52:113–123.
30. Wells JC:Sexual dimorphism of body composition.Best Pract Res Clin Endocrinol Metab2007,21:415–430.
31. Dumith SC, Hallal PC, Reis RS, Kohl HW 3rd:Worldwide prevalence of physical inactivity and its association with human development index in 76 countries.Prev Med2011,53:24–28.
doi:10.1186/2046-4053-1-55
Cite this article as:Wehrmeisteret al.:Waist circumference and pulmonary function: a systematic review and meta-analysis.Systematic Reviews20121:55.
Submit your next manuscript to BioMed Central and take full advantage of:
• Convenient online submission
• Thorough peer review
• No space constraints or color figure charges
• Immediate publication on acceptance
• Inclusion in PubMed, CAS, Scopus and Google Scholar
• Research which is freely available for redistribution