O R I G I N A L R E S E A R C H
Open Access
Microdosimetric analysis of
211
At in thyroid
models for man, rat and mouse
Anders Josefsson
*and Eva Forssell-Aronsson
Abstract
Background:The alpha particle emitter211At is proposed for therapy of metastatic tumour disease.211At is accumulated in the thyroid gland in a similar way as iodine. Dosimetric models of211At in the thyroid are needed for radiation protection assessments for 1) patients receiving211At-labelled pharmaceuticals where211At may be releasedin vivoand 2) personnel working with211At. Before clinical trials, preclinical studies are usually made in mice and rats. The aims of this study were to develop thyroid models for mouse, rat and man, and to compare microdosimetric properties between the models.
Methods:A thyroid follicle model was constructed: a single layer of 6 to 10-μm thick follicle cells with centrally positioned 4 to 8μm (diameter) spherical nuclei surrounded a 10 to 500μm (diameter) spherical follicle lumen. Species-specific models were defined for mouse, rat and man. The source compartments for211At were the follicle lumen, follicle cells and follicle cell nuclei. The target was the follicle cell nucleus. Simplified species-specific thyroid models were used to investigate the contribution from surrounding follicles. Monte Carlo simulations were performed using the general purpose radiation transport code MCNPX 2.6.0.
Results:When211At was homogeneously distributed within the follicle lumen, the mean specific energies per decay,hzi, to the follicle cell nucleus were 2.0, 1.1 and 0.17 mGy for mouse, rat and man, respectively.
Corresponding values for the single-hit mean specific energy per decay,hz1i, were 1.3, 0.61 and 0.37 Gy. Assuming a homogeneous211At concentration in the follicle lumen,<0.5%, 7%, and 45% of the emitted alpha particles were fully stopped within the follicle lumen for the respective models.
Conclusions:The results clearly show the influence of the follicle size, alpha particle range and211At location within the thyroid follicle on the dosimetric parameters. Appropriate thyroid models are required for translation of dosimetric parameters between species.
Keywords:microdosimetry,211At, thyroid follicle, specific energy, Monte Carlo
Background
The alpha emitter 211At is proposed in radionuclide therapy because of the optimal linear energy transfer (LET), high RBE value and independence of dose rate and oxygen level [1,2].211At is well suited for therapy of microscopic tumours due to the short range of the alpha particles, 48 to 70 μm in liquid water [3]. 211At decays through two branches both with the emission of an alpha particle to stable 207Pb, and in the decay process, 77 to 92 keV K X-rays are emitted, permitting external detection and imaging [4,5]. Astatine is like iodine a halogen, and
free 211At is taken up by the thyroid gland partly in a similar way as iodide.In vitrostudies have shown that the transport of211At in the basal-to-apical direction was partly similar to that of125I, although differences occur [6].
Relatively, few studies have been performed of the pharmacokinetics of free211At in animals and man, most of them 60 to 70 years ago [7-15]. The data show a high uptake in normal thyroid gland of 211At in monkeys, guinea pigs, rats and mice. The maximum uptake has been reported to occur at approximately 4 h after injection for mice [12,13].
For radiation protection purposes it is, thus, important to have appropriate dosimetric models of 211At in the thyroid. Such models are valuable both for patients
* Correspondence:[email protected]
Department of Radiation Physics, Institute of Clinical Sciences, Sahlgrenska Cancer Center, Sahlgrenska Academy at the University of Gothenburg, Sahlgrenska University Hospital, Gothenburg, 413 45, Sweden
receiving 211At-labelled pharmaceuticals, where some 211
At might be released in vivo, and also for personnel handling 211At with a potential risk of internal contam-ination. Furthermore, preclinical experimental thera-peutic studies of 211At-labelled substances are usually performed on mice and rats before possible introduction to the clinic. Then, methods to translate data between animals and man are of great value to estimate absorbed dose to critical organs and predict side effects.
The aims of this study were to develop thyroid models for mouse, rat and man, and to perform Monte Carlo simulations for211At to study the effect of geometry and biodistribution on microdosimetric parameters for the three species.
Methods
Two different models were developed in this work: 1) a sin-gle follicle model and 2) a multiple thyroid follicle model.
Single thyroid follicle model
The single thyroid follicle model used in this work consists of a single layer of thyroid follicular cells surrounding a spherical follicle lumen (Figure 1). The follicle lumen diam-eter was 10 to 500μm. The surrounding follicle cells had a thickness of 6, 8 or 10μm with a centrally located spherical nucleus with diameters of 4, 6 and 8μm, respectively. For the species-specific models, the follicle lumen diameter, fol-licle cell thickness and nucleus diameter were: 1) 50, 6 and 4μm for mouse, 2) 70, 8 and 6μm for rat and 3) 150, 10 and 8μm for man, respectively. The densities of the follicle lumen and the follicular cells were assumed to be that of li-quid water (unit density). The selected dimensions were chosen according to the literature and further presented in the‘Discussion’section [16-23].
Four different source compartments and 211At distri-butions were used: A) 211At homogeneously distributed
within the follicle lumen, B) 211At distributed on con-centric spherical surfaces within the follicle lumen (to investigate heterogeneous distributions within the follicle lumen), C) 211At homogeneously distributed within the follicle cells and D) 211At homogeneously distributed within the follicle cell nuclei. The follicle cell nuclei were the target in most simulations. The six follicular cell nuclei symmetrically positioned on the perpendicularx-,y- and z-axes around the follicle lumen were used to calculate an average value for one nucleus.
Multiple thyroid follicle model
The model was used to calculate the contribution from one layer of neighbouring follicles to the follicle cell nuclei in a centrally placed follicle (Figure 2). Calculations were performed for the mouse, rat and human models. The neighbouring follicles were modelled as one surrounding layer of follicle cells and an outer region simulating the follicle lumens with the respective thicknesses: 1) 6 and 50μm for the mouse, 2) 8 and 70μm for the rat, and 3) 10 and 150μm for the human model. In this model, two source compartments were used: E)211At homogeneously distributed within the surrounding follicle lumens, and F) 211
At homogeneously distributed within the surrounding follicle cells. The targets were the follicle cell nuclei in the central follicle, and the six symmetrically positioned follicular cell nuclei were used to calculate an average value for one nucleus.
Monte Carlo simulations
The simulations were performed using the general pur-pose Monte Carlo radiation transport code MCNPX 2.6.0
Figure 1Schematic illustration of the single thyroid follicle model.Schematic illustration of the spherical thyroid follicle geometry; a follicle lumen (blue) is surrounded by a layer of follicle cells (green) with six symmetrically positioned follicle cell nuclei (red) from which an average value for a follicle cell nucleus is calculated.
[24] on a MacBook Pro with a 2.66 GHz Intel Core 2 Duo processor with Mac OS X version 10.6.8 (Apple Inc., Cupertino, California, United States). The tally F6, in units of MeV/g, was used in MCNPX to calculate the energy deposited in the target volume. The cut-off energy for the simulated alpha particles was 1 keV, and the sampling fre-quency was the default value in the MCNPX code. For each geometric setup, a number of 107 particle histories were simulated, and one history represented a single decay of211At. Only the main two alpha particle energies in the 211
At decay, i.e. 5.867 MeV (42% yield) and 7.450 MeV (58% yield), were used in the simulations. The photons and electrons emitted were not considered since their energy deposits in the target is negligible compared to that of the alpha particles. The recoil energy from the daughter nuclei207Bi and207Pb following the alpha decay, with the kinetic energy of 114 and 144 keV, respectively [25], was also not considered since it would only contribute for 211At distributed within the follicle cell nucleus, maybe a less likely situation. The total decay of 211At
to 207Pb was assumed to occur in the same volume
element, i.e. diffusion of211Po (0.52 s half-life) before alpha decay was neglected.
To investigate the effects on the microdosimetric parameters for different concentrations of stable iodine within the follicle lumen, additional calculations were performed for a 1% and 2% concentrations of stable iodine (127I, density 4.94 g/cm3) homogeneously distributed within the follicle lumen.
Microdosimetric parameters
The following microdosimetric parameters were simulated in this work: the mean specific energy,hzi, is the average energy deposited in the target per decay of211At, includ-ing histories with zero specific energy
〈z〉¼ 1
N ∑
N
i¼1zi;ðzi≥0Þ; ½ Gy;
and is equivalent to the S-value in the MIRD formalism [26].Nis the total number of histories simulated, and zi, the specific energy in units of Gy for historyi[27].
The single-hit mean specific energy per event,hz1i, is the average energy deposited for the histories when the particle hits the target, i.e. excluding all histories with zero specific energy
〈z1〉¼
1
M ∑
M
i¼1zi;ðzi>0Þ; ½ Gy;
whereMis the total number of histories simulated that hits the target [27]. The single-hit specific energy distribution for the target is denoted asf(z1).
The lineal energy,y, is defined as
y¼ε
l ;½keV=μm;
whereεis the energy imparted in the target volume and l is the mean chord length for the target [27]. Based on Cauchy’s theorem, the mean chord length for a spherical volume with the diameter,d, is given by [28]
l¼2⋅d 3 ;½μm
The frequency-mean lineal energy, 〈yF〉, is the average
energy deposited for all simulated particles that hit the target
〈yF〉¼
1
M ∑
M
i¼1yi;ðyi>0Þ;½keV=μm
The lineal energy distribution, f(y), is defined for single energy-deposition events only and is independent of the absorbed dose or dose rate [27].
Macrodosimetry
According to the MIRD formalism, the mean absorbed dose,D, is the average energy per unit mass deposited in a target volume
D¼A~⋅Δ⋅ϕ m ; ½ Gy;
whereÃis the cumulated activity in the source volume, Δthe mean energy emitted per nuclear transition, andϕ is the absorbed fraction in the thyroid and m the mass of the thyroid [26].
The mean absorbed dose could also be expressed as
D¼A~⋅S; ½ Gy;
whereSis equivalent to the mean specific energy,〈z〉. When comparing MIRD and microdosimetric data, the211At activity in the thyroid gland was assumed to be homogeneously distributed within the follicle lumens, and 70% of the thyroid gland was assumed to consist of follicles in the microdosimetric calculations [29].
The cumulated activity equivalent to a mean absorbed dose to the thyroid of 1 Gy for the different species was
calculated under the following assumptions: ϕ= 1,
Δ= 6.8 MeV andmis 3 mg for mouse, 30 mg for rat and 19 g for man [12,17,30,31].
Statistical analyses
Results
Single thyroid follicle model with211At distributed in the follicle lumen
Mean specific energy,hzi
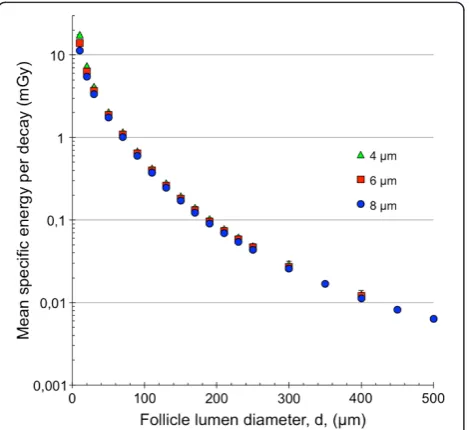
The mean specific energy, hzi, for the 4-, 6- and 8-μm diameter follicle cell nuclei with211At homogeneously dis-tributed within the follicle lumen as a function of the fol-licle lumen diameter is shown in Figure 3. For the 10-μm diameter follicle lumen diameter, hziwas 35% higher for the 4-μm compared with the 8-μm diameter follicle cell nu-clei. This difference decreased to about 12% for the 70-μm follicle lumen diameter and remained constant at around 12% to 13% for increasing follicle lumen diameter.
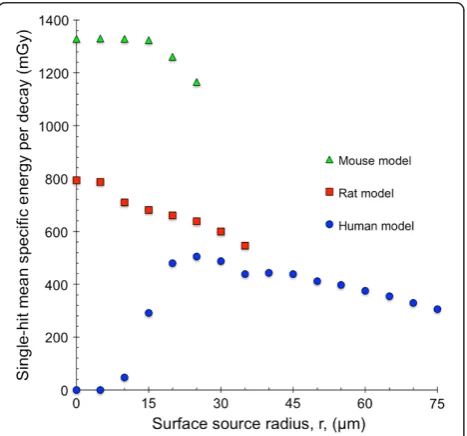
The mean specific energy, hzi, for the mouse, rat and human models with 211At homogeneously distributed on concentric spherical surfaces within the follicle lumen as a function of the surface source radius is shown in Figure 4. hzi was highest for the mouse model and lowest for the
human model. For the human and mouse models, hzi
increased with the surface source radius to a maximum peripherally in the follicle lumen. For the rat model, hzi initially decreased with increasing surface source radius, reaching a minimum for a radius of 15μm, then increas-ing to a maximum peripherally in the follicle lumen.
Single-hit mean specific energy,hz1i
The single-hit mean specific energy, hz1i, for the 4-, 6- and 8-μm diameter follicle cell nuclei with 211At
homogeneously distributed within the follicle lumen as a function of the follicle lumen diameter is shown in Figure 5. hz1i initially increased with the follicle lumen diameter up to a level after which it remained constant. This level was reached at the follicle lumen diameters of 150-, 110- and 90-μm for the follicle cell nuclei diameters 4, 6 and 8 μm, respectively. hz1i for the 4-μm nucleus diameter was about two to four times higher than for the 6-μm and 8-μm follicle cell nucleus diameters, respectively.
The single-hit mean specific energy,hz1i, for the mouse,
rat and human models with 211At homogeneously
dis-tributed on concentric spherical surfaces within the follicle lumen as a function of the surface source radius is shown in Figure 6. hz1i was highest for the mouse model and lowest for the human model. For the mouse and rat models, hz1idecreased with increasing surface source radius from a maximum value in the centre of the follicle lumen. The minimum value was reached peripherally in the follicle lumen for the largest surface source radius. The human model had the minimum value of hz1i = 0 in the centre of the follicle lumen when the alpha particles did not reach the follicle cell
nuclei. The maximum hz1i value was reached for the
surface source radius 25 μm; after which; it decreased with increasing surface source radius.
Figure 3Mean specific energy for the single thyroid follicle model.The mean specific energy,hzi, for the 8- (blue filled circle), 6- (red filled square) and 4-μm (green filled triangle) follicle cell nucleus per decay.211At was homogeneously distributed within the
follicle lumen. The follicle lumen diameter,d, varied between 10 and 500μm. Note the logarithmic scale on they-axis. Error bars indicate SD and are smaller than the data symbol when not visible.
Single-hit specific energy distribution, f(z1)
The single-hit distribution of specific energy,f(z1), in the follicle cell nucleus for the mouse, rat and human models
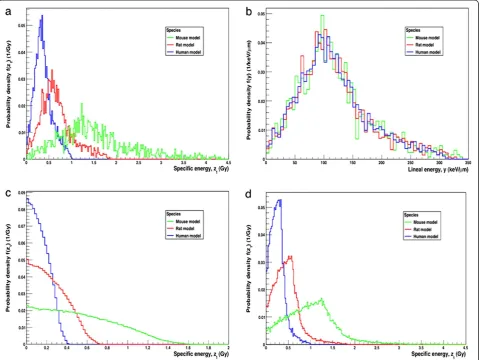
with 211At homogeneously distributed within the follicle lumen is shown in Figure 7a. The maximum single-hit specific energies were 4.4, 1.9 and 0.99 Gy, respectively, for mouse, rat and man. The corresponding single-hit mean specific energies, hz1i, were 1.3, 0.61 and 0.37 Gy, respectively, for mouse, rat and man (Table 1).
Lineal energy distribution, f(y)
The lineal energy distribution, f(y), in the follicle cell nucleus for the mouse, rat and human models with211At homogeneously distributed within the follicle lumen, is shown in Figure 7b. The maximum lineal energies were 340, 330 and 310 keV/μm, respectively, for mouse, rat and man. The frequency-mean lineal energy, 〈yF〉, for
mouse was 98 keV/μm, for rat 110 keV/μm, and for man 120 keV/μm.
Fraction of the emitted alpha particles that deposit all energy in the follicle lumen
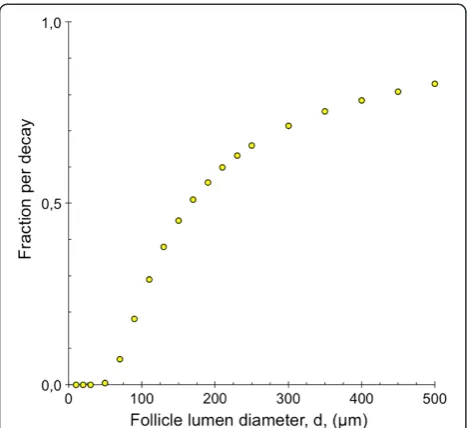
The fraction of the total emitted alpha particles per decay that deposit all kinetic energy within the follicle lumen, with211At homogeneously distributed within the follicle lumen, is shown in Figure 8. For follicle lumen diameters smaller than 50 μm, less than 0.5% deposits all kinetic energy within the lumen. For a diameter of 170 μm, the contribution from the two different alpha particles emitted per decay is equal, 25.5% each, result-ing in a total of 51% that deposits all kinetic energy within the lumen. For follicle lumen diameters smaller than 170 μm, the contribution from the alpha particle with the lower kinetic energy (5.867 MeV) dominates, and for larger follicle lumen diameters, the contribution from the alpha particle with the higher kinetic energy (7.45 MeV) dominates. For the species-specific models, the amounts of alpha particles depositing all their energy in the follicle lumen were <0.5%, 7% and 45% for mouse, rat and man, respectively.
Single thyroid follicle model with211At distributed in the follicle cells
Specific energy distribution, f(z), for211At distributed in the follicle cell nucleus
The specific energy distribution,f(z), for 211At homoge-neously distributed within in the different sized cell nu-clei is shown in Figure 7c. For each of the models, mouse, rat and man,hziandhz1iand are equal since the nuclei are both sources and targets and were 0.54, 0.24 and 0.14 Gy, respectively (Table 1).
Single-hit specific energy distribution, f(z1), for 211
At distributed in the follicle cells
The single-hit distribution of specific energy, f(z1), for
the mouse, rat and human models with 211At
homoge-neously distributed within the follicle cells, including
Figure 6Single-hit mean specific energy for the species-specific thyroid follicle models.The single-hit mean specific energy,hzi, for the human (blue filled circle), rat (red filled square) and mouse model (green filled triangle) per decay.211At was homogeneously distributed
on concentric spherical surfaces with radius,r, within the follicle lumen. For the 0-μm radius surface, a point source was used. Error bars indicate SD and are smaller than the data symbol when not visible.
Figure 5Single-hit mean specific energy for the single thyroid follicle model.The single-hit mean specific energy,hz1i, for the 8- (blue
both cytoplasm and nucleus, is shown in Figure 7d. For the mouse, rat and human models,hziwere 2.7, 1.4, 0.32 mGy, andhz1iwere 1.0, 0.46 and 0.26 Gy, respectively (Table 1).
Influence of stable iodine in the follicle lumen for a single follicle model
Table 2 showshziandhz1ifor the mouse, rat and human models with concentrations of 0%, 1% and 2% of stable iodine,127I, homogeneously distributed within the follicle lumen. For the mouse model, there was a small increase in hzi with increasing iodine concentration. For the rat and human models, the opposite result was found. For the mouse and rat models, there was a small increase inhz1i, while in the human model,hz1iremained fairly constant with increasing iodine concentration.
Figure 7Probability distributions for the art-specific thyroid follicle models.(a) Single-hit specific energy distribution,f(z1), for the mouse,
rat and human models per211At decay that hits the target nuclei with211At homogeneously distributed within the follicle lumen. (b) Lineal
energy distribution,f(y), for the mouse, rat and human models per211At decay that hits the target nuclei with211At homogeneously distributed
within the follicle lumen. (c) Single-hit specific energy distribution,f(z1), for the mouse, rat and human models with211At homogeneously
distributed within the follicle cell nucleus. This is the self-absorbed specific energy distribution for the follicle cell nucleus. For panels a, c and d, the bin size used were 20 mGy; for panel b, the bin size used was 5 keV/μm, and the area under each curve was normalised to 1. (d) Single-hit specific energy distribution,f(z1), for the mouse, rat and human models per211At decay that hits the target nuclei with211At homogeneously
distributed within the follicle cells.
Table 1hziandhz1idata for single thyroid follicle models depend on source compartment
Nucleus Nucleus Nucleus Follicle cells Nucleus Lumen hziandhz1i(Gy) hzi(Gy) hz1i(Gy) hzi(Gy) hz1i(Gy)
Mouse 5.36E-1 2.74E-3 1.01E0 2.03E-3 1.25E0
(1.13E-4) (1.91E-5) (3.48E-3) (1.76E-5) (4.67E-3)
Rat 2.40E-1 1.40E-3 4.60E-1 1.08E-3 6.14E-1
(5.07E-5) (9.38E-6) (1.61E-3) (9.12E-6) (2.33E-3)
Man 1.36E-1 3.17E-4 2.57E-1 1.71E-4 3.70E-1
(2.86E-5) (3.36E-6) (1.42E-3) (2.83E-6) (2.79E-3)
The mean specific energy,hzi, and the single-hit mean specific energy,hz1i
for the mouse, rat and human models per decay.211
Multiple thyroid follicle models
The contribution from 211At homogeneously distributed within one surrounding layer of neighbouring follicles to a central-placed follicle for the mouse, rat and human models is presented in Table 3. The contribution to hzi from one211At decay in the surrounding follicle lumen was low, only 13%, 7% and 4% for mouse, rat and man, respectively, compared to that from one211At decay in the actual follicle lumen. Corresponding values forhz1iare 130%, 120% and 110%, demonstrating that hz1i from211At in surrounding
follicle lumen was higher than from the actual follicle. For 211At homogeneously distributed within the sur-rounding follicle cells, hziwas up to half of the values for 211At homogeneously distributed within the central follicle cells per decay. Corresponding values forhz1iwere up to 130%, demonstrating higher values for211At homo-geneously distributed within the surrounding follicle cells per decay (Table 3).
Comparison between microdosimetry and MIRD
Dosimetry with211At homogeneously distributed with the thyroid gland
Using the cumulated activity that gives 1 Gy in mean absorbed dose to the thyroid gland based on MIRD formalism in mouse, rat and man, corresponding mean absorbed doses to the follicle cell nucleus based on the microdosimetric calculations were 0.84 Gy (self-contribution of 0.33 Gy (39%) and contribution from the neighbouring follicles of 0.51 Gy), 1.18 Gy (self-contribution of 0.79 Gy (67%) and contribution from the neighbouring follicles of 0.39 Gy), and 0.71 Gy (self-contribution of 0.52 Gy (73%) and contribution from the neighbouring follicles of 0.19 Gy), respectively, for 211At homogeneously distributed within the follicle lumens.
Discussion
When developing a mathematical model of a tissue for dosimetric purposes, it is necessary with simplifications in geometry. For the thyroid, spherical follicles were assumed, although follicles have been described as convex entities of tetrakaidecahedral shape with larger follicles peripherally in the thyroid gland [20]. The present study concerns alpha particles with ranges compared with the species-specific models in the order of the size of one follicle diameter or down to 1/3 of a follicle diameter. For studies on particles with such short ranges (or with very long ranges, when the model does not influence the results at all), we consider spherical models to give realistic results. We also believe that the overall findings and relations between results from different species in this paper are valid and important in translational research.
In the Monte Carlo simulations, only the emitted alpha particles in the 211At decay were assumed to deposit energy in the target volume. This assumption was based on the energy released per211At decay for the different radiation types: 6.92 MeV for alpha particles, 0.05 MeV for electrons, and 0.68 MeV for photons [5]. For electrons, the energy released per decay is negligible compared to that of the alpha particles. For photons, the energy released per decay is about 10% of the alpha particles; this fact, combined with the low energy deposition per inter-action and long mean free path in tissue, the contribution to the energy deposited in the target volume was neglected.
Figure 8Fraction of emitted alpha particles that deposit all kinetic energy within the follicle lumen.The fraction of emitted alpha particles per decay that deposited all kinetic energy within the follicle lumen for follicle lumen diameter,d, between 10 and 500μm.211At was homogeneously distributed within the follicle lumen. Error bars indicate SD and are smaller than the data symbol when not visible.
Table 2 Influence of stable iodine onhziandhz1iin the single thyroid follicle models
0% Iodine 1% Iodine 2% Iodine
Nucleus Lumen Nucleus Lumen Nucleus Lumen hzi(Gy) hz1i(Gy) hzi(Gy) hz1i(Gy) hzi(Gy) hz1i(Gy)
Mouse 2.03E-3 1.25E0 2.04E-3 1.26E0 2.04E-3 1.27E0
(1.76E-5) (4.67E-3) (1.78E-5) (4.73E-3) (1.79E-5) (4.83E-3)
Rat 1.08E-3 6.14E-1 1.08E-3 6.18E-1 1.07E-3 6.21E-1
(9.12E-6) (2.33E-3) (9.13E-6) (2.35E-3) (9.12E-6) (2.42E-3)
Man 1.71E-4 3.70E-1 1.66E-4 3.70E-1 1.61E-4 3.70E-1
(2.83E-6) (2.79E-3) (2.79E-6) (2.86E-3) (2.75E-6) (2.91E-3)
The mean specific energy,hzi, and the single-hit mean specific energy,hz1i, for the mouse, rat and human models per211
At decay. The follicle lumen consisted of water and homogeneously distributed stable iodine (0%, 1% or 2%127
I).211
Furthermore, the generation of delta particles and brems-strahlung from the alpha particle track was not accounted for in the Monte Carlo simulations. The MCNPX code uses the collision stopping power value with energy straggling and multiple scattering algorithms when calculating the energy deposit in the target volume. According to Kellerer and Chmelevsky, the energy deposit for alpha particles in water with kinetic energies less than 10 MeV could accur-ately be determined without including the delta particles in the calculations for spherical volumes down to a diam-eter of 1μm [33]. We, therefore, assumed that neglecting specific calculations of the delta particles would not influ-ence the overall results. Also, the generation of brems-strahlung could be neglected for heavy charged particles since the generation is inversely proportional to the square of the particle mass [34].
To our knowledge, only one publication has previously dealt with dosimetry for a thyroid model, and that case used the Monte Carlo code CELLDOSE for 131I [22]. In that model, a human follicle was represented by a 170-μm diameter sphere consisting of a 150-μm diameter follicle lumen surrounded by a 10-μm layer of thyroid follicle cells. Our human model is similar to that model regarding spherical geometry and the follicle size. However, in the presented study, the influence of size of follicle and cell nucleus was also studied, and specific models for mouse and rat were defined.
When performing calculations for the different species, models were created based on the average thyroid follicle sizes. The mean weight of the thyroid gland for man is approximately 19 g (range 8 to 48 g) [30], for rat approxi-mately 30 mg [31] and approxiapproxi-mately 3 mg for mouse [12,17]. There is also a difference in follicle size between the species. In man, the diameter of the follicle varies
be-tween 30 and 840 μm [23] with mean values of 160 to
170 μm [21,22]. For rat, the follicle diameter size varies between 20 and 230μm [19,20] with a mean value of 78 to 88 μm [18-20]. For mouse, only follicular areas have been reported, being 2,000 to 5,000 μm2 with a mean value of 2,200 μm2 and about 200 follicles per mm2
[16,17]. This corresponds to a diameter of 53μm assuming spherical geometry of the follicle. This value might, however, be an underestimation of the true value since all tissue slices were not in the centre of each follicle. The choice of the mean follicle diameters in the mouse, rat and human models was based on these studies. It should be noted the follicle size may change with age [23,35], time of day [19], as well as thyroid disorders [21], and an iodine-rich diet might result in larger follicles [18,20].
The difference in follicle size within the human thyroid results in about 500 times higherhzito the follicle cell nucleus in follicles with 30 compared to 500-μm diameter follicle lumen (Figure 3). In man, smaller follicles (dia-meters<100μm) are more common in children (<12 years old) and larger follicles (diameters>200μm) more com-mon in adults [23]. For example,hzito the follicle cell nu-cleus is 7 times higher for a 90-μm diameter follicle lumen compared to a 190-μm diameter follicle lumen (both with a 8-μm cell nucleus). This indicates thathzicould be higher in children. In the mouse model, less than 0.5% of the emit-ted alpha particles deposit all their kinetic energy within the follicle lumen compared to 7% for the rat model and 45% for the human model. These results indicate that dosi-metric parameters cannot readily be translated between animal and human models.
The multiple follicle thyroid model used in this work is a simplification, with a single spherical layer of follicle cells surrounding the central follicle and the neighbouring follicle lumen simulated as a spherical shell around the outer cell layer. The outer follicle lumen had a thickness equal to the diameter of the model used. Inter-follicular tissue was not included in the space between the central follicle and neighbouring follicles and would probably re-duce the absorbed dose only to a small extent. In the models created in this work for mouse, rat and human, only one layer of neighbouring follicles will contribute to the energy depositions to the central follicle cell nuclei due to the short range of the alpha particles, justifying the simplification with one surrounding follicle layer. In the
Table 3hziandhz1idata for the single and multi-thyroid follicle models
Single follicle Surrounding follicles
Nucleus Lumen Nucleus Follicle cells Nucleus Lumen Nucleus Follicle cells
hzi(Gy) hz1i(Gy) hzi(Gy) hz1i(Gy) hzi(Gy) hz1i(Gy) hzi(Gy) hz1i(Gy)
Mouse 2.03E-3 1.25E0 2.74E-3 1.01E0 2.57E-4 1.67E0 1.50E-3 1.26E0
(1.76E-5) (4.67E-3) (1.91E-5) (3.48E-3) (7.39E-6) (2.22E-2) (1.54E-5) (5,77E-3)
Rat 1.08E-3 6.14E-1 1.40E-3 4.60E-1 7.60E-5 7.37E-1 7.38E-4 5.86E-1
(9.12E-6) (2.33E-3) (9.38E-6) (1.61E-3) (2.65E-6) (1.16E-2) (7.38E-6) (2.67E-3)
Man 1.71E-4 3.70E-1 3.17E-4 2.57E-1 6.24E-6 4.13E-1 1.74E-4 3.37E-1
(2.83E-6) (2.79E-3) (3.36E-6) (1.42E-3) (5.73E-7) (1.77E-2) (2.71E-5) (2.36E-3)
model created by Hindie et al.,131I in up to 12 layers of fol-licles contributed to the absorbed dose to the central follicle cells [22]. The self-contribution to the total-absorbed dose from radionuclide in the follicle lumen was 17% for 131I [22], compared to 73% for 211At as found in the present study. Thus, the single follicle thyroid model, maybe sup-plied with one surrounding follicle layer, is a simple and realistic model when studying radionuclide emitting parti-cles with ranges up to that of alpha partiparti-cles, while more follicle layers are needed for particles with longer range.
To our knowledge, no firm data on the biokinetics of 211At in the thyroid on the microscopic level exist. We have only found one autoradiographic study demon-strating the distribution of211At within the follicles in rats [10] and a few on the distribution of125I [36,37]. Results from125I in rat show that the concentration of radioiodine early in the uptake phase was higher in the smaller folli-cles. The distribution within most follicle lumens was homogeneous but heterogeneous in some follicles, usually in the form of a ring peripherally [36,37]. Based on these studies and that 211At is supposed not to be bound to thyroglobulin, calculations were done with211At distribu-ted within different source compartments, including het-erogeneous distribution within the follicle lumen using concentric spherical surfaces. The results show that hzi increased with longer surface source radius for the human
and mouse models. For the human model, hzi was zero
for short radii of the surface sources due to the range of the alpha particles, while it increased with longer radius. For the rat model,hzidecreased from a high value at the centre (radius = 0) to a minimum, and then increased up to the maximum radius. For the mouse model,hziincreased with longer radius. The reason for these differences is the effect of the Bragg peak of the alpha particle, i.e. a higher energy deposition in the end of the track, which should be considered when the follicle lumen radius is similar to the range of the alpha particles.
To our knowledge, microdosimetric determinations have not previously been performed for211At in the thy-roid. There are, however, data for 211At homogeneously distributed within a cell nucleus calculated by an analyt-ical method [38]. Our results for hziandhz1ifor follicle
cell nucleus diameters of 4, 6 and 8 μm show good
agreement (only 2.8% to 3.7% higher values) compared with the published data.
Since iodine is absorbed by the thyroid and has a rela-tively high atomic number, Z= 53, presence of iodine might influence the interaction of the alpha particles within the follicle lumen, leading to a higher energy loss per unit length. In rats, the concentration of stable iodine in the follicle lumen is approximately 0.9% to 2.1% [18]. However, the present results clearly show that the pres-ence of stable iodine in the follicle lumen had little effect on the dosimetric results for mouse and rat models, and
the difference in the human model was 6% lowerhzi for an iodine concentration of 2% within the follicle lumen.
The physical properties of the radiohalogens211At, 131I and125I vary considerably and result in different mechan-isms of action and biological effects on thyroid follicle cells. Alpha particles from211At have a very short range in tissue, resulting in high average LET (approximately 100 keV/μm) and high RBE values. This makes them highly cytotoxic for biological tissue, and cell survival studies have shown that only a few transversals per cell nucleus may inactivate a cell [39,40]. Beta particles from 131
I main beta spectrum with endpoint energy of 606 keV (89.4% yield) and maximum range of 2.3 mm in tissue [41] result in low average LET (approximately 0.2 keV/μm). It is considered that several thousands of transversals are needed to inactivate a cell [4]. 125I emits on average 20 Auger and conversion electrons with ranges from
nano-metres up to 23 μm and LET values of 4 to 26 keV/μm
[42]. When internalised into a cell and especially when incorporated in the DNA,125I can be highly toxic to a cell [43]. We have experimentally compared toxic effects of radionuclides in thyroid follicle cells and shown that the highest effect was obtained for211At, followed by123I (emits Auger and conversion electrons similar to125I), while the least effect was obtained by131I [44].
Usually, MIRD formalism and macrodosimetry have been used to determine mean absorbed dose to the thyroid for211At, assuming homogeneous activity con-centration in thyroid tissue [13,14]. To compare if microdosimetry would give other absorbed doses than conventional macrodosimetry, we calculated the absorbed dose to the follicle cell nuclei from the amount of 211At homogeneously distributed in the lumens (multiple follicle model) that gives a mean absorbed dose of 1 Gy. Corre-sponding microscopic data were then 0.84, 1.18 and 0.71 Gy for the mouse, rat and human models, respectively. A similar comparison for131I gave a microdosimetric value of 0.98 Gy to the follicle cells due to the longer ranges of the electrons emitted [22]. Thus, our results show the im-portance of microdosimetry for non-homogeneous distri-bution of radionuclides emitting short-ranged particles in a thyroid.
Conclusions
This study clearly demonstrates differences in energy deposition in the follicle cell nuclei depending on the location of211At in the follicle, and the size of the follicle, the follicle cell and its nucleus, which indicate the import-ance of species-specific models for dosimetric estimations for211At. The dosimetric parameters for211At in the thy-roid cannot readily be translated between species.
Competing interests
Acknowledgements
The authors thank Dr Manuel Bardiès, Nantes, and his research group for valuable help and input regarding the use of MCNPX. This study was supported by grants from the European Commission FP7 Collaborative Project TARCC HEALTH-F2-2007-201962, the Swedish Research Council, the Swedish Cancer Society, BioCARE, a National Strategic Research Program at University of Gothenburg, the Swedish Radiation Safety Authority, the King Gustav V Jubilee Clinic Cancer Research Foundation and the Assar Gabrielsson Cancer Research Foundation. The work was performed within the EC COST Action BM0607.
Authors’contributions
Both authors designed the study. AJ performed the MC simulations and drafted the manuscript. Both authors contributed to the scientific and intellectual discussion and interpretation of the data and revision of the manuscript. Both authors read and approved the final manuscript.
Authors’information
AJ is a PhD student at the Department of Radiation Physics, Sahlgrenska Academy at the University of Gothenburg and has an MSc in medical physics. EFA is a Professor at the Department of Radiation Physics, Sahlgrenska Academy at the University of Gothenburg.
Received: 12 February 2012 Accepted: 9 June 2012 Published: 9 June 2012
References
1. Hall EJ:Radiobiology for the Radiologist. 6th edition. Philadelphia, USA: Lippincott Williams & Wilkins; 2006.
2. Zalutsky MR, Bigner DD:Radioimmunotherapy with alpha-particle emitting radioimmunoconjugates.Acta Oncol1996,35:373–379. 3. International Commission on Radiation Units and Measurements:ICRU
Report 49: Stopping Powers and Ranges for Protons and Alpha Particles. Bethesda, MD: International Commission on Radiation Units and Measurements; 1993.
4. McDevitt MR, Sgouros G, Finn RD, Humm JL, Jurcic JG, Larson SM, Scheinberg DA:Radioimmunotherapy with alpha-emitting nuclides.Eur J Nucl Med1998,25:1341–1351.
5. Nuclear decay data in the MIRD format. [http://www.nndc.bnl.gov/mird/]. 6. Lindencrona U, Nilsson M, Forssell-Aronsson E:Similarities and differences
between free 211At and 125I- transport in porcine thyroid epithelial cells cultured in bicameral chambers.Nucl Med Biol2001,28:41–50. 7. Cobb LM, Harrison A, Butler SA:Toxicity of astatine-211 in the mouse.
Human Toxicology1988,7:529–534.
8. Hamilton JG, Durbin PW, Parrott M:The accumulation and destructive action of astatine-211 (eka-iodine) in the thyroid gland of rats and monkeys.
Journal of Clinical Endocrinology & Metabolism1954,14:1161–1178. 9. Hamilton JG, Soley MH:A comparison of the metabolism of iodine and of
element 85 (eka-iodine).Proc Natl Acad Sci USA1940,26:483–489. 10. Hamilton JG, Asling CW, Garrison WM, Scott KG:The accumulation,
metabolism, and biological effects of astatine in rats and monkeys.Univ Calif (Berkeley) Publs Pharmacol1953,2:283–344.
11. Hamilton JG, Asling CW, Garrison WG, Jue B, Scott KG, Wallace PC, Haymond HR:The destruction of thyroid tissue in the rat by the halogen, astatine.J Clin Invest1950,29:820.
12. Harrison A, Royle L:Determination of absorbed dose to blood, kidneys, testes and thyroid in mice injected with 211At and comparison of testes mass and sperm number in X-irradiated and211At treated mice.Health Physics1984,46:377–383.
13. Lundh C, Lindencrona U, Schmitt A, Nilsson M, Forssell-Aronsson E:
Biodistribution of free 211At and 125I- in nude mice bearing tumors derived from anaplastic thyroid carcinoma cell lines.Cancer Biother Radiopharm2006,21:591–600.
14. Spetz J, Rudqvist N, Forssell-Aronsson E:Biodistribution and dosimetry of free 211At, 125I- and131I- in rats. Institute of Clinical Sciences at Sahlgrenska Academy, University of Gothenburg, Gothenburg, Sweden: MSc thesis; 2011. 15. Hamilton JG, Durbin PW, Parrott MW:Accumulation of astatine-211 by
thyroid gland in man.Proc Soc Exp Biol Med1954,86:366–369. 16. Friedrichs B, Tepel C, Reinheckel T, Deussing J, von Figura K, Herzog V,
Peters C, Saftig P, Brix K:Thyroid functions of mouse cathepsins B, K, and L.J Clin Invest2003,111:1733–1745.
17. Clement S, Refetoff S, Robaye B, Dumont JE, Schurmans S:Low TSH requirement and goiter in transgenic mice overexpressing IGF-I and IGF-Ir receptor in the thyroid gland.Endocrinology2001,142:5131– 5139.
18. Robison WL, Davis D:Determination of iodine concentration and distribution in rat thyroid follicles by electron-probe microanalysis.J Cell Biol1969,43:115–121.
19. Uchiyama Y, Oomiya A, Murakami G:Fluctuations in follicular structures of rat thyroid glands during 24 hours: fine structural and morphometric studies.Am J Anat1986,175:23–33.
20. Penel C, Rognoni JB, Durieu D, Simon C:Stereological analysis of thyroid follicle structure.Experientia1981,37:1010–1012.
21. Jackson JL:The shape and size of the human thyroid follicle in health and disease.The anatomical record1931,48:219–239.
22. Hindie E, Champion C, Zanotti-Fregonara P, Rubello D, Colas-Linhart N, Ravasi L, Moretti JL:Calculation of electron dose to target cells in a complex environment by Monte Carlo code“CELLDOSE”.Eur J Nucl Med Mol Imaging2009,36:130–136.
23. Faggiano A, Coulot J, Bellon N, Talbot M, Caillou B, Ricard M, Bidart JM, Schlumberger M:Age-dependent variation of follicular size and expression of iodine transporters in human thyroid tissue.J Nucl Med
2004,45:232–237.
24. Pelowitz DB:MCNPX, User’s Manual Version 2.6.0. LA-CP-07-1473. New Mexico, USA: Los Alamos National Laboratory; 2008.
25. Roessler K, Eich G:Nuclear recoils from 211-At decay.Radiochimica Acta
1989,47:87–89.
26. Loevinger R:Budinger TF, Watson EE: MIRD Primer for Absorbed Dose Calculations. New York: The Society of Nuclear Medicine; 1988. 27. International Commission on Radiation Units and Measurements:ICRU
Report 36: Microdosimetry. Bethesda, Md., USA: International Commission on Radiation Units and Measurements; 1983.
28. Cauchy A:Memoire sur la rectification des courbes et la quadrature des sourface courbe. In Oevres Complétes d’Augustin Cauchy. Edited by Augustin Louis Cauchy. Paris: Gauthier-Villars; 1908.
29. Dow CJ, Dumont JE, Ketelbant P:Percentage of epithelial cells, fibroblasts and endothelial cells in the dog thyroid.C R Seances Soc Biol Fil1986,
180:629–632.
30. Bisi H, Fernandes VS, de Camargo RY, Koch L, Abdo AH, de Brito T:The prevalence of unsuspected thyroid pathology in 300 sequential autopsies, with special reference to the incidental carcinoma.Cancer
1989,64:1888–1893.
31. Soukup T, Zacharova G, Smerdu V, Jirmanova I:Body, heart, thyroid gland and skeletal muscle weight changes in rats with altered thyroid status.
Physiol Res2001,50:619–626.
32. X-5 MONTE CARLO TEAM:MCNP - A General Monte Carlo N-Particle Transport Code, Version 5 - Volume I: Overview and Theory, LA-UR-03-1987. New Mexico, USA: Los Alamos National Laboratory; 2003.
33. Kellerer AM, Chmelevsky D:Criteria for the applicability of LET.Radiation research1975,63:226–234.
34. Podgorsak EB:Radiation Physics for Medical Physicists. 2nd edition. Berlin: Springer Verlag; 2010.
35. Fujita H, Tamura S, Takano T, Ishibashi S, Tanaka T:Fine structural changes in the aging mouse thyroid.J Gerontol1980,35:3–15.
36. Loewenstein JE, Wollman SH:Distribution of organic 125-I and 127-I in the rat thyroid gland during equilibrium labeling as determined by autoradiography.Endocrinology1967,81:1074–1085.
37. Loewenstein JE, Wollman SH:Diffusion of thyroglobulin in the lumen of rat thyroid follicle.Endocrinology1967,81:1086–1090.
38. Stinchcomb T, Roeske J:Values of“S,”<z1>and<(z1)2>for dosimetry using alpha-particle emitters.Med Phys1999,26:1960–1971.
39. Walicka MA, Vaidyanathan G, Zalutsky MR, Adelstein SJ, Kassis AI:Survival and DNA damage in Chinese hamster V79 cells exposed to alpha particles emitted by DNA-incorporated astatine-211.Rad Res1998,
150:263–268.
40. Kassis AI, Harris CR, Adelstein SJ, Ruth TJ, Lambrecht R, Wolf AP:The in vitro radiobiology of astatine-211 decay.Rad Res1986,105:27–36.
41. Prestwich WV, Nunes J, Kwok CS:Beta dose point kernels for
radionuclides of potential use in radioimmunotherapy.J Nucl Med1989,
30:1036–1046.
42. Kassis AI:The amazing world of auger electrons.Int J Radiat Biol2004,
43. Sastry KSR:Biological effects of the auger emitter iodine-125: a review. Report No. 1 of AAPM Nuclear Medicine Task Group No. 6.Med Phys
1992,19:1361–1370.
44. Lundh C, Lindencrona U, Postgard P, Carlsson T, Nilsson M, Forssell-Aronsson E:Radiation-induced thyroid stunning: differential effects of (123)I, (131)I, (99 m)Tc, and (211)At on iodide transport and NIS mRNA expression in cultured thyroid cells.J Nucl Med2009,50:1161–1167.
doi:10.1186/2191-219X-2-29
Cite this article as:Josefsson and Forssell-Aronsson:Microdosimetric analysis of211At in thyroid models for man, rat and mouse.EJNMMI Research20122:29.
Submit your manuscript to a
journal and benefi t from:
7Convenient online submission
7Rigorous peer review
7Immediate publication on acceptance
7Open access: articles freely available online
7High visibility within the fi eld
7Retaining the copyright to your article