R E S E A R C H
Open Access
A semisoft thresholding method based on
Teager energy operation on wavelet packet
coefficients for enhancing noisy speech
Tahsina Farah Sanam and Celia Shahnaz
*Abstract
The performance of thresholding-based methods for speech enhancement largely depends upon the estimation of the exact threshold value. In this paper, a new thresholding-based speech enhancement approach, where the threshold is statistically determined using the Teager energy-operated wavelet packet (WP) coefficients of noisy speech, is proposed. The threshold thus obtained is applied to the WP coefficients of the noisy speech by employing a semisoft thresholding function in order to obtain an enhanced speech. A number of simulations were carried out in the presence of white, car, pink, and multi-talker babble noises to evaluate the performance of the proposed method. Standard objective measures as well as subjective evaluations show that the proposed method is capable of
outperforming the existing state-of-the-art thresholding-based speech enhancement approaches for noisy speech of high as well as low levels of SNR.
1 Introduction
Enhancement of noisy speech has been an important problem and has a broad range of applications, such as mobile communications, speech coding, and recognition and hearing aid devices [1]. The performance of such applications operating in noisy environments is highly dependent on the noise reduction techniques employed therein.
Various speech enhancement methods have been reported in the literature describing the know-how to solve the problem of noise reduction in speech enhance-ment methods. Speech enhanceenhance-ment methods can be generally divided into several categories based on their domains of operation, namely time domain, frequency domain, and time-frequency domain. Time domain meth-ods include the subspace approach [2], frequency domain methods include short-time Fourier transform (STFT)-based spectral subtraction [3-6], minimum mean square error (MMSE) estimator [7-11] and Wiener filtering [12-14], and time frequency-domain methods involve the employment of the family of wavelet [15-26]. All of the methods have their own advantages and drawbacks.
*Correspondence: [email protected]
Department of Electrical and Electronic Engineering, Bangladesh University of Engineering and Technology, Dhaka 1000, Bangladesh
In the MMSE estimator [7-11], the frequency spectrum of the noisy speech is modified to reduce the noise from noisy speech in the frequency domain. The spectral sub-traction method [3-6] is simple and attempts to estimate the spectral amplitude of the clean speech by subtracting an estimate of the noise spectral amplitude from that of the observed noisy speech. Finally, the estimated ampli-tude is combined with the phase of the noisy speech to produce the desired estimate of the clean speech STFT. In the Wiener filter approach [12-14], the estimator of the clean speech STFT is simply the MMSE estimator when considering Gaussian-distributed clean speech and noise. In that case, the phase of the resulting estimate turns out to be that of the noisy speech. The spectral subtraction fil-ter uses the instantaneous spectra of the noisy signal and the running average (time-averaged spectra) of the noise, whereas the Wiener filter is based on the ensemble aver-age spectra of the signal and noise. Although the spectral subtraction method provides a trade-off between speech distortion and residual noise to some extent, its major drawback is the perceptually annoying musical nature of the residual noise characterized by tones at different fre-quencies that randomly appear and disappear. One of the major problems of the Wiener filter-based method is the requirement of obtaining clean speech statistics necessary
for its implementation. The use of Wiener filter in speech enhancement generally introduces little speech distortion; however, as for the spectral subtraction approach, the speech enhanced based on the Wiener filter is also char-acterized by residual musical noises. Among the speech enhancement methods using time-frequency analyses, the use of nonlinear techniques based on discrete wavelet transform (DWT) [15-26] is a superior alternative to the methods using STFT-based analyses, such as spectral sub-traction and Wiener filtering. In the DWT, the fixed bandwidth of the STFT is replaced with one that is pro-portional to frequency that allows better time resolution at high frequencies than the STFT. Here, low frequencies are examined with low temporal resolution while high fre-quencies are observed with greater temporal resolution. Thus, the DWT gains more attractiveness in representing and preserving the signal energy in the presence of noise that needs to be removed in the speech enhancement pro-cess. Since the DWT-based speech enhancement methods exploit the superior frequency localization property of the DWT, they have more capability of reducing musical noise, thus achieving better noise reduction performance in terms of quality as well as intelligibility.
The main challenge in speech enhancement approaches based on the thresholding of the DWT coefficients of the noisy speech is the estimation of a threshold value that marks a difference between the DWT coefficients of noise and that of clean speech. Then, by using the threshold, designing a thresholding scheme to minimize the effect of DWT coefficients corresponding to the noise is another difficult task considering the fact that con-ventional DWT-based speech enhancement approaches exhibit a satisfactory performance only at a relatively high signal-to-noise ratio (SNR). For zero-mean, normally dis-tributed white noise, Donoho and Johnstone proposed the Universal threshold-based method for enhancing cor-rupted speech [19,20]. For noisy speech, applying a unique threshold for all the DWT coefficients irrespective of the speech and silence frames may suppress noise to some extent, but it may also remove unvoiced speech frames, thus degrading the quality of the enhanced speech. The Teager energy operator (TEO) proposed by Kaiser [27] is employed to compute a threshold value that is used to threshold the wavelet packet coefficients of the noisy
speech [18,28,29]. In particular, in the wavelet packet filtering (WPF) method [18], a time-adaptive threshold value is computed and an absolute offset parameter is used to distinguish speech frames from the noise ones. Thus, the WPF method suffers from an over-thresholding problem if the speech signal is contaminated by just slight noises. Statistical modeling is another approach of thresholding-based speech enhancement, where the threshold of wavelet packet coefficients is determined using the similarity distances between the probability dis-tributions of the signals [17].
In this paper, we develop a new speech enhancement method based on thresholding in the wavelet packet domain. Since TEO is a popular way to estimate the energy of a band-limited signal, instead of direct employment of the TEO on the noisy speech, we apply the TEO on the wavelet packet (WP) coefficients of the noisy speech (as for [18,28,29]), but we propose a statistical modeling of the Teager energy (TE)-operated WP coefficients. By exploit-ing the symmetric Kullback-Leibler (SKL) divergence, we then determine an appropriate threshold with respect to speech and silent subbands. The threshold thus obtained is finally employed in a semisoft thresholding function for obtaining an enhanced speech.
2 Proposed method
The block diagram of our proposed system is shown in Figure 1. It is seen from Figure 1 that WP transform is first applied to each input speech frame. Then, the WP coefficients are subject to Teager energy approximation with a view to determine a threshold value for performing thresholding operation in the WP domain. On threshold-ing, an enhanced speech is obtained via inverse wavelet packet (IWP) transform.
2.1 Wavelet packet analysis
A method based on the wavelet packet decomposition is a generalization of the wavelet transform-based decom-position process that offers a richer range of probabilities for the analysis of signals, namely speech. In the orthog-onal wavelet decomposition procedure, the generic step splits a speech signal into sets of approximation and detail coefficients. The set of approximation coefficients is then itself split into a second-level approximation and detail
Semisoft Thresholding
coefficients, successive details are never reanalyzed, and the process is repeated. Each level of decomposition is calculated by passing only the previous wavelet approxi-mation coefficients through discrete-time low- and high-pass quadrature mirror filters. Mallat algorithm is one of the efficient ways to construct the DWT by iterat-ing a two-channel perfect reconstruction filter bank over the low-pass scaling function branch [30]. However, this algorithm results in a logarithmic frequency resolution, which does not work well for all signals. In order to over-come the drawback as mentioned above, it is desirable to iterate the high-pass wavelet branch of the Mallat algo-rithm tree as well as the low-pass scaling function branch. Such a wavelet decomposition produced by these arbitrary subband trees is known as WP decomposition.
In the WP decomposition, both the detail and approx-imation coefficients are decomposed to create the full binary tree. For a given orthogonal wavelet function, a library of wavelet packet bases is generated. Each of these bases offers a particular way of coding signals, pre-serving global energy and reconstructing exact features. It is interesting to find an optimal decomposition with respect to a convenient criterion, computable by an effi-cient algorithm. Simple and effieffi-cient algorithms exist for both wavelet packet decomposition and optimal decom-position selection. Functions verifying an additivity-type property are well suited for efficient searching of binary tree structures and the fundamental splitting. Classi-cal entropy-based criteria match these conditions and describe information-related properties for an accurate representation of a given signal. In particular, the best basis algorithm by Coifman and Wickerhauser finds a set of bases that provide the most desirable represen-tation of the data relative to a particular cost function (e.g., entropy) [31].
In DWT decomposition, by the restriction of
Heisenberg’s uncertainty principle, the spatial resolution and spectral resolution of high-frequency band become poor, thus limiting the application of DWT. In particu-lar, there are some problems with the basic DWT-based thresholding method when it is applied to noisy speech for the purpose of enhancement. An important short-coming is the shrinkage of the unvoiced frames of speech which contain many noise-like speech components lead-ing to a degraded speech quality. On the other hand, in WP decomposition, since both the approximation and the detail coefficients are decomposed into two parts at each level of decomposition, a complete binary tree with superior frequency localization can be achieved. Thus, in the context of noisy speech enhancement, this particular feature of the WP decomposition provides better discrim-inability of speech coefficients among those of the noise and is indeed useful for enhancing speech in the presence of noise.
For aj-level WP transform, the noisy speech signaly[n] with frame lengthNis decomposed into 2jsubbands. The mth WP coefficient of thekth subband is expressed as
Wkj,m=WP[y[n] ,j] , n=1,. . .N, (1)
wherem=1,. . .,N/2jandk=1,. . ., 2j.
2.2 Teager energy approximation
The continuous form of the TEO [27] is given as
c[y(t)]=(d dty(t))
2−y(t)d2
dt2y(t), (2)
wherec[.] andy(t)represent the continuous TEO and
a continuous signal, respectively. For a given bandlim-ited discrete signal y[n], the discrete-time TEO can be approximated by
d(y[n])=y[n]2−y[n+1]y[n−1] . (3)
The discrete-time TEO is nearly instantaneous since only three samples are required for the energy compu-tation at each time instant as shown in (3). Due to this excellent time resolution, the output of a TEO provides us with the ability to capture the energy fluctuations and hence gives an estimate of the energy required to generate the signal [18,27-29,32-35].
In the context of the noisy speech enhancement by thresholding via WP analysis, the threshold must be adapted over time since speech is not always present in the signal. It is expected that the threshold should be larger during periods without speech and smaller for those with speech. Since the TEO provides an estimate of the signal energy over time, it can be employed to obtain an idea of speech/nonspeech activity and then decide an appro-priate threshold value in the speech/nonspeech frame. But directly using the TEO on noisy speech may result in much undesired artefact and enhanced noises as TEO is a fixed-sized local operator [27]. Therefore, instead of direct employment of the TEO on the noisy speech, it is found reasonable to apply the TEO on the WP coefficients of the noisy speech [18]. The application of the discrete-time TEO on theWkj,mresults in a set of TEO coefficients tjk,m. Themth TEO coefficient corresponding to thekth subband of the WP is given by
tkj,m=d[Wkj,m] , k=1, ...2j. (4)
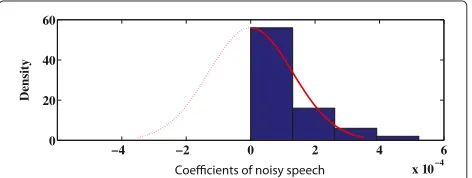
2.3 Statistical modeling of TE-operated WP coefficients This paper proposes a new thresholding function employ-ing a threshold value determined for each subband of the WP by statistically modeling the TE-operated WP coef-ficients tjk,m with a probability distribution rather than choosing a threshold value directly from thetjk,m.
In a certain range, the probability distribution of the tjk,m of the noisy speech is expected to be nearly sim-ilar to those of the noise. Also, outside that range, the probability distribution of the tjk,m of the noisy speech is expected to be similar to those of the clean speech. Thus, by considering the probability distributions of the tjk,mof the noisy speech, noise, and clean speech, a more accurate threshold value can be obtained using a suit-able scheme of pattern matching or similarity measure between the probability distributions. It is well known that the Kullback-Leibler (K-L) divergence provides a mea-sure of the distance between two distributions. It is an appealing approach to robustly estimate the differences between two distributions. Instead of comparing just the TE-operated WP coefficientstjk,m, the distribution of the tjk,m of the noisy speech can be compared with the
dis-tribution of the tjk,m of noise or that of clean speech using the K-L divergence. Since the K-L divergence is not a symmetric metric, we propose the use of the SKL divergence.
2.4 Optimal threshold calculation
This subsection presents our approach to obtain first the idea of speech/silent frame based on the SKL divergence and then to choose two different threshold values suitable for silent and speech frames. At first, the threshold value for a noisy speech frame is analytically obtained by solv-ing equations either based on the SKL divergence between the probability distribution functions (pdfs) of the tjk,m of the noisy speech and that of the noise or based on the SKL divergence between the pdfs of the tjk,m of the noisy speech and that of the clean speech. To this end, in a frame of noisy speech/ noise/ clean speech, for each subband of WP, we formulate the histogram of thetjk,m and approximate the histogram by a reasonably close pdf, namely Gaussian distribution. For this purpose, we follow the steps below:
1. The histogram of thetjk,min each subband is obtained. The number of bins in the histogram has been set equal to the square root of the number of samples divided by two.
2. Since thetjk,mof clean speech, noisy speech, and noise are positive quantity, their histograms in each subband can be approximated by the positive part of
−4 −3 −2 −1 0 1 2 3 4
x 10−4 0
20 40 60
Density
Figure 2Probability distribution of TE-operated WP coefficients of clean speech.
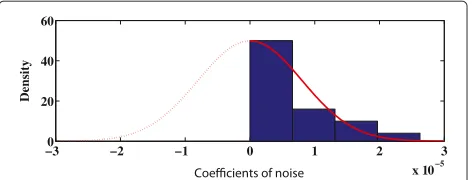
a pdf following the Gaussian distribution. Such statistical modeling of thetjk,mof clean speech, noisy speech, and noise is supported by experimental validation over all speech sentences of the NOIZEUS noisy speech corpus [36] at different SNR levels. Typical examples of such modeling are shown in Figures 2, 3, and 4, respectively.
The method in [17] does not employ the TE operation prior to computing the threshold value, and the thresh-old value for each subband of a noisy speech frame is determined by statistically modeling the WP coefficients. Since the WP coefficients are a signed quantity, their his-tograms in each subband are approximated by a two-sided Gaussian pdf. In the proposed method, due to the simpler approximation of thetjk,m of clean speech, noisy speech, or noise by the positive part of a Gaussian pdf, the pro-cess of deriving the threshold value becomes less complex which is an additional advantage over the approach in [17]. In order to analytically determine an appropriate threshold value, we proceed as follows:
The K-L divergences are always nonnegative and zero if and only if the approximate Gaussian distribution func-tions of the tjk,m of noisy speech and that of the noise, or the approximate Gaussian distribution functions of the tjk,m of the noisy speech and that of the clean speech are exactly the same. In order to have a symmetric dis-tance between any two approximate Gaussian distribution
−4 −2 0 2 4 6
x 10−4 0
20 40 60
Density
−3 −2 −1 0 1 2 3 x 10⁻⁵ 0
20 40 60
Density
Figure 4Probability distribution of TE-operated WP coefficients of noise.
functions as mentioned above, the symmetric K-L diver-gence has been adopted in this paper. The symmetric K-L divergence is defined as
SKL(p,q)= KL(p,q)+KL(q,p)
2 (5)
wherepandqare the two approximate Gaussian pdfs cal-culated from the corresponding histograms each having Mnumber of bins and KL(.)is the K-L divergence given by
KL(p,q)=
M
i=1
pi(tjk,m)ln
pi(tjk,m)
qi(tjk,m)
. (6)
In (6),pi(tkj,m)represents the approximate Gaussian pdf
of thetjk,mof the noisy speech estimated by
ˆ
pi(tjk,m)=Number of coefficients in theith bin of the histogram Total number of coefficients in each subband .
(7)
Similarly, the approximate Gaussian pdf of the tjk,m of the noise and that of thetjk,mof the clean speech can be estimated from (7) and denoted byqˆi(tjk,m)andrˆi(tjk,m),
respectively. Below a certain value λ of thetjk,m of the noisy speech, the symmetric K-L divergence between
ˆ
pi(tjk,m)andqˆi(tjk,m)is approximately zero, i.e.,
SKL(pˆi(tjk,m),qˆi(tjk,m))≈0 (8)
where the bins lie in the range [1,λ] in bothpˆi(tjk,m)and
ˆ
qi(tjk,m). Alternatively, above the value λ of the tjk,m of
the noisy speech, the symmetric K-L divergence between ˆ
pi(tjk,m)andrˆi(tjk,m)is almost zero, i.e.,
SKL(pˆi(tjk,m),rˆi(tjk,m))≈0 (9)
In (9), the bins lie in the range [λ+1, M] in bothpˆi(tjk,m)
andrˆi(tjk,m). Using (5) and (6) in evaluating (8) and (9), we
get
λ
i=1
[pˆi(tjk,m)− ˆqi(tjk,m)] ln
ˆ
pi(tjk,m)
ˆ
qi(tjk,m)
≈0. (10)
M
i=λ+1
[pˆi(tjk,m)− ˆri(tjk,m)] ln
ˆ
pi(tjk,m)
ˆ
ri(tjk,m)
≈0. (11)
From (10), it is apparent that thetjk,mof the noisy speech lying in the range [1,λ] can be marked as thetjk,mof noise and needed to be removed. Similarly, (11) attests that the tjk,m of the noisy speech residing outside [1,λ] can be
treated as similar to thetjk,mof the clean speech and con-sidered to be preserved. For obtaining a threshold valueλ in each subband, (10) and (11) can be expressed as
λ
1
[
√ ϑ √
2π σS
exp(−ϑx
2
2σS2)−
1 2π σN
exp(− x
2
2σN2)] ln((1− √
ϑ)
exp(−ϑx
2
2σS2+ x2
2σN2))dx≈0, (12)
∞ λ+1
[ √
ϑ √
2π σS
exp(−ϑx 2
2σS2)− 1 2π σS
exp(− x 2
2σS2)] ln(( √
ϑ)
exp((1−ϑ)x 2
2σS2 ))dx≈0, (13)
whereϑ=σS2/(σN2+σS2).
The range used for solving Equations (12) and (13) required for determining the threshold value λ in each subband is different from that used in [17]. The value of tjk,m for which the threshold reaches its optimum value can be determined by minimizing (12) or (13). Since (12) is a definite integral, the derivative of the function defined in the left-hand side (L.H.S) of (12) representing the SKL divergence betweenpˆi(tjk,m)andqˆi(tjk,m)is calculated and
set to zero. On the other hand, the derivative of the function obtained in the L.H.S of (13) representing the symmetric K-L distance between pˆi(tkj,m) andrˆi(tjk,m) is
calculated and set to zero. By simplifying either deriva-tives, an optimum value ofλfor each subband of a noisy speech frame can be obtained as
λ(k)=σN(k) 2(γ
k+γk2)ln(
1+ 1
γk), (14)
wherekis the subband index,σN is the variance of noise
in each subband, and γk represents the segmental SNR
defined as
γk=σS2(k)/σN2(k). (15)
version of the thresholdλ(k)in each subband of a noisy speech frame can be derived as
λ(k)=[σN(k)/√γk] 2(γ
k+γk2)ln(
1+ 1
γk). (16)
In the nonspeech/silent subbands of a frame of noisy speech, the SKL divergence between the approximate Gaussian pdfs of thetjk,m of the noisy speech and that of
the tjk,mof the noise is found to be nearly zero. An idea of speech/silent frame can thus be obtained based on the SKL divergence. Since in a silence frame only noise exists, a threshold value different from that used in a subband of a noisy speech frame should be selected for a subband of a silent frame of a noisy speech in order to remove the noise completely. Exploiting the facts above and using the thresholdλ(k)derived in (16) for each subband of a noisy speech frame, two different threshold values suitable for a subband of a silent or speech frame are proposed to be chosen as
λ(k)=
max(tjk,m), SKL(pˆi(tjk,m),qˆi(tjk,m))≈0
λ(k), otherwise.
(17)
It is noteworthy that, in the context of enhancing speech under low levels of SNR, our proposed approach to deter-mine the threshold value in a subband of a silent or speech frame is not only different but also more reason-able with simpler approximation and lesser computation in comparison to that described in [17].
2.5 Denoising by thresholding
For denoising purpose, hard thresholding sets zero to the coefficients whose absolute value is below the threshold [37-39]. This ignores the fact that there may be noise coef-ficients, which are bigger than the threshold value, thus resulting in time-frequency discontinuities of enhanced speech spectrum. Unlike the hard thresholding function, the soft thresholding function handles signals in a differ-ent way by making smooth transitions between the treated and the deleted coefficients based on the threshold value [20,37,38]. Noting the threshold determined by (17) asλ1, the soft thresholding function can be applied on themth WP coefficients of thekth subbandYkj,mas
(Yˆkj,m)S=
|Ykj,m| −λ1(k), |Ykj,m| ≥λ1(k) 0, |Ykj,m|< λ1(k).
(18)
The soft thresholding can be viewed as setting the com-ponents of the noise to zero and performing a magnitude subtraction on the speech plus noise components. It is evident that the soft thresholding eliminates the time-frequency discontinuity resulting in smoother signals, but
it yields the estimated coefficients that are the WP coef-ficients |Ykj,m|of the noisy speech shifted by an amount of λ1(k). Employment of such a shift even when |Ykj,m| stands way out of noise level creates unnecessary bias in the enhanced spectrum. The variance of the threshold val-ues over the frames of the whole noisy speech also affects the enhanced spectrum. The variance of the threshold val-ues over the frames of the whole noisy speech also affects the enhanced spectrum.
In order to overcome the problems as mentioned above, in the semisoft thresholding function, the shifting by the amount of the threshold value is avoided [39]. There-fore, a semisoft thresholding function is preferred over the soft thresholding function with respect to the vari-ance and bias of the estimated threshold value. By taking into account the advantages and shortcomings of all the thresholding functions, we apply a semisoft thresholding function on the WP coefficients of the noisy speech signal. By definingλ2(k)as
λ2(k)=
√
2λ1(k), (19)
the semisoft thresholding function is defined as
(Y˜kj,m)=
⎧ ⎪ ⎪ ⎨ ⎪ ⎪ ⎩
0, |Ykj,m| ≤λ1(k) Ykj,m, |Ykj,m|> λ2(k)
sgn(Ykj,m)[λ2(k)|Y j k,m|−λ1(k)
λ2(k)−λ1(k) ] , otherwise, (20)
whereY˜kj,m stands for the resulting semisoft thresholded WP coefficients.
2.6 Inverse wavelet packet transform
The enhanced speech frame is synthesized by perform-ing the inverse WP transformation WP−1on the resulting thresholded WP coefficientsY˜kj,m
ˆ
s[n]=WP−1(Y˜kj,m), (21) where ˆs[n] represents the enhanced speech frame. The final enhanced speech signal is reconstructed by using the standard overlap-and-add method.
3 Simulation results
In this section, a number of simulations are carried out to evaluate the performance of the proposed method.
3.1 Simulation conditions
−15 −10 −5 0 5 10 15 0 5 10 15
SNR in dB
SNR improvement
Proposed Method WPF Algorithm WTHSKL Method Universal Threshold
Figure 5Performance comparison of different methods in terms of SNR improvement in decibels for white noise-corrupted speech.
In order to obtain overlapping analysis frames, Ham-ming windowing operation is performed, where the size of each of the frame is 512 samples with 50% overlap between successive frames. A three-level WP decomposi-tion tree with db10 bases funcdecomposi-tion is applied on the noisy speech frames, and the Teager energy operation is per-formed on the resulting WP coefficients. In the proposed method, for the implementation of WP decomposition, the ‘wpdec’ function of the Matlab wavelet toolbox is used, where in order to obtain optimal decomposition, Shanon entropy criterion is employed. For the three-level WP transform, the noisy speech signaly[n] with frame length
N = 512 samples is decomposed into eight subbands.
For each subband (64 samples), a histogram is computed and variance is estimated. By computing the threshold(s), λ1(k) = λ(k)andλ2from (17) and (19), respectively, a semisoft thresholding function is developed and applied on the WP coefficients of the noisy speech using (20).
3.2 Comparison metrics
Standard objective metrics, namely overall SNR improve-ment in decibels, Perceptual Evaluation of Speech Quality
−15 −10 −5 0 5 10 15 1 1.5 2 2.5 3 3.5
SNR in dB
PESQ
Proposed Method
WPF Algorithm
WTHSKL method Universal threshold
Figure 6Performance comparison of different methods in terms of PESQ for white noise-corrupted speech.
Table 1 Performance comparison of different methods in terms of WSS for white noise-corrupted speech
SNR (dB) Universal WPF WTHSKL Proposed
threshold algorithm method method
15 37 24.52 22.34 18.87
10 44.77 37.6 34.9 26.5
5 53.9 46.2 46.08 34.3
0 66.63 59.2 60.66 43.65
−5 83.8 71.4 76.92 52.45
−10 96 87.5 89.29 65.2
−15 104.44 91.9 90.37 77.20
(PESQ), and Weighted Spectral Slope (WSS), are used for the evaluation of the proposed method [5,41,42]. In our simulation results, we have considered all 30 sentences of the NOIZEUS noisy speech corpus. We have taken into account the average result obtained from all 30 sentences for computing each of the objective metrics, namely SNR improvement in decibels, PESQ score, and WSS values. The proposed method is subjectively evaluated in terms of the spectrogram representations of the clean speech, noisy speech, and enhanced speech. Informal listening tests are also carried out, where the mean opinion scores (MOS) are evaluated in three dimensions, namely sig-nal distortion (SIG), noise distortion (BAK), and over-all quality (OVRL). The performance of our method is compared with some of the existing thresholding-based speech enhancement methods, such as Universal [20], Wavelet Packet Thresholding with Symmetric K-L Diver-gence (WTHSKL), and WPF [18] in both objective and subjective senses. In our method, while determining the threshold in (16), only time adaptation approach is incor-porated through TE operation on WP coefficients as in the WPF method in [18] (time-adaptive approach), where threshold is adapted through time only and modulated depending on the speech or silent nature of the signal under an analysis frame. Unlike the time- and space-adaptive approach in [28], threshold value is not adapted
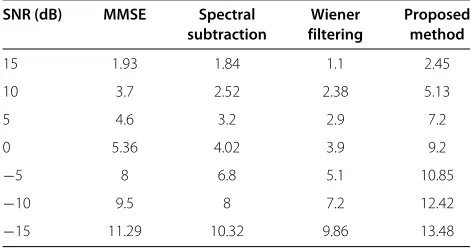
Table 2 Performance comparison in terms of SNR improvement in decidels in the presence of white noise
SNR (dB) MMSE Spectral Wiener Proposed
subtraction filtering method
15 1.93 1.84 1.1 2.45
10 3.7 2.52 2.38 5.13
5 4.6 3.2 2.9 7.2
0 5.36 4.02 3.9 9.2
−5 8 6.8 5.1 10.85
−10 9.5 8 7.2 12.42
Table 3 Performance comparison in terms of PESQ scores in the presence of white noise
SNR (dB) MMSE Spectral Wiener Proposed
subtraction filtering method
15 3.21 3.1 2.9 3.2374
10 2.89 2.51 2.33 2.9
5 2.4 2.2 2 2.733
0 2.1 1.82 1.68 2.47
−5 1.85 1.54 1.36 2.2
−10 2 1.4 1.31 2
−15 1.42 1.35 1.28 1.8
through scales in our proposed method. Therefore, we found it more justified and fair to compare our proposed method with the WPF method. Apart from these meth-ods, statistical model-based method (MMSE[9]), spectral subtractive method (spectral subtraction [6]), and Wiener filtering-type algorithm (Wiener Filtering [14]) are also included for the purpose of objective and subjective com-parison. We have implemented the Universal, WTHSKL, and WPF methods independently using the parameters specified therein. For implementation of the MMSE, spec-tral subtraction, and Weiner filtering methods, we have used publicly available Matlab codes (MMSESTSA84, WienerScalart96, and SSBoll79) from the Matlab Central website (http://www.mathworks.com/matlabcentral/).
3.3 Objective evaluation
3.3.1 Results on white noise-corrupted speech
The results for semisoft thresholding function in terms of all the objective metrics, such as SNR improvement in decibels, PESQ, and WSS, obtained using the Universal, WTHSKL, WPF, and proposed methods for white noise-corrupted speech are presented in Figures 5 and 6 and in Table 1.
Figure 5 shows the SNR improvement in decibels obtained using different methods employing semisoft thresholding function in the presence of white noise,
Table 4 Performance comparison in terms of WSS values in the presence of white noise
SNR (dB) MMSE Spectral Wiener Proposed
subtraction filtering method
15 27.5 35.01 58.1 18.87
10 41.71 43.3 66.8 26.5
5 55.4 58.1 79.8 34.3
0 63.12 61.6 98.2 43.65
−5 77.6 67.9 113.8 52.45
−10 80 74 119.5 65.2
−15 91.46 85.14 123.81 77.20
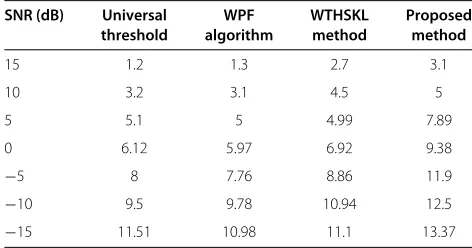
Table 5 Performance comparison of the SNR improvement in decidels for different methods in the presence of car noise
SNR (dB) Universal WPF WTHSKL Proposed
threshold algorithm method method
15 1.2 1.3 2.7 3.1
10 3.2 3.1 4.5 5
5 5.1 5 4.99 7.89
0 6.12 5.97 6.92 9.38
−5 8 7.76 8.86 11.9
−10 9.5 9.78 10.94 12.5
−15 11.51 10.98 11.1 13.37
where the SNR varies from 15 to−15 dB. It is seen from this figure that in the SNR range under consideration, the improvement in SNR in decidels is comparable for all the comparison methods, but they show comparatively lower values relative to the proposed method at all the levels of SNR.
The PESQ scores vs SNR obtained by using different methods are portrayed in Figure 6. This figure shows that the proposed method using the semisoft function is capa-ble of producing enhanced speech with better quality as it gives larger scores of PESQ for a wide range of SNR levels, whereas the PESQ scores resulting from all other meth-ods are comparable and relatively lower even at a high SNR of 15 dB. It is also seen from Figure 6 that the dif-ference in PESQ scores of the proposed method and that of the other methods increases as SNR decreases, thus indicating the effectiveness of the proposed method using semisoft thresholding function in enhancing speech even in a severely noisy environment.
The WSS values obtained by using different methods are summarized in Table 1 for varying SNR of 15 to−15 dB. For a particular method in Table 1, the WSS increases as SNR decreases. At a particular SNR, such as−15 dB, the
−15 −10 −5 0 5 10 15 0 1 2 3 4
SNR in dB
PESQ
Proposed Method WPF Algorithm WTHSKL Method Universal Threshold
−15 −10 −5 0 5 10 15 0 20 40 60 80 100
SNR in dB
WSS
Proposed Method WPF Algorithm WTHSKL Method Universal Threshold
Figure 8Performance comparison of different methods using semisoft thresholding function in terms of WSS for car noise-corrupted speech.
proposed method using semisoft function is superior in a sense that it gives the lowest WSS value, whereas the other methods produce comparatively higher values of WSS.
In order to show the effectiveness of the proposed method, we have carried out another comparison here by providing the speech enhancement results of the pro-posed method and that of the MMSE [9], spectral subtrac-tion [6], and Wiener filtering [14] methods in Tables 2, 3, and 4 for white noise-corrupted speech. It is clear from the results of these tables that the proposed method outper-forms all the speech enhancement methods as mentioned above in the sense of higher output SNR in decibels, higher PESQ, and lower WSS values at all the SNRs ranging from high to low.
3.3.2 Results on car noise-corrupted speech
Now, we present the results in terms of all the objec-tive metrics as mentioned above obtained by using the Universal, WTHSKL, WPF, and the proposed methods in Table 5 and in Figures 7 and 8 for car noise-corrupted speech.
In Table 5, the performance of the proposed method using semisoft thresholding function is compared with that of the other methods at different levels of SNR. For a method in Table 5, the SNR improvement in decibels
Table 6 Performance comparison in terms of SNR improvement in decibels in the presence of car noise
SNR (dB) MMSE Spectral Wiener Proposed
subtraction filtering method
15 1.61 2.5 2.2 3.1
10 2.74 4.1 3.74 5
5 5.63 7.5 5.4 7.89
0 6.94 8.3 6.3 9.38
−5 9.2 9.83 8.8 11.9
−10 11.74 11 12.1 12.5
−15 12.5 12.8 13.2 13.37
Table 7 Performance comparison in terms of PESQ scores in the presence of car noise
SNR (dB) MMSE Spectral Wiener Proposed
subtraction filtering method
15 3 2.99 2.7 3.06
10 2.72 2.6 2.5 2.82
5 2.6 2.49 2.24 2.68
0 2.2 2.2 1.86 2.31
−5 1.9 1.8 1.6 2.19
−10 1.6 1 1.32 2.1
−15 1.42 1.39 1.26 1.94
increases as SNR decreases. At a low SNR of −15 dB, the proposed method yields the highest SNR improve-ment in decibels. Such larger values of SNR improveimprove-ment in decibels at a low level of SNR attest the capability of the proposed method in producing enhanced speech with better quality even for car noise-corrupted speech.
In the presence of car noise, the PESQ scores at differ-ent SNR levels resulting from using the other methods are compared with respect to the proposed method employ-ing semisoft thresholdemploy-ing function in Figure 7. It can be seen from the figure that at a high level of SNR, such as 15 dB, Universal, WTHSKL, and WPF methods show lower values of PESQ scores, whereas the PESQ score is much higher, as expected, for the proposed method. The pro-posed method also yields larger PESQ scores compared to that of the other methods at lower levels of SNR. Since, at a particular SNR, a higher PESQ score indicates a better speech quality, the proposed method is indeed better in performance even in the presence of a car noise.
Figure 8 represents the WSS values as a function of SNR for the proposed method employing semisoft threshold-ing function and that for the other methods. As shown in the figure, the WSS values resulting from all other meth-ods are comparable and relatively larger for a wide range of SNR levels, whereas the proposed method is capable of
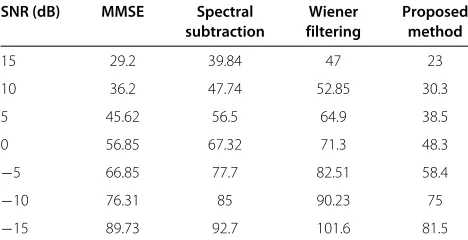
Table 8 Performance comparison in terms of WSS values in the presence of car noise
SNR (dB) MMSE Spectral Wiener Proposed
subtraction filtering method
15 29.2 39.84 47 23
10 36.2 47.74 52.85 30.3
5 45.62 56.5 64.9 38.5
0 56.85 67.32 71.3 48.3
−5 66.85 77.7 82.51 58.4
−10 76.31 85 90.23 75
−15 −10 −5 0 5 10 15 0 5 10 15
SNR in dB
SNR improvement
Proposed Method WPF Algorithom WTHSKL Method Universal Threshold
Figure 9Performance comparison of the SNR improvement in decibels for different methods in the presence of pink noise.
producing enhanced speech with better quality as it gives lower values of WSS at a low SNR of−15 dB.
For car noise-corrupted speech, the results of the objec-tive experiments comparing the proposed method with the MMSE [9], spectral subtraction [6], and Wiener filter-ing [14] methods are shown in Tables 6, 7, and 8. These results attest that even in the presence of car noise, the proposed method remains better in speech enhancement performance in terms of SNR improvement in decibels, PESQ scores, and WSS values for a wide range of SNR.
3.3.3 Results on pink noise-corrupted signal
All the objective metrics for evaluating the performance of the proposed method relative to the other methods for pink noise-corrupted speech are computed and depicted in Figures 9 and 10 and in Table 9.
The SNR improvement in decibels resulting from using different methods are summarized in Figure 9. It is vivid from this figure that the other methods produce compara-tively lower improvement in SNR in decibels in the whole SNR range, while the proposed method using semisoft thresholding function remains superior in a sense that it
−15 −10 −5 0 5 10 15 20 40 60 80 100
SNR in dB
WSS
Proposed Method WPF Algorithm WTHSKL Method Universal Threshold
Figure 10Performance comparison of different methods using semisoft thresholding function in terms of WSS values for pink noise-corrupted speech.
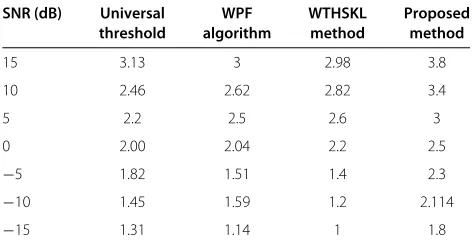
Table 9 Performance comparison of PESQ scores for different methods in the presence of pink noise
SNR (dB) Universal WPF WTHSKL Proposed
threshold algorithm method method
15 3.13 3 2.98 3.8
10 2.46 2.62 2.82 3.4
5 2.2 2.5 2.6 3
0 2.00 2.04 2.2 2.5
−5 1.82 1.51 1.4 2.3
−10 1.45 1.59 1.2 2.114
−15 1.31 1.14 1 1.8
gives the highest improvement in SNR in decibels even at an SNR as low as−15 dB of pink noise.
The PESQ scores of the proposed method and that obtained using different comparison methods are shown in Table 9 with respect to SNR levels varying from high (15 dB) to low (−15 dB). It is clear from the table that the other methods continue to provide lower PESQ scores, while the proposed method maintain compara-tively higher PESQ scores even in the presence of severe pink noise of−15 dB.
The variation of the output WSS with respect to SNR levels for different methods and that for the proposed method using semisoft thresholding function is portrayed in Figure 10. It is evident from analyzing each of these figures that, in the whole SNR range, the other meth-ods continue to produce much higher WSS values with respect to the proposed method using the semisoft thresh-olding function. Note that the proposed method performs best in a sense that it yields the lowest WSS values almost at different SNR levels.
−15 0
15 0 2 4 6 8 10 12 14
SNR in dB
SNR Improvement in dB
Proposed Method WPF Algorithm WTHSKL Method Universal Thresholding
Figure 11Performance comparison of different methods in terms of SNR improvement in decibels for babble
−15 0
15 0 0.5 1 1.5 2 2.5 3 3.5
SNR in dB
PESQ
Proposed Method WPF Algorithm WTHSKL Method Universal Thresholding
Figure 12Performance comparison of different methods in terms of PESQ scores for babble noise-corrupted speech.
3.3.4 Results on multi-talker babble noise-corrupted speech
The results obtained from the multi-talker babble noise-corrupted speech in terms of the SNR improvement in decibels, PESQ scores, and WSS values for the proposed method using semisoft thresholding function and that of the other methods are depicted in Figures 11, 12, and 13 at particular SNR levels of 15, 0, and−15 dB. It is noticeable from these figures that the performance of all the meth-ods degrades in the presence of multi-talker babble noise compared to that in the pink or car or white noise, but the proposed method retains its superiority with respect to all the levels of SNRs.
Figure 11 provides a plot for the SNR improvement in decibels obtained from all the methods for babble noise-corrupted speech. It is seen that the proposed method maintains better performance at all the SNR levels con-sidered. Also, the proposed method still remains the best, thus showing higher capability of producing enhanced speech with better quality at a very low SNR level of 0 dB or even lower than that.
In a similar babble noisy condition, the PESQ scores resulting from using the speech enhancement methods under consideration are shown in Figure 12. As seen, the proposed method continues to provide better results for low levels of SNR, such as−15 dB.
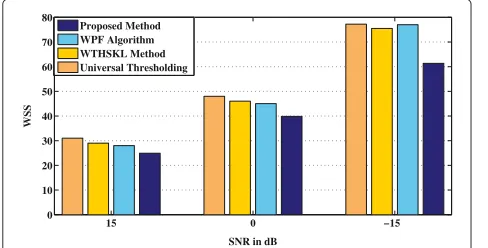
−15 0
15 0 10 20 30 40 50 60 70 80
SNR in dB
WSS
Proposed Method WPF Algorithm WTHSKL Method Universal Thresholding
Figure 13Performance comparison of different methods in terms of WSS values for babble noise-corrupted speech.
0.2 0.4 0.6 0.8 1 1.2 1.4 1.6 1.8 2 2.2
0 500 1000 1500 2000 2500 3000 3500 4000
Frequency (Hz)
0.2 0.4 0.6 0.8 1 1.2 1.4 1.6 1.8 2 2.2
0 500 1000 1500 2000 2500 3000 3500 4000
Frequency (Hz)
0.2 0.4 0.6 0.8 1 1.2 1.4 1.6 1.8 2 2.2
0 500 1000 1500 2000 2500 3000 3500 4000
Frequency (Hz)
0.2 0.4 0.6 0.8 1 1.2 1.4 1.6 1.8 2 2.2
0 500 1000 1500 2000 2500 3000 3500 4000
Frequency (Hz)
0.2 0.4 0.6 0.8 1 1.2 1.4 1.6 1.8 2 2.2
0 500 1000 1500 2000 2500 3000 3500 4000
Frequency (Hz)
0.2 0.4 0.6 0.8 1 1.2 1.4 1.6 1.8 2 2.2
0 500 1000 1500 2000 2500 3000 3500 4000
(a) Time (s)
(b)Time (s) aa
(c) Time (s)
(d) Time (s)
(e) Time (s)
(f) Time (s)
Frequency (Hz)
0.1 0.2 0.3 0.4 0.5 0.6 0.7 0.8 0.9 1 1.1 0
2000 4000 6000 8000
(a) Time (s)
Frequency (Hz)
0.5 1 1.5 2 2.5
0 500 1000 1500 2000 2500 3000 3500 4000
(b) Time (s)
Frequency (Hz)
0.5 1 1.5 2 2.5
0 500 1000 1500 2000 2500 3000 3500 4000
(c) Time (s)
Frequency (Hz)
0.5 1 1.5 2 2.5
0 500 1000 1500 2000 2500 3000 3500 4000
(d)Time (s)
Frequency (Hz)
0.5 1 1.5 2 2.5
0 500 1000 1500 2000 2500 3000 3500 4000
(e) Time (s)
Frequency (Hz)
0.1 0.2 0.3 0.4 0.5 0.6 0.7 0.8 0.9 1 1.1
0 1000 2000 3000 4000 5000 6000 7000 8000 9000
(f) Time (s)
Frequency (Hz)
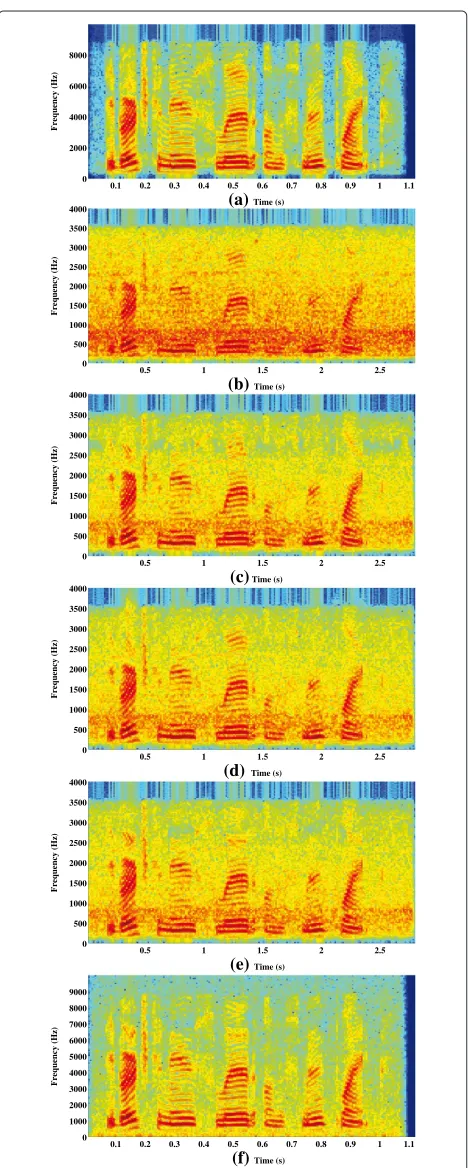
Figure 15Spectrogram of sp01.wav utterance by a male speaker from the NOIZEUS database.(a)Clean speech,(b)noisy speech (car noise from NOIZEUS database of−5-dB SNR),(c, d, e, f) enhanced speech signals obtained using the Universal, WPF, WTHSKL, and the proposed methods, respectively.
Table 10 Mean scores of SIG scale for different methods in the presence of car noise at a 5-dB SNR
Listener Spectral Wiener MMSE Proposed
subtraction filtering method
1 3.7 3.1 4.3 4.8
2 3 2 4 3.5
3 3.5 3 3.5 5
4 1.5 1.5 3.5 5
5 3 2.5 4 5
Performance comparison of the mean scores of SIG scale evaluated for different methods in the presence of car noise at a SNR of 5 dB.
Also, the WSS values obtained from all the methods as a function of SNR are plotted in Figure 13 for babble noise-corrupted speech. This figure illustrates that, as expected, the WSS values of the proposed method are somewhat increased in comparison to the other noisy cases, but its performance still remains better than that provided by the other methods for a wide range of SNR values from 15 to−15 dB.
We have tested our proposed method in a wide range of SNRs and reported the results in the SNR range of 15 to−15 dB, where a significant difference in performance is noticed for the proposed method relative to the other methods in comparison. Our main focus was to show the capability of the proposed method at very low SNR lev-els, such as−15 dB, where the other comparison methods produce less accurate results but the proposed method successfully enhances speech with higher accuracy. On the other hand, in the case of very high SNR, such as that above 15 dB, although the proposed method consis-tently demonstrates better performance, the performance becomes competitive with respect to the other methods in comparison. Therefore, the range of SNR used to present the comparative performance analysis is chosen from 15 to−15 dB.
3.4 Subjective evaluation
In order to evaluate the subjective observation of the enhanced speech obtained by using the proposed method,
Table 11 Mean scores of BAK scale for different methods in the presence of car noise at a 5-dB SNR
Listener Spectral Wiener MMSE Proposed
subtraction filtering method
1 2.4 3.8 2.9 4.3
2 1.5 3 1 1.5
3 3 3 3 4
4 1.5 2.5 3 4
5 4 4 4.5 4
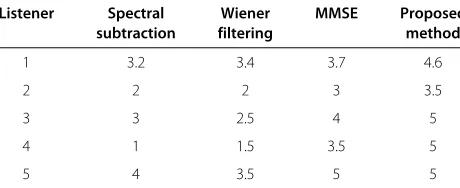
Table 12 Mean scores of OVRL scale for different methods in the presence of car noise at a 5-dB SNR
Listener Spectral Wiener MMSE Proposed
subtraction filtering method
1 3.2 3.4 3.7 4.6
2 2 2 3 3.5
3 3 2.5 4 5
4 1 1.5 3.5 5
5 4 3.5 5 5
Performance comparison of the mean scores of OVRL scale evaluated for different methods in the presence of car noise at a SNR of 5 dB.
spectrograms of the clean speech, noisy speech, and enhanced speech signals obtained using the Universal [20], WTHSKL [17], WPF [18], and proposed methods are presented in Figure 14 for white noise-corrupted speech at an SNR of 5 dB and in Figure 15 for car noise-corrupted speech at an SNR of −5 dB for clean speech (a), noisy speech (b), enhanced speech signals obtained using the Universal, WPF, WTHSKL, and the proposed methods, respectively (c, d, e, f ). It is evident from these figures that the harmonics are preserved and the amount of distor-tion is greatly reduced in the proposed method no matter how corrupted the speech is by white or car noise and regardless of its level. Thus, the spectrogram observa-tions with lower distortion also validate our claim of better speech quality as obtained in our objective evaluations in terms of higher SNR improvement in decibels, higher PESQ score, and lower WSS in comparison with the other methods.
Informal listening tests are also conducted, where the listeners were allowed and arranged to perceptually eval-uate the enhanced speech signals. In order to reduce the length and cost of the subjective evaluations, only a sub-set of the NOIZEUS corpus was processed by MMSE [9], spectral subtraction [6], Wiener filtering [14], and the pro-posed methods for subjective evaluation. A total of ten sentences spoken by two male and two female speakers and corrupted in two background noises (car and babble)
Table 13 Mean scores of SIG scale for different methods in the presence of babble noise at a 10-dB SNR
Listener Spectral Wiener MMSE Proposed
subtraction filtering method
1 4.1 3.1 4.2 4.5
2 3.9 3.9 4.4 5
3 4.2 4.1 4.7 4.8
4 4.1 3.7 4 4.4
5 4.2 3.9 4.3 5
Performance comparison of the mean scores of SIG scale evaluated for different methods in the presence of babble noise at a SNR of 10 dB.
Table 14 Mean scores of BAK scale for different methods in the presence of babble noise at a 10-dB SNR
Listener Spectral Wiener MMSE Proposed
subtraction filtering method
1 3.5 3.3 3.8 4.0
2 2.6 2.5 3.3 3.9
3 3 2.8 3.5 3.8
4 3 2.9 3.6 3.7
5 3.2 3.2 3.6 3.9
Performance comparison of the mean scores of BAK scale evaluated for different methods in the presence of babble noise at a SNR of 10 dB.
at SNR levels of 5 and 10 dB were processed and presented to five listeners for evaluation.
Subjective tests were performed according to ITU-T recommendation P.835 [36,43]. The P.835 methodology is designed to reduce the listener’s uncertainty in a subjec-tive test about the basis of their ratings on overall quality of a noisy speech signal. In this test, a listener is instructed to successively attend and rate the enhanced speech signal based on (a) the speech signal alone using a scale of SIG (1 = very unnatural, 5 = very natural), (b) the background noise alone using a scale of background conspicuous/ intrusiveness (BAK) (1 = very conspicuous, very intru-sive; 5 = not noticeable), and (c) the overall effect using the scale of the mean opinion score (OVRL) (1 = bad, 5 = excellent). More details about the testing methodology can be found in [36].
The mean scores of SIG, BAK, and OVRL scales for the four speech enhancement methods evaluated in the presence of car noise at an SNR of 5 dB are shown in Tables 10, 11, and 12 . For the four methods examined using babble noise-corrupted speech at an SNR of 10 dB, the mean scores of SIG, BAK, and OVRL scales are summarized in Tables 13, 14, and 15. The mean scores in the presence of both car and babble noises demonstrate that the lower signal distortion (i.e., higher SIG scores) and the lower noise distortion (i.e., higher BAK scores) are obtained with the proposed method relative to that
Table 15 Mean scores of OVRL scale for different methods in the presence of babble noise at a 10-dB SNR
Listener Spectral Wiener MMSE Proposed
subtraction filtering method
1 3.6 3.9 4.3 4.8
2 4.5 3.8 4.1 4.9
3 3 3.5 4.2 4.6
4 3.2 4.2 4 4.7
5 4.0 3.8 4.1 5
obtained by MMSE [9], spectral subtraction [6], and Wiener filtering [14] methods in most of the conditions. It is also shown that a consistently better performance in OVRL scale is offered by the proposed method not only in car but also in babble noisy conditions at both SNR levels of considered in comparison to that provided by all the methods mentioned above. Overall, it is found that the proposed method possesses the highest subjective sound quality in comparison to that of the other methods in case of different noises at various levels of SNR. The performance of the proposed system can be validated following the web link https://sites.google.com/site/ celiatahsinaresearchwork/research/important-research-links that includes the noisy and enhanced files.
4 Conclusions
An improved WP-based approach to solve the problems of speech enhancement has been presented in this paper. We develop a statistical model-based technique, where TE-operated WP coefficients are employed to obtain a suitable threshold based on the SKL divergence. To solve the equations required for threshold determina-tion, the TE-operated WP coefficients of noisy speech, clean speech, or noise is well approximated by the pos-itive part of a Gaussian distribution. Instead of using a unique threshold for all frames, the threshold value here is adapted with respect to speech and silence frames based on the SKL divergence. Then, by employing a semisoft thresholding function, the WP coefficients of the noisy speech are thresholded in order to obtain a cleaner speech. Standard objective and subjective evaluations on the simulation results show that the proposed method is capable of consistently yielding enhanced speech with bet-ter quality and intelligibility compared to that obtained from the existing thresholding-based methods. However, there are some scopes for possible future research. In the proposed speech enhancement method, we have formu-lated the histogram of the Teager energy-operated WP coefficients and approximated the histogram by a reason-ably close probability distribution function, namely Gaus-sian distribution. But other types of distributions, such as logistic, T-scale, extreme value, and generalized extreme value can also be explored to approximate the histograms of the WP coefficients. Moreover, in our method, both the threshold determination and the thresholding opera-tion are performed in the WP domain. Same operaopera-tions can be employed in perceptual wavelet packet domain, where the use of a perceptually weighted filter would be able to mask the residual noise, making it audibly imperceptible.
Competing interests
The authors declare that they have no competing interests.
Acknowledgements
The authors would like to express their sincere gratitude towards the authorities of the Department of Electrical and Electronics Engineering and Bangladesh University of Engineering and Technology (BUET) for providing constant support throughout this research work.
Received: 4 October 2011 Accepted: 7 October 2013 Published: 19 November 2013
References
1. D O’Shaughnessy,Speech Enhancement: Theory and Practice(IEEE Press, New York, 2000)
2. F Jabloun, B Champagne, Incorporating the human hearing properties in the signal subspace approach for speech enhancement. IEEE Trans. Speech Audio Process.11, 700–708 (2003)
3. H Gustafsson, S Nordholm, I Claesson, Spectral subtraction using reduced delay convolution and adaptive averaging. IEEE Trans. Speech Audio Process.9(8), 799–807 (2001)
4. S Kamath, P Loizou, A multi-band spectral subtraction method for enhancing speech corrupted by colored noise, inProceedings of the IEEE International Conference on Acoustics, Speech, and Signal Processing (ICASSP),vol.4 (IEEE, Piscataway, 2002), pp. IV–4164
5. K Yamashita, T Shimamura, Nonstationary noise estimation using low-frequency regions for spectral subtraction. IEEE Signal Process. Lett.
12, 465–468 (2005)
6. S Boll, Suppression of acoustic noise in speech using spectral subtraction. IEEE Trans. Acoustics Speech Signal Process.27(2), 113–120 (1979) 7. B Chen, PC Loizou, A Laplacian-based MMSE estimator for speech
enhancement. Speech Commun.49, 134–143 (2007)
8. P Loizou, Speech enhancement based on perceptually motivated Bayesian estimators of the magnitude spectrum. IEEE Trans. Speech Audio Process.13(5), 857–869 (2005)
9. Y Ephraim, D Malah, Speech enhancement using a minimum
mean-square error log-spectral amplitude estimator. IEEE Trans. Acoustics Speech Signal Process.33(2), 443–445 (1985)
10. H Sameti, H Sheikhzadeh, L Deng, R Brennan, HMM-based strategies for enhancement of speech signals embedded in nonstationary noise. IEEE Trans. Speech Audio Process.6(5), 445–455 (1998)
11. J Hansen, V Radhakrishnan, K Arehart, Speech enhancement based on generalized minimum mean square error estimators and masking properties of the auditory system. IEEE Trans. Audio Speech Lang. Process.
14(6), 2049–2063 (2006)
12. I Almajai, B Milner, Visually derived wiener filters for speech enhancement. IEEE Trans. Audio Speech Lang. Process.19(6), 1642–1651 (2011) 13. S Ben Jebara, A perceptual approach to reduce musical noise
phenomenon with Wiener denoising technique, inIEEE International Conference on Acoustics, Speech and Signal Processing, (ICASSP),vol.3 (IEEE, Piscataway, 2006), p. III
14. A Papoulis, SU Pillai,Probability, Random Variables and Stochastic Processes (McGraw-Hill, New York, 2002)
15. S Chang, Y Kwon, Si Yang, Ij Kim, Speech enhancement for non-stationary noise environment by adaptive wavelet packet, inProceedings of the IEEE International Conference on Acoustics, Speech, and Signal Processing (ICASSP),vol.1 (IEEE, Piscataway, 2002), pp. I-561–I-564
16. Y Hu, P Loizou, Speech enhancement based on wavelet thresholding the multitaper spectrum. IEEE Trans. Speech Audio Process.12, 59–67 (2004) 17. S Tabibian, A Akbari, B Nasersharif, A new wavelet thresholding method
for speech enhancement based on symmetric Kullback-Leibler divergence, inProceedings of the 14th International CSI Computer
Conference, (CSICC)(IEEE, Piscataway, 2009), pp. 495–500
18. M Bahoura, J Rouat, Wavelet speech enhancement based on the Teager energy operator. IEEE Signal Process. Lett.8, 10–12 (2001)
19. DL Donoho, IM Johnstone, Ideal spatial adaptation by wavelet shrinkage. Biometrika.81, 425–455 (1994)
20. D Donoho, De-noising by soft-thresholding. IEEE Trans. Inf. Theory.
41, 613–627 (1995)
22. H Sheikhzadeh, HR Abutalebi, An improved wavelet-based speech enhancement system, inEUROSPEECH(ICSA, France, 2001), pp. 1855–1858 23. Q Fu, E Wan, Perceptual Wavelet Adaptive Denoising of Speech, in
EUROSPEECH(ICSA, France, 2003), pp. 1937–1940
24. SH Chen, JF Wang, Speech enhancement using perceptual wavelet packet decomposition and Teager energy operator. J. VLSI Signal Process. Syst.36(2/3), 125–139 (2004)
25. Y Shao, CH Chang, A generalized time-frequency subtraction method for robust speech enhancement based on wavelet filter banks modeling of human auditory system. IEEE Trans. Syst. Man Cybern.
37(4), 877–889 (2007)
26. MT Johnson, X Yuan, Y Ren, Speech signal enhancement through adaptive wavelet thresholding. Speech Commun.49, 123–133 (2007) 27. J Kaiser, Some useful properties of Teager’s energy operators, inIEEE
International Conference on Speech, and Signal Processing, (ICASSP),vol.3
(IEEE, Piscataway, 1993), pp. 149–152
28. M Bahoura, J Rouat, A new approach for wavelet speech enhancement, in
EUROSPEECH(ICSA, France, 2001), pp. 1937–1940
29. M Bahoura, J Rouat, Wavelet speech enhancement based on time-scale adaptation. Speech Commun.48(12), 1620–1637 (2006)
30. S Mallat, WL Hwang, Singularity detection and processing with wavelets. IEEE Trans. Inf. Theory.38(2), 617–643 (1992)
31. R Coifman, M Wickerhauser, Entropy-based algorithms for best basis selection. IEEE Trans. Inf. Theory.38(2), 713–718 (1992)
32. A Dimitriadis, P Maragos, A comparison of the squared energy and Teager-Kaiser operators for short-term energy estimation in additive noise. IEEE Trans. Signal Process.57(7), 2569–2581 (2009)
33. J Kaiser, International Conference on Acoustics, Speech, and Signal Processing, (ICASSP), vol.1 (IEEE, Piscataway, 1990), pp. 381–384 34. P Maragos, T Quatieri, J Kaiser, Speech nonlinearities, modulations, and
energy operators, inInternational Conference on Acoustics, Speech, and Signal Processing, (ICASSP),vol.1 (IEEE, Piscataway, 1991), pp. 421–424 35. J Rouat,Nonlinear operators for speech analysis, in Visual representations of
speech signals(Wiley, New York, 1992), pp. 335–340
36. Y Hu, PC Loizou, Subjective comparison and evaluation of speech enhancement algorithms. Speech Commun.49(7-8), 588–601 (2007) 37. WH Abdulla, HMM-based techniques for speech segments extraction. Sci.
Program.10(3), 221–239 (2002)
38. M Bahoura, J Rouat, Wavelet noise reduction: application to speech enhancement. J. Can. Acoustical Assoc.28(3), 158–159 (2000)
39. S Ayat, M Manzuri, R Dianat, Wavelet based speech enhancement using a new thresholding algorithm, inProceedings of the International Symposium on Intelligent Multimedia, Video and Speech Processing (IEEE, Piscataway, 2004), pp. 238–241
40. A Varga, HJM Steeneken, Assessment for automatic speech recognition: II. NOISEX-92: a database and an experiment to study the effect of additive noise on speech recognition systems. Speech Commun.12, 247–251 (1993)
41. Y Lu, PC Loizou, Estimators of the magnitude-squared spectrum and methods for incorporating SNR uncertainty. IEEE Trans. Audio Speech Lang. Process.19(5), 1123–1137 (2011)
42. ITU, P56 IT: objective measurement of active speech level. ITU-T Recommendation (ITU, Geneva, 1993), p. 56
43. ITU, P835 IT: subjective test methodology for evaluating speech communication systems that include noise suppression algorithms. ITU-T Recommendation (ITU, Geneva, 2003), p. 835
doi:10.1186/1687-4722-2013-25
Cite this article as:Sanam and Shahnaz:A semisoft thresholding method
based on Teager energy operation on wavelet packet coefficients
for enhancing noisy speech.EURASIP Journal on Audio, Speech, and Music
Processing20132013:25.
Submit your manuscript to a
journal and benefi t from:
7Convenient online submission
7Rigorous peer review
7Immediate publication on acceptance
7Open access: articles freely available online
7High visibility within the fi eld
7Retaining the copyright to your article