OPEN A
CCE
SS
JZ
AR R
esearch article
OPEN A
CCE
SS
Research article
Effect of diet type on serum and faecal concentration of
S100/calgranulins in the captive cheetah
Sarah Depauw1, Romy M. Heilmann2, Katherine Whitehouse-Tedd3, Myriam Hesta1, Jörg M. Steiner2, Jan S. Suchodolski2 and Geert P.J. Janssens1
1Laboratory of Animal Nutrition, Faculty of Veterinary Medicine, Ghent University, Heidestraat 19, B-9820 Merelbeke, Belgium
2Gastrointestinal Laboratory, Department of Small Animal Clinical Sciences, College of Veterinary Medicine and Biomedical Sciences, Texas A&M University, College Station, TX 77843-4474, USA
3Cheetah Outreach, 209-211 Victoria Junction, Prestwich Street, Cape Town, Western Cape, South Africa Correspondence: Sarah Depauw; e-mail: [email protected]
Keywords:
Acinonyx jubatus, calprotectin, diet type, intestinal inflammation, S100A12
Article history:
Received: 30 October 2012 Accepted: 1 March 2014 Published online: 30 April 2014
Abstract
Gastrointestinal disease is omnipresent in captive cheetahs (Acinonyx jubatus), in contrast to its free-ranging populations. The current study aimed to evaluate the effect of diet type (meat-only whole prey) on gastrointestinal health in captive cheetahs by measuring faecal and serum concentrations of S100/calgranulins. This paper reports faecal S100A12 and calprotectin concentrations in 12 captive cheetahs fed supplemented beef versus whole rabbit for one month in a cross-over design. Also, serum S100A12 and calprotectin concentrations were determined in four cheetahs fed whole rabbit and six cheetahs fed supplemented beef, and these were compared to the faecal concentrations of the respective marker proteins. Both the immunoassay for canine calprotectin and canine S100A12 were precise and reproducible for use with serum samples and faecal extracts. Whereas the assay for S100A12 was linear and accurate, an inconsistent linearity of the canine calprotectin assay was observed and could be indicative of an insufficient cross-reactivity of the specific antibody used for this assay. Serum concentrations of S100A12 and calprotectin were not altered by diet type, and were not correlated with the respective concentrations in faeces. Numerically (P=0.241) greater calprotectin concentrations and greater (P=0.041) faecal S100A12 concentrations were detected in cheetahs fed supplemented beef compared with whole rabbit. These findings demonstrate that whole prey feeding may decrease intestinal inflammation in the captive cheetah. Consequently, the relation between diet type and intestinal inflammatory conditions in the captive cheetah warrants further investigation.
Introduction
The prevalence of gastrointestinal disease is high in the
captive cheetah (Acinonyx jubatus) compared to the wild
population (Munson 1993; Munson et al. 1999, 2005; Kotsch et al. 2002). The type of diet offered to captive cheetahs has been implicated as a potential factor in gastro-intestinal disease in this species (Whitehouse-Tedd 2012). Recently, we demonstrated that the type of a strict carnivorous diet modulates microbial fermentation processes in the cheetah (Depauw et al. 2011). Cheetahs fed a supplemented beef diet were observed to have significantly higher concentrations of faecal putrefactive compounds, accompanied by looser stool
and a higher incidence of diarrhoea as compared to the same
cheetahs fed whole rabbit. In contrast, faecal concentrations of total short-chain fatty acids (SCFA) were unaltered by diet type (Depauw et al. 2011). These differences in fermentation were attributed to the relatively high intake of animal fibre (bone, fur, connective tissue), in combination with a reduced protein intake, of whole prey compared with meat-only diets (Depauw et al. 2011).
health in the captive cheetah. However, there is a dearth of data on the functionality of fermentation products in felids (Rondeau et al. 2003) and many other mammals, with current research typically restricted to studies in rats, humans or in vitro. Therefore, the relevance of changes in fermentation pattern to gastrointestinal health of cheetahs is still unknown.
In exotic felids, faecal consistency is often used to assess intestinal health. However, scientific evidence of an association between faecal consistency measurements and gastrointestinal disease is still lacking, and the sensitivity of faecal scoring as a marker for gastrointestinal health is questionable.
The proteins calprotectin (S100A8/S100A9) and S100A12 are secreted by activated granulocytes and monocytes during times of acute intestinal inflammation, and calprotectin can also be produced in epithelial cells at sites of inflammation (Johne et al. 1997; Roth et al. 2003; Foell et al. 2009). Both faecal proteins have been successfully used as markers of gastrointestinal inflammation in humans (Fagerhol 2000; Konikoff et al. 2006; Foell et al. 2009) and their validity is currently being evaluated in dogs (Grellet et al. 2011; Heilmann et al. 2012a; Otoni et al. 2012). The current study was therefore designed to evaluate faecal as well as serum calprotectin and S100A12 as potential biomarkers of gastrointestinal health in captive cheetahs fed either a whole prey or a meat-only diet.
Methods
Experimental design
This experiment was part of a study on the effect of diet type on microbial fermentation in the captive cheetah. As such, the detailed methodology and diet composition has previously been reported (Depauw et al. 2011). In brief, a cross-over study including 12 clinically healthy cheetahs (4 male, 10 female, 3.0 ± 1.6 years old) housed at Ree Park Ebeltoft Safari (Ebeltoft, Denmark) was conducted and faecal samples were collected from cheetahs consuming two alternative diets. The test diets consisted of either unsupplemented whole rabbit (2.5–3 kg diet/animal daily, Kiezebrink Putten B.V., Hoge Eng Oost, the Netherlands) without additional supplementation, or beef (1.2–1.6 kg diet/animal daily, Kiezebrink Putten B.V., Hoge Eng Oost, The Netherlands) supplemented with a vitamin and mineral premix (10 g/kg meat (as fed), Carnizoo®, Twilmij B.V., Stroe, The Netherlands).
Before the onset of the trial, all cheetahs were fed mainly on supplemented beef. A three-week adaptation period was used prior to collection of faeces during the fourth week of each testing period. One fresh faecal sample was collected for each individual within 15 min of voiding and was immediately frozen and stored at -20°C. During the trial, 10 cheetahs were anaesthetised as part of the zoo’s routine veterinary plan, and a subsample of serum was
Table 1. Results of the analytical validation of the canine calprotectin and S100A12 assays for use with serum and faecal extracts from cheetahs.
Dilutional parallelism Spiking recovery (canine protein)
Calprotectin S100A12 Calprotectin S100A12
Sample
number (μg/L or ng/g) O/E (%) ± SDMean (μg/L or ng/g)Mean O/E (%) ± SD (μg/L or ng/g)Mean O/E (%) ± SD (μg/L or ng/g)Mean O/E (%) ± SD
S1 2918 120.5 ± 15.8 65 123.1 ± 6.4 1613 133.3 ± 32.3 46 88.9 ± 5.5
S2 1536 113.6 ± 7.8 93 103.9 ± 16.3 2154 114.9 ± 15.9 73 96.7 ± 9.0
S3 2023 101.6 ± 6.2 115 108.5 ± 16.5 3190 112.0 ± 14.3 126 90.4 ± 3.5
S4 2953 114.8 ± 20.5 184 104.2 ± 21.2 2103 113.3 ± 14.8 199 92.9 ± 3.8
F1 5197 103.6 ± 7.5 155 118.1 ± 5.7 2949 178.9 ± 73.5 505 94.7 ± 4.1
F2 5881 114.2 ± 9.8 146 104.6 ± 4.6 6498 130.2 ± 35.3 166 88.8 ± 3.2
F3 5009 115.2 ± 13.9 826 111.6 ± 1.8 5572 150.7 ± 42.7 825 94.6 ± 4.8
F4 2256 104.3 ± 16.8 181 108.2 ± 1.0 12260 116.3 ± 20.7 1589 95.4 ± 5.6
O/E(%) = percentage recovery calculated as [(observed concentration × 100)/expected concentration]; SD = standard deviation.
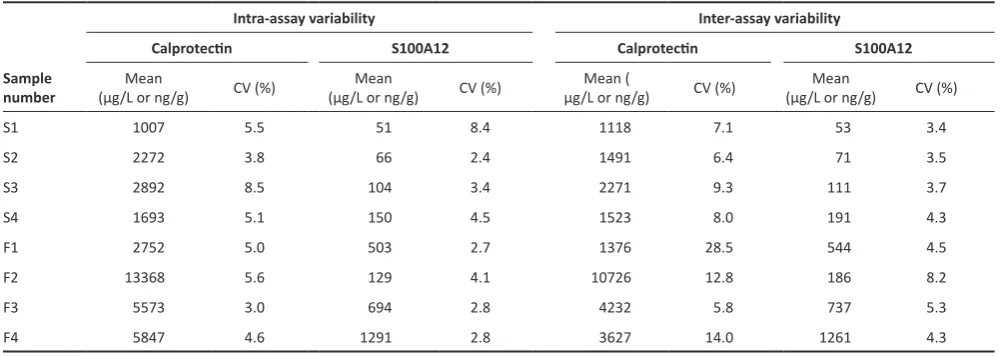
Intra-assay variability Inter-assay variability
Calprotectin S100A12 Calprotectin S100A12
Sample
number (μg/L or ng/g)Mean CV (%) (μg/L or ng/g)Mean CV (%) μg/L or ng/g)Mean ( CV (%) (μg/L or ng/g)Mean CV (%)
S1 1007 5.5 51 8.4 1118 7.1 53 3.4
S2 2272 3.8 66 2.4 1491 6.4 71 3.5
S3 2892 8.5 104 3.4 2271 9.3 111 3.7
S4 1693 5.1 150 4.5 1523 8.0 191 4.3
F1 2752 5.0 503 2.7 1376 28.5 544 4.5
F2 13368 5.6 129 4.1 10726 12.8 186 8.2
F3 5573 3.0 694 2.8 4232 5.8 737 5.3
F4 5847 4.6 1291 2.8 3627 14.0 1261 4.3
donated to this study. As a result, serum was collected from four cheetahs fed whole rabbit and six cheetahs fed supplemented beef. The samples were centrifuged and serum was immediately frozen and stored at -20°C until analysis.
Faecal/serum calprotectin and S100A12 analyses
Faecal samples were thawed and 1 g was diluted 1:5 in faecal
extraction buffer (20 mM CH3CO2 and 3 mM CaCl2 [pH 7,6]) containing
an EDTA-free proteinase inhibitor cocktail (1 tablet/25mL, Roche Diagnostics GmbH, Mannheim, Germany). The samples were then vigorously shaken (30 min, 23°C) and centrifuged (20 min, 5°C, 2100 x g). Finally, the supernatant was collected by use of a serum filter (Fisherbrand serum filter system [IB model], Fisher Scientific Inc., Pittsburgh, USA) and again centrifuged (30 min, 23°C, 10,600 x g). Calprotectin and S100A12 concentrations in faecal extracts and serum were measured by in-house ELISAs according to Heilmann et al. (2011b; 2012a). The assays were analytically validated for the quantification of both markers in serum and faecal samples from cheetahs by determination of dilutional parallelism, spiking recovery, and intra- and inter-assay variability using four different sera and four faecal extracts from cheetahs for each. Dilutional parallelism was determined by evaluating sera and faecal extracts at a serial 2-fold dilution from 1:50–1:400 and
1:100–1:800, respectively. The remaining validation parameters were determined with serum samples diluted 1:100 and a final dilution of 1:500 for faecal extracts. Spiking recovery was determined by adding purified canine calprotectin (0, 0.5, 1, 2, 5, 10 and 25 ng/mL) or canine S100A12 (0, 0.05, 0.1, 0.2, 0.5, 1.0 and 2.5 ng/mL) to each of the samples and calculating the percentage of antigen recovery. Further, five different serum samples and five different fecal extracts were spiked with each other. Calprotectin and S100A12 were measured in each of the spiked and unspiked samples and the percentage of recovery was calculated. Intra-assay variability was evaluated by Intra-assaying each sample 10 times within the same assay and calculating the intra-assay coefficients of variation (%CV) for each sample. Inter-assay variability of the assay was determined by analysing each sample in 10 consecutive assay runs and calculating inter-assay %CVs.
Data analysis
Data were analysed using IBM SPSS version 20 (IBM SPSS Statistics, IBM Inc, Armonk, NY, USA). Following distribution analysis (using
a Shapiro-Wilk test), median values (lower quartile Q1, upper
quartile Q3) were reported for the nonparametric data.
Spearman correlation coefficients were used to evaluate the associations among faecal as well as serum calprotectin and S100A12 concentrations. Further, concentrations of both calprotectin and S100A12 in faeces and in serum were compared within individual animals using a Spearman’s test.
A Wilcoxon signed rank test was performed to evaluate the effects of test diet on faecal calprotectin and S100A12 concentrations. Differences in serum concentrations of calprotectin and S100A12 between diets were evaluated using a Mann-Whitney U Test.
Statistical significance was set at P ≤ 0.05.
Results
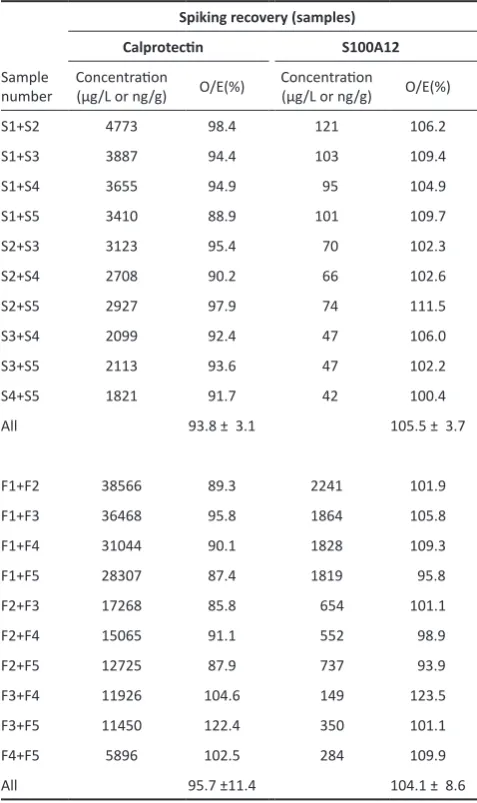
Both the assay for canine calprotectin and for canine S100A12 detected the respective analytes in serum and faecal samples collected from cheetahs. The dilutional parallelism, spiking recovery, intra-assay and inter-assay variability are summarised in Tables 1 and 2. Of note, faecal calprotectin concentrations did not consistently parallel the standard curve of the calprotectin assay in some of the samples from cheetahs, especially for samples with a high concentration of calprotectin. Likewise, an over-recovery was detected in faecal samples from cheetahs spiked with canine calprotectin, especially samples with a low concentration of calprotectin.
Faecal calprotectin and S100A12 were positively correlated
(r = 0.918, P<0.001). Likewise, serum calprotectin and S100A12
correlated positively (r = 0.967, P<0.001). However, faecal
Table 2. Recovery of calprotectin and S100A12 in serum samples and faecal extracts from cheetahs, spiked among each other.
Spiking recovery (samples)
Calprotectin S100A12
Sample number
Concentration
(μg/L or ng/g) O/E(%)
Concentration
(μg/L or ng/g) O/E(%)
S1+S2 4773 98.4 121 106.2
S1+S3 3887 94.4 103 109.4
S1+S4 3655 94.9 95 104.9
S1+S5 3410 88.9 101 109.7
S2+S3 3123 95.4 70 102.3
S2+S4 2708 90.2 66 102.6
S2+S5 2927 97.9 74 111.5
S3+S4 2099 92.4 47 106.0
S3+S5 2113 93.6 47 102.2
S4+S5 1821 91.7 42 100.4
All 93.8 ± 3.1 105.5 ± 3.7
F1+F2 38566 89.3 2241 101.9
F1+F3 36468 95.8 1864 105.8
F1+F4 31044 90.1 1828 109.3
F1+F5 28307 87.4 1819 95.8
F2+F3 17268 85.8 654 101.1
F2+F4 15065 91.1 552 98.9
F2+F5 12725 87.9 737 93.9
F3+F4 11926 104.6 149 123.5
F3+F5 11450 122.4 350 101.1
F4+F5 5896 102.5 284 109.9
All 95.7 ±11.4 104.1 ± 8.6
O/E (%) = percentage recovery calculated as [(observed concentration × 100) /expected concentration]
Table 3.Calprotectin and S100A12 concentrations in faeces and serum from cheetahs fed whole rabbit or supplemented beef for a period of 1 month. Values presented as median (Q1, Q3); Q1 = lower quartile, Q3 = upper quartile.
Whole rabbit Supplemented beef P
n 12 12
Faecal calprotectin
(μg/g) 1.3 (0.04, 7.8) 8.8 (2.8, 24.4) 0.241
Faecal S100A12 (ηg/g) 301 (223, 1185) 1671 (494, 4415) 0.041
n 4 6
Serum calprotectin
(μg/L) 2755 (1798, 4093) 2104 (1580, 2184) 0.257
concentrations of both calprotectin and S100A12 did not correlate with the concentrations of these proteins in serum.
Concentrations of calprotectin and S100A12 in faeces and serum collected from captive cheetahs are presented in Table 3. The marked numerical increase in faecal calprotectin concentration in cheetahs when fed supplemented beef failed to reach the level of significance. Cheetahs fed whole rabbit exhibited significantly
lower faecal S100A12 concentrations (median: 301 ng/g, Q1 223,
Q3 1185) compared to the same cheetahs fed supplemented beef
(median: 1671 ng/g, Q1 494, Q3 4415, P=0.041). The individual
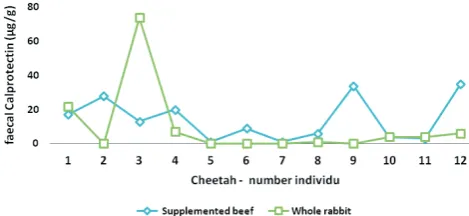
changes of faecal calprotectin and S100A12 are presented in Figure 1, respectively Figure 2.
No significant differences were detected between the diet groups in serum calprotectin or S100A12.
Discussion
The pro-inflammatory proteins calprotectin (S100A8/S100A9) and S100A12 have been extensively studied for their use as faecal biomarkers in inflammatory bowel disease (IBD) in humans (Røseth et al. 1992; Costa et al., 2003; Foell et al., 2009). Given their value as sensitive markers for clinical as well as subclinical intestinal inflammation (Foell et al. 2003; D’Inca et al. 2008), the utility of calprotectin and S100A12 in the diagnosis and/or monitoring of canine IBD is currently under investigation (Grellet et al. 2011; Heilmann et al. 2012a,b; Otoni et al. 2012). However, faecal calprotectin and S100A12 are non-specific markers of intestinal inflammation, and as such, these markers in isolation may not differentiate IBD from other intestinal inflammatory conditions (Summerton et al. 2002).
Both the immunoassay for canine calprotectin and canine S100A12 were precise and reproducible for use with serum samples and faecal extracts from cheetahs, and the assay for S100A12 was also linear and accurate for serum samples and faecal extracts from cheetahs. However, the canine calprotectin assay showed an inconsistent linearity together with an apparent over-recovery of spiked canine calprotectin in samples with a low analyte concentration. However, these deviations were not present in samples that were spiked with other serum or faecal
samples from cheetahs, and therefore, these results are consistent
with a lower avidity of the antibodies generated against canine calprotectin for the homologous protein in the cheetah. Whilst for the generation of these initial data, the use of the canine calprotectin assay for serum and faecal samples from cheetahs was deemed appropriate, further studies into calprotectin in cheetahs may require a species-specific assay.
Faecal concentrations of calprotectin and S100A12 were highly variable among cheetahs, paralleling findings in dogs (Heilmann et al. 2008, 2011a,b). Ideally, faecal concentrations of these biomarkers should be quantified in 3-day sample collections
(Heilmann et al. 2008), however, only 1-day sample collections were available for this study. Cheetah 3 showed, when fed whole rabbit, markedly higher faecal concentrations of both markers compared to the other cheetahs, without any clinical signs of compromised gut health. Although an analytical error could not be totally ruled out, cheetah 3 was not excluded from the dataset in this early stage of evaluating S100/calgranulins in an exotic felid.
Faecal calprotectin concentrations were not significantly different between diet groups. However, whereas calprotectin concentrations in cheetahs fed supplemented beef were within the same range as reported for healthy dogs using the same assay (3.2–65.4 μg/g, Heilmann et al. 2011b), the whole rabbit diet resulted in markedly lower calprotectin values as compared to previously reported concentrations in dogs. Compared to calprotectin, faecal S100A12 did differ between diet groups. Cheetahs fed supplemented beef had significantly higher faecal S100A12 concentrations compared to when fed whole rabbit. In addition, faecal S100A12 concentrations in cheetahs fed beef
exceeded the central 95th percentile of a single day faecal collection
in healthy dogs (2–1575 ng/g, Heilmann et al. 2012a), which may indicate on-going inflammatory conditions.
Simultaneously with the present study, the intestinal fermentation profile of these cheetahs on both diet types was examined (Depauw et al. 2011). Cheetahs fed a supplemented beef diet were observed to have significantly higher concentrations of putrefactive compounds, accompanied by looser stool and a
higher incidence of diarrhoea compared to the same cheetahs fed
whole rabbit. This difference is probably due to a combination of a higher protein intake and lower animal fibre content in meat-only diets compared with whole prey (Depauw et al. 2011, 2012). The significantly higher faecal S100A12 concentrations in cheetahs fed beef, compared with whole rabbit, strengthen the assumption that the higher incidence of putrefactive compounds and looser stool is indicative of compromised gut health in the cheetah.
To further evaluate the association between putrefactive compounds and intestinal inflammation, and to broaden our insight into gut health assessment, we examined the possible correlation between faecal S100A12 and calprotectin, faecal scores (Depauw et al. 2011) and faecal fermentation metabolites (Depauw et al. 2011). No significant correlations (data not shown) between these parameters were present, which is possibly due to the small number of studied cheetahs.
Recent studies revealed that faecal S100A12 has an improved diagnostic accuracy and a higher correlation to intestinal mucosal inflammation compared to faecal calprotectin in humans (Kaiser et al. 2007; Leach et al. 2007; Sidler et al. 2008). This might explain why faecal S100A12 concentrations, but not calprotectin concentrations, were significantly elevated in cheetahs fed a meat-only diet compared to whole rabbit diet for only one month.
Figure 1. Individual faecal calprotectin concentrations in faeces from
Given the limitations of the calprotectin assay, however, the lack of a significant difference in faecal calprotectin concentrations between the two dietary groups needs to be interpreted with caution.
Although blood concentrations of calprotectin and S100A12 have been reported as useful markers of intestinal inflammation (Foell et al. 2003; Heilmann et al. 2012b), increased serum concentrations occur in several disease conditions, particularly in inflammatory diseases, certain microbial infections, and neoplastic conditions (Johne et al. 1997; Striz and Trebichavsky 2004). At present, no studies have evaluated the relationship between serum and faecal concentrations of calprotectin or S100A12. In the current study, serum concentrations of neither marker correlated with their faecal concentrations. Moreover, serum concentrations were unaffected by diet and comparable with concentrations detected in healthy dogs (969–11,873 μg/L, Heilmann et al. 2011b and 57–326 μg/L, respectively, Heilmann et al. unpublished). It is possible that the feeding trial was too short to elicit changes in blood concentrations of these markers or that the sample size was inadequate. However, it is likely that serum calprotectin and S100A12 are less specific markers for intestinal inflammation, which warrants further investigation and the establishment of normal serum calprotectin and S100A12 concentrations in a larger sample of healthy cheetahs.
Conclusion
In the cheetah, faecal calprotectin and S100A12 concentrations were measured using ELISA assays that were previously analytically validated for dogs. These proteins are promising markers for future research on intestinal inflammation in the cheetah. Our results indicate that the type of diet affects faecal but not serum concentrations of S100/calgranulins in the captive cheetah. Significantly lower faecal S100A12 and numerically lower calprotectin concentrations were detected when cheetahs were fed whole rabbit compared with supplemented beef. Consequently, the diet type provided (whole prey or meat-only) can potentially affect intestinal inflammatory conditions in the captive cheetah. In light of the disproportionately high prevalence of gastrointestinal disease in cheetahs held in captivity, these findings warrant further investigation.
Acknowledgements
This study was funded by the Institute for Promotion of Innovation through Science and Technology in Flanders (IWT-Vlaanderen), within the scope of the postgraduate study of the first author. The authors gratefully acknowledge Julia and Jesper Stagegaard, Sofie Nielsen, Michael Wissing Nitschke and Gry Nippin from Ree Park Ebeltoft Safari for their tremendous support during this trial. Special thanks are given to Ellen Verherstraeten and Koen van Geenen for their assistance during feeding and sample collections. The authors also thank Theodore J. Markulin for his help with the sample analysis. Kiezebrink (Putten, the Netherlands) is greatly appreciated for the provision of the test diets. A patent that includes the S100A12 ELISA used in this study is currently pending (Heilmann, Suchodolski, Steiner), and it is declared by the corresponding author that no other conflicts of interest exist for the present manuscript.
References
Costa F., Mumolo M.G., Bellini M., Romano M.R., Ceccarelli L., Arpe P., Sterpi C., Marchi S., Maltinti G. (2003) Role of faecal calprotectin as non-invasive marker of intestinal inflammation. Digestive and Liver Disease 35: 642–647.
Depauw S., Hesta M., Whitehouse-Tedd K., Vanhaecke L., Verbrugghe A., Janssens, G.P.J. (2011) Animal fibre: the forgotten nutrient in strict carnivores? First insights in the cheetah. Journal of Animal Physiology and Animal Nutrition 97: 146–157.
Depauw S., Bosch G., Hesta M., Whitehouse-Tedd K., Hendriks W., Kaandorp J., Janssens, G.P.J. (2012) Fermentation of animal components in strict carnivores: a comparative study with cheetah fecal inoculum. Journal of Animal Science 90: 2540–2548.
D’Inca R., Dal Pont E., Di Leo V., Ferronato A., Fries W., Vettorato M.G., Martines D., Sturniolo G.C. (2008) Calprotectin and lactoferrin in the assessment of intestinal inflammation and organic disease. International Journal of Colorectal Disease 22: 429–437.
Fagerholl M.K. (2000) Calprotectin, a faecal marker of organic gastrointestinal abnormality. The Lancet 356: 1783–1784.
Foell D., Kucharzik T., Kraft M., Vogl T., Sorg C., Domschke W., Roth J. (2003) Neutrophil derived human S100A12 (EN-RAGE) is strongly expressed during chronic acute active inflammatory bowel disease. Gut 52: 847–853.
Foell D., Wittkowski H., Roth J. (2009) Monitoring disease activity by stool analyses: from occult blood to molecular markers of intestinal inflammation and damage. Gut 58: 859–868.
Grellet A., Heilmann R.M., Feugier A., Lecoindre P., Hernandez J., Freiche V., Peeters D., Suchodolski J.S., Steiner J.M. (2011) Fecal calprotectin concentration in adult dogs with acute and chronic gastrointestinal disease. Journal of Veterinary Internal Medicine 25: 1486–1487 (abstract).
Heilmann R.M., Suchodolski J.S., Steiner J.M. (2008) Development and analytic validation of a radioimmunoassay for the quantification of canine calprotectin in serum and feces from dogs. American Journal of Veterinary Research 69: 845–853.
Heilmann R.M., Suchodolski J.S., Steiner J.M. (2011a) Development and analytic validation of an immunoassay for the quantification of canine S100A12 in serum and fecal samples and its biological variability in serum from healthy dogs. Veterinary Immunology and Immunopathology 144: 200–209.
Heilmann R.M., Guard B.C., Weber K., Suchodolski J.S., Steiner J.M. (2011b) Development and analytical validation of an enzyme-linked immunosorbent assay for the quantification of canine calprotectin in serum and feces from dogs. Journal of Veterinary Internal Medicine 25: 693 (abstract).
Heilmann R.M., Grellet A., Allenspach K., Lecoindre P., Day M.J., Procoli F., Grützner N., Suchodolski J.S., Steiner J.M. (2012a) Fecal S100A12 concentrations are increased in dogs with inflammatory bowel disease. Journal of Veterinary Internal Medicine 26: 767 (abstract).
Heilmann R.M., Jergens A.E., Ackermann M.R., Barr J.W., Suchodolski J.S., Steiner J.M. (2012b) Serum canine calprotectin concentrations in dogs with idiopathic inflammatory bowel disease. American Journal of Veterinary Research 73: 1900–1907.
Johne B., Fagerhol M.K., Lyberg T., Prydz H., Brandtzæg P., Naess-Andresen C.F., Dale I. (1997) Functional and clinical aspects of the myelomonocyte protein calprotectin. Journal of Clinical Pathology: Molecular Pathology 50: 113–123.
Kaiser T., Langhorst T., Wittkowski H., Becker K., Friedrich A.W., Rueffer A., Dobos G.J., Roth J., Foell D. (2007) Faecal S100A12 as a non-invasive marker distinguishing inflammatory bowel disease from irritable bowel syndrome. Gut 56: 1706–1713.
Konikoff M.R., Denson L.A. (2006) Role of fecal calprotectin as a biomarker of intestinal inflammation in inflammatory bowel disease. Inflammatory Bowel Disease 12: 524–534.
Kotsch V., Kubber-Heiss A., Url A., Walzer C., Schmidt R. (2002) Diseases of captive cheetahs (Acinonyx jubatus) within the European Endangered Species Program (EEP) – a 22-year retrospective histopathological study. Wiener Tierärztliche Monatsschrift 89: 341–350.
Leach S.T., Yang Z., Messina I., Song C., Geczy C.L., Cunningham A.M., Day A.S. (2007) Serum and mucosal S100 proteins, calprotectin (S100A8/ S100A9) and S100A12, are elevated at diagnosis in children with inflammatory bowel disease. Scandinavian Journal of Gastroenterology 42: 1321–1331.
Matsui T., Matsukawa Y., Sakai T., Nakamura K., Aoike A., Kawai K. (1995) Effect of ammonia on cell-cycle progression of human gastric-cancer cells. European Journal of Gastroenterology and Hepatology 7: S79–S81.
Munson L. (1993) Diseases of captive cheetahs (Acinonyx jubatus) – results of the Cheetah Research Council Pathology Survey, 1989–1992. Zoo
Biology 12: 105–124.
Munson L., Nesbit J.W., Meltzer D.G., Colly L.P., Bolton L., Kriek N.P. (1999) Diseases of captive cheetahs (Acinonyx jubatus jubatus) in South Africa: a 20-year retrospective survey. Journal of Zoo Wildlife and Medicine 30: 342–347.
free-ranging and captive cheetah (Acinonyx jubatus) populations. Journal of Wildlife Diseases 41: 542–548.
Otoni C.C., Heilmann R.M., Garcia-Sancho M., Suchodolski J.S., Steiner J.M., Jergens A.E. (2012) Serologic and fecal markers in prediction of acute disease course in canine chronic enteropathies. Journal of Veterinary Internal Medicine 26: 768 (abstract).
Pedersen G., Brynskov J., Saermark T. (2002) Phenol toxicity and conjugation in human colonic epithelial cells. Scandinavian Journal of Gastroenterology 37: 74–79.
Røseth A.G., Fagerhol M.K., Aadland E., Schjonsby H. (1992) Assessment of the neutrophil dominating protein calprotectin in feces. A methodologic study. Scandinavian Journal of Gastroenterology 27: 793–798. Roth J., Vogl T., Sorg C., Sunderkötter C. (2003) Phagocyte-specific S100
proteins: a novel group of proinflammatory molecules. Trends in Immunology 24: 155–158.
Sidler M.A., Leach S.T., Day A.S. (2008) Fecal S100A12 and fecal calprotectin as noninvasive markers for inflammatory bowel disease in children. Inflammatory Bowel Disease 14: 359–366.
Striz I., Trebichavsky I. (2004) Calprotectin – a pleiotropic molecule in acute and chronic inflammation. Physiological Research 53: 245–253.
Summerton C.B., Longlands M.G., Wiener K., Shreeve D.R. (2002) Faecal calprotectin: a marker of inflammation throughout the intestinal tract. European Journal of Gastroenterology and Hepatology 14: 841–845. Tuohy K.M., Hinton D.J.S., Davies S.J., Crabbe M.J.C., Gibson G.R., Ames
J.M. (2006) Metabolism of Maillard reaction products by the human gut microbiota – implications for health. Molecular Nutrition and Food Research 50: 847–857.
Weber F.L., Banwell J.G., Fresard K.M., Cummings J.H. (1987) Nitrogen in fecal bacterial, fiber, and soluble fractions of patients with cirrhosis: effects of lactulose and lactulose plus neomycin. Journal of Laboratory and Clinical Medicine 110: 259–263.
Whitehouse-Tedd K., Lefebre S., Janssens G.P.J. (2012) A global survey of captive cheetah diet, faecal consistency and gastrointestinal disease. In Proceedings of the 14th Annual BIAZA Research Symposium, 10–11 July 2012, Newquay Zoo, UK, p 9.