VOLUME 39, ARTICLE 33, PAGES 897
,
910
PUBLISHED 23 OCTOBER 2018
https://www.demographic-research.org/Volumes/Vol39/33/ DOI: 10.4054/DemRes.2018.39.33
Descriptive Finding
Persistence of death in the United States:
The remarkably different mortality patterns
between America’s Heartland and Dixieland
Wesley James
Jeralynn Cossman
Julia Kay Wolf
© 2018 Wesley James, Jeralynn Cossman & Julia Kay Wolf.
This open-access work is published under the terms of the Creative Commons Attribution 3.0 Germany (CC BY 3.0 DE), which permits use, reproduction, and distribution in any medium, provided the original author(s) and source are given credit.
1 Introduction and background 898
2 Data and methods 899
3 Results 900
3.1 Preliminary findings 900
3.2 Time series findings 902
4 Discussion 905
Persistence of death in the United States:
The remarkably different mortality patterns between America’s
Heartland and Dixieland
Wesley James1
Jeralynn Cossman2
Julia Kay Wolf2
Abstract
BACKGROUND
Geographic disparities in mortality have been analyzed by place in myriad ways. Although the people who live in a place continuously change, the health characteristics of those places tend to stay the same; they are persistent. Our work analyzes persistence of mortality across various geographic designations and uncovers the wide-ranging disparities in death across the United States.
METHODS
Using 48 years of county-level mortality data, we analyze trends over time and disparities across places using rural–urban distinctions and census-based region and division classifications. Trends in death rates, excess deaths, and rates of mortality improvement are provided.
RESULTS
Findings support the hypothesis that persistently high mortality places are disproportionately concentrated in the rural South, particularly the East South Central division of Kentucky, Tennessee, Mississippi, and Alabama. The disparity between this division and urban America is wide and getting wider, and the disparity between this area of the South and the Midwest is alarming.
CONTRIBUTION
Our research moves forward the literature on place-based mortality disparities in two important areas by testing the notion of persistence of poor health in place, and by identifying geographic disparities based on classifications not previously tested.
1. Introduction and background
Recent public health research documents geographic disparities in mortality in the United States. This literature takes many different forms, particularly regarding the way ‘place’ is conceptualized, operationalized, and measured. Death rates (and life expectancy) differ markedly between urban and rural counties (Cosby et al. 2008; Cossman et al. 2010), proximity to urban centers (James 2014), race and region combinations (Singh and Siahpush 2014; James and Cossman 2017; Cossman, James, and Wolf 2017), and race, region, population density, and homicide combinations (Murray et al. 2005, 2006). No matter how scientists differ in their various definitions, one thing remains clear: place matters.
A critical factor in understanding ‘place’ is knowing that it is dynamic. Recent decades have seen changes in macro-level restructuring of place. Places that were once rural are now suburban, economic opportunities have come and gone, and population shifts have changed the age, race, and ethnic makeup of communities (Lichter and Brown 2011). More closely related to health and mortality outcomes are factors such as having a regular source of medical care (Litaker et al. 2005), lifestyle and behaviors (Pampel and Rogers 2004; Cockerham 2005), physician and hospital shortages (Ricketts 1999; Li et al. 2009), and income inequality (Lowry 2004). These factors differ dramatically from one place to another and change over time. Despite this constant change, health outcomes persist in communities, generation after generation, suggesting that perhaps place is more important than population (Cossman et al. 2007).
2. Data and methods
We use the National Center for Health Statistics Compressed Mortality File from 1968 to 2015 (US DHHS), which measures all deaths by cause, age, race, sex, and county of residence at time of death for each year. Using five-year all-cause age-adjusted (2000 standard million) mortality rates (per 100,000) results in more stable rates for particular rural areas and provides rates that can be compared across counties (N = 3,061, no AK and HI) and time. Population data is based on US Census estimates of total US, state, and county resident populations.
The focus of this research is on the temporal nature of geographic mortality patterns; thus, we analyze persistence of mortality. Persistence is measured over time using average mortality rates from ten time periods: 1968–1972, 1973–1977, 1978– 1982, 1983–1987, 1988–1992, 1993–1997, 1998–2002, 2003–2007, 2008–2012, and 2013–2015. In each time period counties are designated as high, average, or low mortality based on the following: high mortality = greater than 1 standard deviation above the national mean, average mortality = within 1 standard deviation of the national mean, and low mortality = greater than 1 standard deviation below the national mean. For a county to be designated as persistently high mortality, it must be counted as high mortality in at least five out of ten time periods, not offset by low mortality counts – i.e., over the period of 48 years, that county had an excessively high mortality rate at least half the time.
The primary categories of distinction in this research are census designations and rural–urban classifications. Census regions are Northeast, Midwest, South, and West, and divisions are New England, Middle Atlantic, East North Central, West North Central, South Atlantic, East South Central, West South Central, Mountain, and Pacific.3 Our analysis examines persistence of mortality across each of the four regions,
and also refines this analysis to the census division level.
The Rural Urban Continuum Codes (RUCCs) represent the rural–urban distinctions in our work. This measurement is frequently used in research that explores place (Singh and Siahpush 2002; Hall, Kaufman, and Ricketts 2006; Cossman et al. 2010; James 2014). RUCCs are a nine-category classification of counties that are available through the US Department of Agriculture, Economic Research Service
3 Census divisions are groups of states divided into subregions within each region. The Northeast has two
(Cromartie and Parker 2017). Categories 0–3 are urban, with a population range from less than 250,000 to more than 1 million, representing roughly 83% of the American population. Categories 4–9 represent rural classifications based on population size and adjacency to an urban area, representing approximately 17% of the American population. Rural classifications 4 (adjacent to metro area) and 5 (not adjacent) are a population of 20,000 or more. RUCCs 6 (adjacent) and 7 (not adjacent) are a population of 2,500 to 19,999, and RUCCs 8 (adjacent) and 9 (not adjacent) are a population of less than 2,500. After 1996, code 0 merged into code 1. Categories 6–9 most accurately represent rural, rather than suburban, and are thus utilized in this manuscript.
In our analysis, the three main sources of data are merged together to form a dataset of mortality rates for each year between 1968 and 2015, Census region and division codes, and RUCC indicators. This dataset allows for three sets of mortality rate comparisons: (1) rural vs. urban, (2) census region and division comparisons, and (3) rural–urban differences in mortality within each census region and division. Analyses answer the following questions: (1) Are persistently high mortality counties evenly distributed across rural and urban places? (2) Are persistently high mortality counties evenly distributed across census regions and divisions? (3) Are persistently high mortality counties disproportionately located in the South?
3. Results
3.1 Preliminary findings
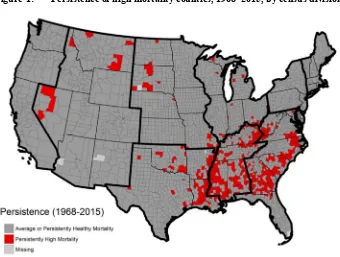
even greater than today. A visual representation of the regional–divisional distribution of persistently high mortality counties is seen below in Figure 1.
Figure 1: Persistence of high mortality counties, 1968–2015, by census division
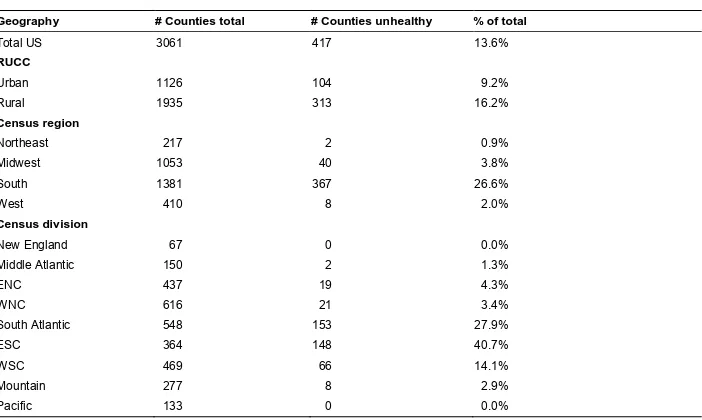
Table 1: Persistently unhealthy counties by rural–urban, region, and division
Geography # Counties total # Counties unhealthy % of total
Total US 3061 417 13.6%
RUCC
Urban 1126 104 9.2%
Rural 1935 313 16.2%
Census region
Northeast 217 2 0.9%
Midwest 1053 40 3.8%
South 1381 367 26.6%
West 410 8 2.0%
Census division
New England 67 0 0.0%
Middle Atlantic 150 2 1.3%
ENC 437 19 4.3%
WNC 616 21 3.4%
South Atlantic 548 153 27.9%
ESC 364 148 40.7%
WSC 469 66 14.1%
Mountain 277 8 2.9%
Pacific 133 0 0.0%
3.2 Time series findings
Figure 2: Rural–urban vs. census region mortality trends, 1968–2015
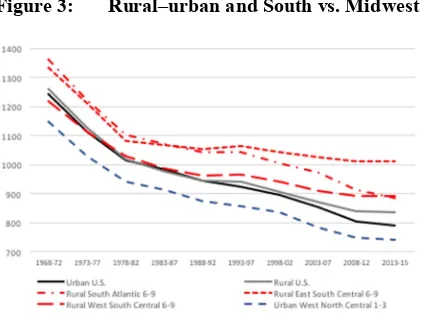
The excessively high rate of mortality in the South prompted further investigation into its three census divisions; SA, ESC, and WSC. The rural counties of the southern divisions are depicted in red in Figure 3, where all divisions experience higher mortality than the urban (and rural) reference category. Of the three southern census divisions, the rural counties of the ESC division exhibit the worst mortality outcomes, a rate in excess of 1,000 deaths per 100,000. This finding is particularly alarming compared to the urban West North Central (WNC) where a rate of 740 is observed. Figure 3 illustrates a remarkable difference between the South and Midwest. This trend, while diverging in recent years, has existed since the late 1960s, supporting the hypothesis that the unhealthiest places are deeply persistent.
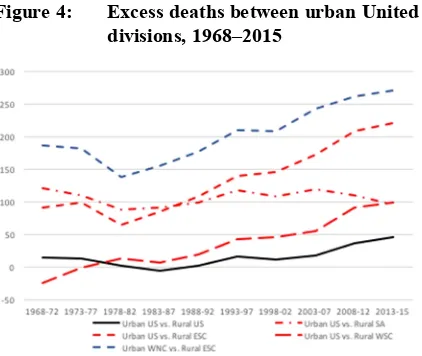
An examination of excess deaths between regions and divisions reveals an increasingly poor situation for rural ESC, as shown in Figure 4. At the beginning of the time series, the rural ESC experienced 100 excess deaths compared to urban America, and 200 excess deaths compared to urban WNC. In the most recent year it experiences 220 and 270 excess deaths, respectively. While the rural ESC has always been at a mortality disadvantage, it has been exacerbated in recent years. Figure 4 reveals another issue: While excess deaths have converged in rural SA and WSC, rural ESC continues to separate from the other rural South divisions.
Figure 4: Excess deaths between urban United States and rural South divisions, 1968–2015
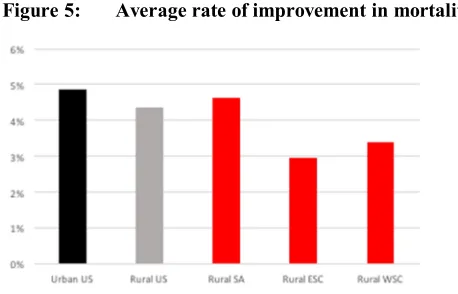
Figure 5: Average rate of improvement in mortality, 1968–2015
4. Discussion
This research moves forward the literature on place-based mortality disparities in two areas: (1) testing for persistence of poor health in place, and (2) identifying geographic disparities based on classifications that are not previously tested. A decade ago, Cosby et al. (2008) introduced the rural mortality penalty and how it has persisted over time. In more recent years, James (2014) documented marked disparities, not only between rural and urban places, but also between rural and rural places. Our findings add yet another layer of complexity, that of intra-rural differences across regions and divisions. We provide further confirmation that all rural places are not alike; in fact, they vary tremendously, not only by the region of the country in which they are located, but also by their smaller division. As hypothesized, we confirm that persistently high mortality counties are not evenly distributed across rural and urban places. They are not evenly distributed across regions and divisions, and they are disproportionately located in the rural South. (The persistently healthy places are located in the upper Midwest.)
socialization process exerts a powerful influence over the individuals (Durkheim, Lukes, and Halls 1982).
Prior work on the rural mortality penalty identified a rural–urban gap just shy of 100 deaths per 100,000 (Cosby et al. 2008). Using that number as a baseline comparison, the disparity outlined in the current work is a staggering 220 deaths per 100,000 in the ESC division, i.e., Kentucky, Tennessee, Mississippi, and Alabama. Further, it is nearly 300 deaths per 100,000 higher than the urban places in Missouri, Kansas, Iowa, Minnesota, and North Dakota, representing a staggering difference between America’s Heartland and Dixieland.
References
Cockerham, W.C. (2005). Health lifestyle theory and the convergence of agency and structure. Journal of Health and Social Behavior 46(1): 51–67.
doi:10.1177/002214650504600105.
Cosby, A., Neaves, T., Cossman, R., Cossman, J., James, W., Feierabend, N., Mirvis, D., Jones, C., and Farrigan, T. (2008). Preliminary evidence for an emerging non-metropolitan mortality penalty in the United States. American Journal of Public Health 98(8): 1470–1472.doi:10.2105/AJPH.2007.123778.
Cossman, J., Cossman, R., James, W., Campbell, C., Blanchard, T., and Cosby, A. (2007). Persistent clusters of mortality in the United States.American Journal of Public Health 97(12): 2148–2150.doi:10.2105/AJPH.2006.093112.
Cossman, J., James, W., Cosby, A., and Cossman, R. (2010). Underlying causes of the emerging nonmetropolitan mortality penalty.American Journal of Public Health
100(8): 1417–1419.doi:10.2105/AJPH.2009.174185.
Cossman, J., James, W., and Wolf, J. (2017). The differential effects of rural health care access on race-specific mortality. Social Science and Medicine – Public Health
3: 618–623.
Cromartie, J. and Parker, T. (2017). Rural classifications [electronic resource]. Washington, D.C.: Economic Research Service, US Department of Agriculture.
http://www.ers.usda.gov/topics/rural-economy-population/rural-classifications/ what-is-rural.aspx#.UtWLlPvAbng.
Durkheim, E., Lukes, S., and Halls, W.D. (1982).The rules of the sociological method. The Free Press: New York.doi:10.1007/978-1-349-16939-9.
Fenelon, A. (2013). Geographic divergence in mortality in the United States.
Population Development Review 39(4): 611–634. doi:10.1111/j.1728-4457. 2013.00630.x.
Fox, M. (2017, December 21). U.S. life expectancy falls for second straight year: As drug overdoses soar. NBC News. https://www.nbcnews.com/storyline/americas- heroin-epidemic/u-s-life-expectancy-falls-second-straight-year-drug-overdoses-n831676.
Hall, S.A., Kaufman, J.S., and Ricketts, T.C. (2006). Defining urban and rural areas in US epidemiologic studies. Journal of Urban Health 83(2): 162–175.
James, W. (2014). All rural places are not created equal: Revisiting the rural mortality penalty in the United States.American Journal of Public Health 104(11): 2122– 2129.doi:10.2105/AJPH.2014.301989.
James, W. and Cossman, J. (2017). Long-term trends in black and white mortality in the rural United States: Evidence of a race-specific rural mortality penalty. The Journal of Rural Health 33(1): 21–31.doi:10.1111/jrh.12181.
Lichter, D.T. and Brown, D.L. (2011). Rural America in an urban society: Changing spatial and social boundaries. Annual Review of Sociology 37: 565–592.
doi:10.1146/annurev-soc-081309-150208.
Li, P., Schneider, J.E., and Ward, M.M. (2009). Converting to critical access status: How does it affect rural hospitals’ financial performances?Inquiry 46(1): 46–57.
doi:10.5034/inquiryjrnl_46.01.46.
Litaker, D., Koroukian, S.M., and Love, T.E. (2005). Context and healthcare access.
Medical Care 43(6): 531–540.doi:10.1097/01.mlr.0000163642.88413.58. Lowry, A. (2014, March 15). Income gap, meet the longevity gap. New York Times.
http://www.nytimes.com/2014/03/16/business/income-gap-meet-the-longevity-gap.html?_r=0.
Murray, C.J.L., Kulkarni, S., and Ezzati, M. (2005). Eight Americas: New perspectives on US health disparities.American Journal of Preventive Medicine 29(5): 4–10.
doi:10.1016/j.amepre.2005.07.031.
Murray, C., Kulkarni, S., Michaud, C., Tomijima, N., Bulzacchelli, M.T., Iandiorio, T.J., and Ezzati, M. (2006). Eight Americas: Investigating mortality disparities across races, counties, and race-counties in the United States. PLoS Medicine
3(12): 1513–1524.doi:10.1371/journal.pmed.0030545.
Pampel, F.C. and Rogers, R.G. (2004). Socioeconomic status, smoking, and health: A test of competing theories of cumulative advantage. Journal of Health and Social Behavior 45(3): 306–321.doi:10.1177/002214650404500305.
Ricketts, T.C. (1999).Rural health in the United States. New York: Oxford University Press.
Singh, G.K. and Siahpush, M. (2002). Increasing rural–urban gradients in US suicide mortality, 1970–1997. American Journal of Public Health 92(7): 1161–1167.
Singh, G.K. and Siahpush, M. (2014). Widening rural–urban disparities in life expectancy, U.S., 1969–2009. American Journal of Preventive Medicine 46(2): e19–e29.doi:10.1016/j.amepre.2013.10.017.