Constant Stress Partially Accelerated Life Test Design for
Inverted Weibull Distribution with Type-I Censoring
Mustafa Kamal
*, Shazia Zarrin, Arif-Ul-Islam
Department of Statistics & Operations Research, Aligarh M uslim University, Aligarh, 202002 (U.P.), India
Abstract
In Acce lerated Life Testing, accele ration factor is known or there e xists a mathe matica l mode l which specifies the life stress relationship. However, there are some s ituations in which neither accelerat ion factor is known nor such models e xist or are very hard to assume. In such cases partially accele rated life tests are better criterion to use. This paper deals with simp le Constant Stress Partially Accele rated life test using type-I censoring. Assuming that the lifetimes of test item fo llo w Inverted Weibull dis tribution, the ma ximu m like lihood estimation procedure is used to obtain the estimates for the distribution parameters and acceleration factor. Asymptotic confidence interval estimates of the model para meters are also evaluated by using Fisher informat ion matrix. A Simu lation study is used to illustrate the statistical p roperties of the parameters and the confidence intervals.Keywords
Acceleration Factor, Ma ximu m Likelihood Estimation, Re liability Function, Fisher Information Matrix, Asymptotic Confidence Interval, Simulat ion Study1. Introduction
In life testing and reliability e xperiments, time -to-failure data obtained under norma l operating conditions is used to analyze the product’s failure-time distribution and its associated parameters. The continuous improve ment in manufacturing design of today’s products and materials ma kes them highly re liab le. Therefore , it is very difficu lt to obtain such life data wh ile testing them at norma l use conditions and the small t ime period between design and release. Under such conditions the life testing becomes very e xpensive and time consuming. These proble ms have motivated researchers to develop new life testing method and obtain time ly in formation on the reliability of products, components and materia ls. Accelerated life testing (ALT) is then adopted and widely used in manufacturing industries. In ALT, products are tested at higher-than-usual levels of stress (e.g., te mperature, voltage, humid ity, vibration or pressure) to induce early failure. The life data co llected fro m such accelerated tests is then analyzed and extrapolated to estimate the life characteristics under norma l operating conditions by using a proper life stress relationship.
A lot o f lit eratu re is ava ilab le fo r A LT ana lysis. For e xa mp le , Ne lson [1, 2] pro v ides a b ib lio graphy o f 159 re fe re n c es o n st at ist ic a l p la ns fo r ac c e le rat ed t ests . Shan-rang et al.[3] developed the statistical analysis method * Corresponding author:
[email protected] (Mustafa Kamal) Published online at http://journal.sapub.org/algorithms
Copyright © 2013 Scientific & Academic Publishing. All Rights Reserved
e xposure model using the Loma x. Xu and Fei[13] introduced and compared the four basic mode ls for step -stress ALT: cumulat ive e xposure model (CEM), linear cu mu lative e xposure model (LCEM ), ta mpered random variable model (TRVM), and tampered fa ilure rate model (TFRM). Limitations of the four models were a lso discussed for better use of the models.
There are situations where a life stress relationship is not known and cannot be assumed, i.e., the data obtained from ALT cannot be e xtrapolated to use conditions. In such situations, partially accele rated life testing (PALT) is used. In PA LT, test units are run at both use and accelerated conditions. Constant stress PALT and step stress are two commonly used methods. In constant stress PALT products are tested at either normal use or accele rated condition only until the test is terminated. In step stress PALT , a samp le of test items is first run at use condition and, if it does not fail for a specified time, then it is run at accelerated condition until a prespecified nu mbers of fa ilures are obtained or a prespecified time has reached.
So far a few research artic les are availab le for constant stress PALT in which Ba i & Chung[14] consider constant stress PALT to obtain ma ximu m like lihood estimates of the parameter of the e xponential distribution and the acceleration under type-I censoring, Abdel-Ghaly et a l.[15] presented the MLE method to estimate the para meters of the Burr XII distribution with Types I and II censoring for a constant stress-PALT mode l, Abdel-Ha mid[16] a lso considered the MLE method to estimate the parameters of the Burr XII distribution with progressive Type II censoring for a constant stress -PALT model, Ali A. Is ma il[17] obtained the ma ximu m like lihood estimators of the model parameters consider constant stress PALT with type-II censoring assuming that the lifetime at design stress has Weibull distribution. Cheng and Wang[18] p resent a model for constant-stress PALT for Bu rr XII d istribution under mu ltip le censored data. The performance of the MLEs of the parameters was obtained by two ma ximizat ion methods. One is quasi-Ne wton algorith m and other is the e xpectation-ma x imization (EM ) a lgorith m. More recently Zarrin et a l.[19] considered constant stress PALT with type-I censoring. Assuming Rayle igh distribution as the underlying lifetime distribution, the MLEs o f the distribution para meter and acceleration factor were obtained.
In this paper Constant Stress PALT p lan using type-I censoring assuming that the lifetimes of test ite m at use condition follow an Inverted Weibull distribution is considered. Maximu m like lihood estimates and confidence intervals for para meters and acceleration factor are obtained. The performance of the infe rence method used in present papers is evaluated by a simulat ion study.
2. The Model
Notations: So me notations are used fro m Ba i & Chung[14]
n total number of test items in a PA LT
censoring time of in constant stress PALT
T life t ime of an ite m at use condition
X life t ime of an ite m at accelerated condition
acceleration factor (1) and defined as T X
i
t observed life time of ithite m at use condition
j
x observed life t ime o f jth ite m at accelerated condition
( ) )
1
( t nu
t ordered failure times at use condition
(1)
( )
ax x
n
ordered failure times at accelerated conditionThe Inverte d Wei bull distribution
The probability density function (PDF), cu mulat ive distribution function (CDF), re liability function (RF) and hazard function (HF) for Inverted Weibull d istribution with scale para meter and shape parameter are given respectively by
t
e
tt
f
(
)
( 1),
t
,
,
0
(1)( )
tF t
e
( )
1
R t
e
t
( 1)
1
( )
t
t
h t
e
Constant Stress PALT Proce dure:
i. Total n ite ms are div ided randomly into two samp les of sizes n(1r)and
nr
respectively where r is samp le proportion. First sample is allocated to norma l use condition and other is assigned to accelerated conditions.ii. Each test ite m of every samp le is run without changing the test condition until the censoring time.
Assumpti ons:
i. At use condition thelifetime of a test ite m follows an Inverted Weibull distribution given in (1).
ii. The lifet ime of a test ite m at accelerated condition is obtained by using X 1T where1, is an acceleration factor. There fore, the PDF at acce lerated condition is given, for x0, 0, 1, by
( 1) ( )
( )
(
)
xf t
x
e
(2) iii. The lifetimes Ti,i1,,n(1r) of ite ms allocated to norma l condition are i.i.d. rando m variables.iv. The lifetimes Xj,j1,,nr , of ite ms allocated to accelerated condition are i.i.d. random variables.
v. The lifet imes Ti and Xj are mutually independent.
3. Parameter Estimation
estimates of para meter with good statistical properties such as consistency, asymptotic unbiased, asymptotic efficiency and asymptotic normality. In this method, the estimates of parameters are those values which ma ximize the sampling distribution of data. However, ML estimat ion method is very simp le for one para meter distributions but its imple mentation in A LT is mathemat ically more intense and, generally, estimates of para meters do not e xist in closed form, therefore, nume rica l techniques such as Newton Method and
some computer progra ms are used to compute them.
Let
ui and
ajbe the indicator functions (Indic ator Functi on is a function defined on a set S that indicates me mbe rship of an ele ment in a subset A of S, having the value 1 for a ll ele ments of A and the value 0 for all ele ments of Snot in A) at use and accelerated condition respectively, such that1
1, 2,
, (1
)
0
1
1, 2,
,
0
i ui j ajt
i
n
r
otherwise
x
j
nr
otherwise
(3)
The like lihood functions for (ti,
ui)and (xj,
aj)are respectively given by(1
)
(
1)
1
( ,
| , )
* 1
ui ui
i
n
r
t
ui
i
ui
i
i
L
t
t
e
e
(4)(
)
(
1)
(
)
1
(
,
| , , )
(
)
* 1
a j a j
j
nr
x
aj
j
aj
j
j
L
x
x
e
e
(5)where,
ui 1
ui and
aj
1
aj.The total like lihood for
(
t
1;
u1,
,
t
n(1r);
un(1r),
x
1;
a1,
,
x
nr;
anr)
is given by (1 )( 1) 1
( )
( 1) ( )
1
( , |
, )
1
*
(
)
1
ui ui i aj aj j n r t i i nr x j j
L t x
t
e
e
x
e
e
(6)The log likelihood function of (6)is
(1 ) (1 )
1 1
1 1
ln ln ln ( 1) ln
ln ln ln ( 1) ln ( 1) ln ( ) ( )
n r n r
ui i i ui
i i
nr nr
aj j j aj
j j
l L t t
x x
(7)MLEs of , and are obtained by solving the system of equations 0
l
, 0
l
and 0
l
respectively, where
(1 ) (1 )
1 1
1 1
(
)
ln
ln
[ (1
)
]
ln
ln(
)
(
)
ln(
) (
) (
)
ln(
)
n r n r
u a
ui i ui i i u
i i
nr nr
aj j aj j j a
j j
n
n
l
t
t
t
n
r
n
x
x
x
nr
n
(8) (1 ) 1 1
(
)
[ (1
)
]
(
)
(
)(
)
n r nr
u a
ui i u aj j a
i j
n
n
l
t
n
r
n
x
nr
n
1
(
)
(
)(
)
nr a
aj j a
j
n
l
x
nr
n
(10)where u
n
represent the number o f ite ms fa iled at use condition and is given byui r n
i u
n
(1 )1
a
n represent number of ite ms failed at accelerated condition and is given by
aj nr
j a
n
1
Equations (8), (9) and (10) are non-linear equations and in order to obtain the MLEs of , and, their solutions will numerically be obtained by using Newton Raphson method .
4. Asymptotic Confidence Interval
According to large sa mple theory, the ma ximu m like lihood estimators, under some appropriate regularity conditions, are consistent and norma lly distributed. Since ML estimates of para meters a re not in c losed form, therefore, it is impossible to obtain the e xact confidence intervals, so asymptotic confidence intervals based on the asymptotic norma l d istribution of M L estimators instead of e xact confidence intervals are obtained here.
The observed Fisher informat ion matrix can be e xpressed in terms of the second derivative of the log like lihood function under the regularity conditions as :
2 2 2 2 2 2 2 2 2 2 2 2
l l l l l l l l l Fwhere e le ments of Fisher information mat rix a re given as
2 (1 )
2 2 2 2 1 2 2 1 ( )
(ln ) [ (1 ) ] (ln )
( ) {ln( )} ( ) ( ) {ln( )}
n r
u a
ui i i u
i nr
aj j j a
j
n n
l
t t n r n
x x nr n
2 22 ( )
a
u n
n
l
2
( 2) ( 2)
2 2
1
(
1)
*
(
1)
(
)
nr a
aj j a
j
n
l
x
nr
n
(1 ) 2 2 1 1ln [ (1 ) ] ln ( ) ln( ) ( )( ) ln( )
n r nr
ui i i u aj j j a
i j
l l
t t n r n x x nr n
) ln( ) ( 1 2 2 j j aj nr j x x ll
) ln( ) )( ( nr na
2 2 1 2 1 1 12 ( 1) 1
1
(
1)
(
1)
(
)
nr nr
a
aj j aj j
j j a
n
l
l
x
x
nr
n
The 100% asymptotic confidence interval for o f, andare then given respectively by
ˆZ AVar(ˆ)
ˆ Z AVar(ˆ) and
ˆ Z AVar(ˆ)
5. Simulation Study
To evaluate the performance of the method of infe rence described in present study, first a random data with samp le
sizes n10,20,...,80 and censoring times
15,25,35,45 is generated from Inverted Weibull distribution. The valuesof parameters are chosen to be
0
.
75
,
0
.
25
,
1
.
2
,
1
.
4
. The estimators and the correspondingsummary statistics are obtained by the present Constant Stress PALT model. For d iffe rent given samples and censoring times with
0
.
75
,
0
.
25
,
1
.
2
,
1
.
4
the ML estimates of, the asymptotic standard error(
SE
),
the mean squared error (MSE)and the coverage rate of the 95% confidence interval for , and
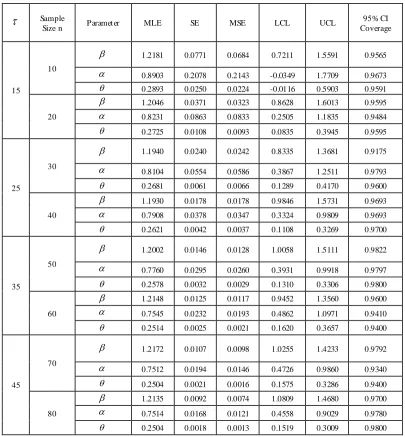
based on 500 simu lation replications are obtained and summarized in Table-1 and 2.Table 1. Simulation results for constant stress PALT with0.75,0.25,1.2 and r0.3
SampleSize n Parameter MLE SE MSE LCL UCL
95% CI Coverage
15
10
1.2181 0.0771 0.0684 0.7211 1.5591 0.9565 0.8903 0.2078 0.2143 -0.0349 1.7709 0.9673
0.2893 0.0250 0.0224 -0.0116 0.5903 0.9591
20
1.2046 0.0371 0.0323 0.8628 1.6013 0.9595 0.8231 0.0863 0.0833 0.2505 1.1835 0.9484
0.2725 0.0108 0.0093 0.0835 0.3945 0.9595
25
30
1.1940 0.0240 0.0242 0.8335 1.3681 0.9175 0.8104 0.0554 0.0586 0.3867 1.2511 0.9793
0.2681 0.0061 0.0066 0.1289 0.4170 0.9600
40
1.1930 0.0178 0.0178 0.9846 1.5731 0.9693 0.7908 0.0378 0.0347 0.3324 0.9809 0.9693
0.2621 0.0042 0.0037 0.1108 0.3269 0.9700
35
50
1.2002 0.0146 0.0128 1.0058 1.5111 0.9822
0.7760 0.0295 0.0260 0.3931 0.9918 0.9797
0.2578 0.0032 0.0029 0.1310 0.3306 0.9800
60
1.2148 0.0125 0.0117 0.9452 1.3560 0.9600 0.7545 0.0232 0.0193 0.4862 1.0971 0.9410
0.2514 0.0025 0.0021 0.1620 0.3657 0.9400
45
70
1.2172 0.0107 0.0098 1.0255 1.4233 0.9792
0.7512 0.0194 0.0146 0.4726 0.9860 0.9340
0.2504 0.0021 0.0016 0.1575 0.3286 0.9400
80
1.2135 0.0092 0.0074 1.0809 1.4680 0.9700 0.7514 0.0168 0.0121 0.4558 0.9029 0.9780
0.2504 0.0018 0.0013 0.1519 0.3009 0.9800
4
.
1
,
2
.
1
,
25
.
0
,
75
.
0
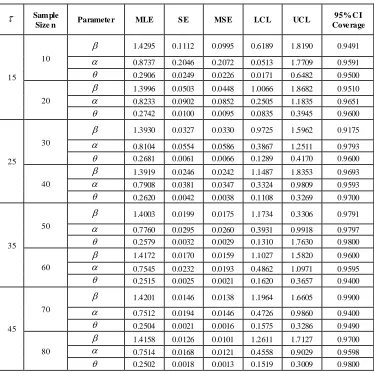
Table 2. Simulation results for constant stress PALT with 0.75,0.25,1.4, and r0.3
SampleSize n Paramete r MLE SE MSE LC L UC L
95% C I Cove rage
15
10
1.4295 0.1112 0.0995 0.6189 1.8190 0.9491 0.8737 0.2046 0.2072 0.0513 1.7709 0.9591
0.2906 0.0249 0.0226 0.0171 0.6482 0.9500
20
1.3996 0.0503 0.0448 1.0066 1.8682 0.9510 0.8233 0.0902 0.0852 0.2505 1.1835 0.9651
0.2742 0.0100 0.0095 0.0835 0.3945 0.9600
25
30
1.3930 0.0327 0.0330 0.9725 1.5962 0.9175 0.8104 0.0554 0.0586 0.3867 1.2511 0.9793
0.2681 0.0061 0.0066 0.1289 0.4170 0.9600
40
1.3919 0.0246 0.0242 1.1487 1.8353 0.9693 0.7908 0.0381 0.0347 0.3324 0.9809 0.9593
0.2620 0.0042 0.0038 0.1108 0.3269 0.9700
35
50
1.4003 0.0199 0.0175 1.1734 0.3306 0.9791 0.7760 0.0295 0.0260 0.3931 0.9918 0.9797
0.2579 0.0032 0.0029 0.1310 1.7630 0.9800
60
1.4172 0.0170 0.0159 1.1027 1.5820 0.9600 0.7545 0.0232 0.0193 0.4862 1.0971 0.9595
0.2515 0.0025 0.0021 0.1620 0.3657 0.9400
45
70
1.4201 0.0146 0.0138 1.1964 1.6605 0.9900 0.7512 0.0194 0.0146 0.4726 0.9860 0.9400
0.2504 0.0021 0.0016 0.1575 0.3286 0.9490
80
1.4158 0.0126 0.0101 1.2611 1.7127 0.9700 0.7514 0.0168 0.0121 0.4558 0.9029 0.9598
0.2502 0.0018 0.0013 0.1519 0.3009 0.9800
6. Conclusions
Fro m results in Table 1 and 2, it is observed that estimates obtained by the present model estimates the true para meters
, and quite well respectively with re latively s mall mean squared errors. The estimated standard error a lso approximates well the sample standard deviation. For a fixed
, andwe find that as n increases, the mean squared
errors of the estimates get smalle r. This may be because that a larger sa mple size results in a better large sample approximation. It is also observed that the mean squared errors of the estimates get smaller as increases for a fixed
, and. It is also noticed that the coverage probabilit ies of the asymptotic confidence interval are close to the nomina l level and do not change much across t he different sample sizes. In short, it is reasonable to say that the present step stress ALT p lan works we ll and has a p ro mising potential in the analysis of accele rated life testing. For further future research in constant stress PALT one may consider some other life time d istribution with different censoring schemes .
REFERENCES
[1] Nelson, W. (2005): A Bibliography of Accelerated Test Plans, Part I−Overview, IEEE Trans. on Reliability, vol. 54, pp. 194-197.
[2] Nelson, W. (2005): A Bibliography of Accelerated Test Plans, Part II−References, IEEE Trans. on Reliability, vol. 54, pp. 370-373.
[3] Shan-rang, Y., Ling-fang, S., Feng, G., Zhi-ming, X., Sheng-ping, W. (2006): Study on constant stress: Accelerated life tests of fouling thermal resistance. Heat Transfer-Asian Research, 35(2), pp. 110-114. doi:10.1002/htj.20105 [4] Pascual, F. (2010): Accelerated life test planning with
independent lognormal competing risks. Journal of Statistical Planning and Inference, 140(4), pp. 1089-1100. doi:10.1016/j.jspi.2009.11.003
[5] Ding, C., Yang, C., Tse, S.K. (2010): Accelerated life test sampling plans for the Weibull distribution under Type I progressive interval censoring with random removals.
[6] Tan, Y., Zhang, C., Chen, X. (2009): Bayesian analysis of incomplete data from accelerated life testing with competing failure modes. 2009 8th International Conference on Reliability, Maintainability and Safety, pp. 1268–1272. doi:10.1109/ICRM S.2009.5270049
[7] Ding, C., and Tse, S.K. (2012): Design of accelerated life test plans under progressive Type II interval censoring with random removals. Journal of Statistical Computation and Simulation, 1–14. doi:10.1080/00949655.2012.660155 [8] Guo, H., Niu, P., M ettas, A., & Ogden, D. (2012): On
planning accelerated life tests for comparing two product designs, (RAMS), 2012. doi:10.1109/RAMS.2012.6175507
[9] Balakrishnan, N. and Han, D. (2008): Optimal step -stress testing for progressively Type-I censored data from exponential distribution, Journal of Statistical Planning and Inference, vol. 138, pp. 4172-4186.
[10] Fan T.H., Wang W.L. and Balakrishnan, N. (2008): Exponential progressive step -stress life testing with link function based on Box-Cox transformation, Journal of Statistical Planning and Inference, vol. 138, pp. 2340-2354. [11] Al-M asri, A.Q. and Al-Haj Ebrahem, M . (2009): Optimum
Times for Step -Stress Cumulative Exposure M odel Using Log-Logistic Distribution with Known Scale Parameter, Austrian Journal of Statistics, vol. 38, pp. 59-66.
[12] Hassan, A. S. and Al-Ghamdi, A. S. (2009): Optimum Step Stress Accelerated Life Testing for Lomax Distribution, Journal of Applied Sciences Research, vol. 5, pp. 2153-2164.
[13] Xu, H.Y. and Fei, H. (2012): M odels Comparison for Step-Stress Accelerated Life Testing, Communications in Statistics - Theory and M ethods, vol. 41, pp. 3878-3887. [14] Bai, D. S. and Chung, S. W. (1992), “Optimal Design of
Partially Accelerated Life Tests for the Exponential Distribution under Type-I Censoring", IEEE Tran. on Reliability, Vol. 41 (3), pp 400-406. doi:10.1109/24.159807 [15] Abdel-Ghaly, A. A., Amin, Z. H., Omar, D. A. (2008),
Estimation of the Burr-XII distribution for partially accelerated life tests using censored data. M odel Assisted Statistics and Applications, 3(4), pp 317–334.
[16] Abdel-Hamid, A. H. (2009), Constant-partially accelerated life tests for Burr type-XII distribution with progressive type-II censoring. Computational Statistics & Data Analysis,
Vol. 53(7), pp 2511–2523. doi:10.1016/j.csda.2009.01.018 [17] Ismail, A. A. (2009), Optimum Constant -Stress Partially
Accelerated Life Test Plans with Type-II Censoring: The Case of Weibull Failure Distribution, International Journal of Statistics & Economics, Vol. 3(S09), pp 39-46.
[18] Cheng, Y. F. and Wang, F. K. (2012): Estimating the Burr XII Parameters in Constant-Stress Partially Accelerated Life Tests Under M ultiple Censored Data, Communications in Statistics-Simulation and Computation, Vol. 41 (9), pp 1711-1727.