STUDYING THE EFFECTS OF WATER MISTING COOLING SYSTEM ABOVE
THE FRONT SURFACE FOR PV ON THE OUTPUT POWER& EFFICIENCY
Najim Abid Jassim*, Ahmed Nafa Muter
*Assistant Professor, Mechanical Engineering Department Engineering, College, University of
Baghdad.
MSc. Student, Mechanical Engineering Department Engineering, College, University of Baghdad. KEYWORDS
:
photovoltaic, water pumping system, water spraying, water mist, solar modules.ABSTRACT
The photovoltaic cells will be ineffective forlong-time if the temperature increasemore a certain limit.Photovoltaic cells are the main part for photovoltaic water pumping systems. So as to use PV powerand increase photovoltaic system efficiency, it is very significant to save PV cell temperatureand cell reflection as low as possible.The purpose of this research project was to get data to study thespecial effects of cooling on the output power/efficiency of solar (photovoltaic) modulesusingacontinuous water misting system.The single test day consists of 6 test hours starting from 10:00 am to 3:00 pm. This present work used two solarmodules of 210W for each one and connected in parallel.The collected data was within one 18 day period in August, 2015. Measurements were taken for solar module’s surface temperature, output voltage, and output current, as wellas the ambient temperature, wind speed and solar radiation.The experimental tests show thatthe continuous mist cooling systems provided the highest solar module average power gain (i.e., increased efficiency between11.4% for two nozzle and 23% when using four nozzles) ranging between 12.25%when using two nozzles and 20.3%when using four nozzles.Therefore, when the cells power is increased by spraying water over the photovoltaic cells Thislead to increase the system and subsystem efficiency(voltage and current chargeable here in the present work ) when operatingunder different loads.
INTRODUCTION
Sometimes when using the photovoltaic for water pumping becomesinappropriateas there is often a naturalrelationship between the solar energy and the operating of pump (or charging the batteries if the system used inverter as in the present work).The disadvantage ofusing PV systems, generally,are the high installation costs and low energy transformation efficiencyof PV cells obtainable in the marketplace. Important cost consequencesso the result from over sizing a PV system since the cost ismostly dependent on the PV array area.ThereforeZaki et al., 1996show thatwhen increasing in system efficiency the size and cost of thePV arrayrequired to pump a given daily volume of waterwill be reduced.It isknow that the efficiency of PVsolar cells will reduce when the temperature of PV cells increased. Thisdecrease is resulted first of all in dropping of open circuitcell voltage, output voltage (voltage charge), output power and efficiency.The aim of this work is toexamine the effect of spraying water above the photovoltaic cells to reducing cell’s temperature as result, the efficiency of PV will be increased. Benlarbi et al.,2004 [6] showthat a maximum power point tracking (MPPT)control preparation not always lead to get amaximumefficiency for the system.Argaw et al., 1995statedthat thegood sizing of system components is necessaryfor maximum application of photovoltaic water pumping systems (PVWPS).Langridgeetal. 1996 displaythat when increasedin total system efficiency, this lead to reduce the PV array size andso the money system cost which is chieflysubjugatedvia the PVarray cost].Betka and Moussiet al., 2004finished that almost the bestconstant the efficiency of motor can be done bychangingthe inverter frequency and the modulation index.Kou et al., 1998improving thecost efficacy of PVWPS requires effectiveuse of PV energy and therefore over sizing must be avoided.Yao et al., 1994 indicated that the(MPPT) inverter and a movable frequency controller to increase theslip-up and the motor efficiencybelow low insolation conditions.They finished that a constant best value of motor efficiencycan be provenviaregulating the good inverter frequency.
Arab et al., 2004show thatthe efficiency andelectrical output will decrease by increasing operating temperaturesand cell’s reflection loss, it is wanted to keep the cell’s temperatureand cell’s reflection as low as possible.D. Baskar et al., 2014andAbdolzadeh et al., 2009demonstratedtheExperimental that the cells power is increased by spraying water above the photovoltaic cells.This can significantly increase the system and subsystem efficiency and the pump flow rate.
EXPERIMENT PROCEDURE
Test Building
displacementwater pump (mist motor) see Fig.1andFig. 2 shows thetest setup. The PV array is of polycrystalline type fixed at 33ofacing south. The power produced from the array is the system was used for cooling the two PV
of 210W (SHARP TREAD MARK) and 24V for each one which was installed on the roof of the house.The PV dimensions were 1.6𝑚 𝑙𝑒𝑛𝑔ℎ𝑡 × 0.98𝑚 𝑤𝑖𝑑𝑡ℎ for each one and installed network of four mist nozzles above the front surface of PV see Fig.6.They were connected in parallel to produce a power of 420W.This system was consist as well as of two PV 210W, storage battery, control charger and inverter.
Test Period
Eighteen days of experiments were investigates to study these effects and the experiment was done in August-2015by using a continuous water misting systemtechnology to reducing the surface temperature of the photovoltaic, and its effect on the output power/efficiency of PV and compare it with the situation when the water mist method was not used.Taking the readings of the thermocouples and other measuring instruments for every 15 minutes was from 10:00 am to 3:00 pm generally.
Test Apparatus
An experimental test Aapparatus has been built, in a way that give a flexibility in changing the parameters to be suitable for different types of the tests that is expected to be done. The components of this apparatus can be seen in Fig.2 to Fig.5. The main parts are High pressure reciprocating pump 10 to 100 bar, specialized mist nozzles (size 0.006", which can give droplets of median diameter of 5μm).In the other hand the second main parts were the two photovoltaic panel generator of 210W, storage batteries, control charger and inverter seeFig.3.to Fig.4.
Test Procedure
The main idea of this research is using a high pressure water pump (reciprocating pump) to force the water liquid through a very small orifice nozzle (special mist nozzle), with pressure that can reach100 bar, to get the water in a very small droplets (can be less than 5μm in Volume median Diameter VMD) that can be effectively evaporate to wetting (cooling) the surface that it is expose to it (flash evaporating). This process of evaporation requires energy to be completed. The energy is taken from the air in the form of heat. The result is a temperature of the front surface for the PV wills reduction. Experiments were done to investigate these effectsas Test Configuration below:
1- Module without cooling system (Connected as in Fig.1 without the water misting system).
2- Module with continuous misting system; (Using two and four mist nozzle for each experimentas shown in
Fig.7.andFig.8).
The following applies to all solar modules during testing:
A. Modules were at a steady condition (i.e., temperature, solar illumination and output loading) when testing began, after which measurements were taken every 15 minutes for five hours, from 10:00 am to 3:00 pm. B. Two different test configurations were tested at each day for each test i.e., one with used two nozzles and one with four nozzles for continuous water mist cooling.
C. Measurements of solar module output voltage and current were takenfrom control charger at every 15 minutes. D. Test data that was collected includes ambient and module surface temperatures (C°), solar radiation (w/m2),
voltage (V), and current (A).
E. Data was collected every 15minutes. Power output was calculated by multiplying output voltage by output current.
F. Testing occurred from 10:00 A.M. to 3:00 P.M. for eighteen days in August. K. Comparative analysis of the test data obtained from the different test.
Once the load and absorbed solar radiation are known, the design of the PVsystem can be carried out, including the estimation of the required PV panel'sarea and the selection of the other equipment, such as controllers and inverters.The energy delivered by a PV array, PPV, is given by Eq.(1)and the array efficiency is defined as Eq.
(2).For stand-alone systems,when the battery directly supplies a Dc load, the efficiency of the battery, Ƞbat, is
accounted for, and the actual power delivered, PPV,dc,bat, is obtained from obtained by Eq.(3)and if the battery is
used to supply power to an Ac load, the inverter efficiency is also accounted by using Eq.(4) also when the array supplies all energy to an Ac load, the actual powerdelivered, PPV,Ac, is obtained by Eq.(5).
PPV=Ich Vch(1)
Ƞ PV=
𝑃𝑃𝑉 𝐺𝐴𝑆(2)
PPV,Dc,bat= 𝑃𝑃𝑉× Ƞ𝐵𝑎𝑡(3)
PPV,Ac= 𝑃𝑃𝑉× Ƞ𝐼𝑁𝑉(5)
SOLAR ENERGY SUBSYSTEM
Solar panels are made from solar cells. The solar cell willconvertsunlight energy into electricitybyphotovoltaiceffect. Photovoltaic (PV) technology is connected to the employment ofgenerating electricity from light which is tested by William et al., 1976.Kashiwabaet al., 2003, display that the materials nowwhich utilized inphotovoltaic effect consist of monocrystalline silicon, polycrystallinesilicon, amorphous silicon, cadmium telluride, and copper indium selenite /sulfide. At times the word solar cell is meant specificallyto get energy from the sun, while the word photovoltaiccell is utilized when the light source isunknown.Thrumet al.,2000 show that the solar cells can beassembled to produce solar panels, solar modules or photovoltaicarrays see.Fig.1showed the blockdiagram of the solar subsystem utilized togenerate the power for proposed misting system. It is consisted from twosolar panel of 210, charge controller, two batteries of 160Ah, 12V and DC/ACinverter. Thepanels are located in the roof that set facing south at 33o.Fig.1and Fig.5 showed the block
diagram of the solar subsystem utilized to generate the power for proposed misting system. It is consisted from two solar panel, charge controller, batteries, and DC/AC inverter. The control charger (seeFig.3)is utilized to regulator batteries charging process and stopcharging the batteries when they exceed agreed voltage level, and re-charging when battery voltage drops below required level.The batteries (see Fig.4) are utilized to storage the energy transformed from solarpanels to be used when there is no sun light. The batteryshould stay alivemany charging and discharged cycles. This is one ofheadneed of the batteries which is used in solar systems. Each solarpanel can provideabout 36.6 V DC and 7Ah (Direct Current) which is connected in parallel.However, the water compressor used 220V AC; therefore a DC/AC voltage inverter is used.The performance of utilized the solar panel in the misting is proved.The performance includes measuring open circuit voltage (VOC), panel output
voltage (VCH) and current (ICH)for different times. These measurements were done at times from 10:00 AM to
3:00 PM.
RESULTS AND DISCUSSION
Comparison for the Average Surface Temperature(AST)before and after Mist Water Sprays over the Frontsurface of PV.
Figure.9 shows the average weighted surface temperature before and after mist at the time from 10:00 AM to 3:00 PM. The average surface temperature for the module without mist over the PV was 62.97oC while the average
surface temperature for continuous mist cooling system for module was 59.23oC when using two nozzles(flow
rate 0.091 LPM) and was 52.29oC when using four nozzles(flow rate 0.182 LPM). The reduced in the average
surface temperature was 3.74oC which is mean 5.94% reduced the average surface temperature when using two
nozzles and the reduction was 10.67oC which mean 17.1% reduced the average surface temperature when using
four nozzles.
Comparison for the AverageOpen Voltage Circuit(VOC) before and after Mist Water Sprays over the front Surface of PV.
The open circuit voltage (Voc) decreases significantly with increasing temperature. This results in a reduction of
electrical power output for mono- and multi-crystalline silicon solar modules, respectively (which are used in most power applications) while the short circuit current increases slightly with increasing temperature. Fig.10
shows the average open voltage circuit before and after mist at the time from 10:00 AM to 3:00 PM. The average open voltage circuit for the module without mist over the PV was 30.41volt while the average open voltage circuit for continuous mist cooling system for module was 31.4volt when using two nozzles(flow rate 0.091 LPM) and was 32.27volt when using four nozzles(flow rate 0.182 LPM). The increase in the Voc was 1volt which is mean
increased 3.3% compared without mist when using two nozzles and the increase was 1.86volt which mean that 6.11% increased the Voc compared without mist when using four nozzles.
Comparison for the Average Output Voltage before and after Mist Water Sprays over the Front Surface of PV.
Figure.11 shows the average voltage output (Vop) before and after mist at the time from 10:00 AM to 3:00 PM.
Comparison for the Average OutputCurrent before and after Mist Water Sprays over the FrontSurface of PV.
Figure.12shows the average output current (Ich) before and after mist at the time from 10:00 AM to 3:00 PM. The
average current for the module without mist over the PV was 8.33A.while the average current for continuous mist cooling system for module was 9.27A when using two nozzles(flow rate 0.091 LPM) and was 9.85A when using four nozzles(flow rate 0.182 LPM). The increase in the Ich was 0.94A which is mean increased 11.3% compared
without mist when using two nozzles and the increase was 1.52A which mean that 18.25% increase in the Ich
compared without mist when using four nozzles.
Comparison for the average output power(AOP) before and after Mist Water Sprays over the front of Photovoltaic Cells.
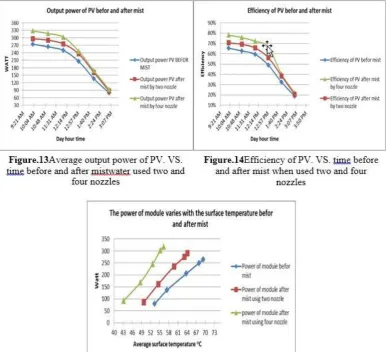
Figure.13 shows the average power output (Pout) for the module. The average power output was found through
separately taking the average output voltage and the average output current values and multiplying them together for the module. The average output power for the module without mist over the PV was 201watt while the average output power for continuous mist cooling system for module was 225.63 watt when using two nozzles(flow rate 0.091 LPM) and was 241.82watt when using four nozzles(flow rate 0.182 LPM). The increase in the AOP was 24.63watt which is mean increased 12.25% compared without mist when using two nozzles and the increase was 40.8watt which mean that 20.3% increase in the AOP compared without mist when using four nozzles. Fig.15
shows the module average power output for the hours of 10:00am to 3:00pm over the ten days of testing in comparison with its average weighted surface temperature. As seen from the trend line on the graph, the module power output vs. module surface temperature displays a nearly linear relationship when solar radiation levels are constant.
Comparison for the average outputefficiency before and after Mist Water Sprays over the front of Photovoltaic Cells.
We are well known that the efficiency of photovoltaic (PV) solar modules decreases with an increase in temperature. The module manufacturer generally specifies a temperature degradation coefficient and a maximum operating temperature for the module and the cost of photovoltaic installations is mostly dependent on the PV array area. Since efficiency and electrical yield decrease with increased operating temperatures, it is preferable to keep the modules’ temperature as low as possible. Due to the water spray and additional cooling by mist, the modules’ operating temperatures were meaningfully reduced in comparison with a module without water spray, which was measured simultaneously. Fig.14 shows the average output efficiency before and after mist at the time from 10:00 AM to 3:00 PM. The average efficiency for the module without mist over the PV was6.23% (47.95%from the efficiency specifications 13%) while the average efficiency for continuous mist cooling system for module was6.95% (53.45% from the efficiency specifications 13%)when using two nozzles and was7.67% (59% from the efficiency specifications 13%)when using four nozzles. The increase in the efficiency was 0.72% which is mean increased 11.55% compared without mist when using two nozzles and the increase was 1.44% which mean that 23% increase in the efficiency compared without mist when using four nozzles.
COMPARISON OF THE PRESENT WORK RESULTS WITH A PREVIUOS WORK
RESULTS.
Comparing the results of the present work with results presented in a previous works can be explained in the following points:-
3.34%) and finally a net gain of efficiency from18.7to 20% can be achieved even when accounting for power needed to run the pump,while in the present work tests the performance of 420 W(two PV 24volt connected in parallel) decreases average cell temperatures from 62.9.13 to 52.3°C as shown in table1.when used four nozzle and also increased in voltage 6.15%,increased in current about 18.2%,increased in power by 20.3% and increased the efficiency by23.1%. We can see the differences in cell temperatures which leads to the results differences. The differences in cell temperatures due to the temperature of air in India different from Baghdad which exceeds 50oC
and in this research, the water spraying unit consists of the solenoid valve and water flow pipe which is open when the cell temperature exceeds the specific request while in the present work using a continuous misting system and also we use four nozzle over the photovoltaic cell but in this work,he did not indication the number of nozzle.Abdolzadeh et al,(2008), Experimental results show that the cells power is increased due to spraying water over the photovoltaic cells. This study examines the performance of a 225W (two PV cells 45x2 of 13.5% efficiency) photovoltaic water pumping system with water spray over the photovoltaic cells. It is found that spraying water over the photovoltaic cells strongly improves the system. After mist over the PV, figure 5.64 to 5.68 show that increases in the average PV cell efficiency from 9.26 to12.35% which mean that the efficiency was increased by 33.4% compared when no spray over PV and also rises the mean power by20.7%, increase the voltage by 11.7% and increased the current by 2.5%.Compar this result with the present work, the results from
table1.when used four nozzle show that increased in voltage 6.15%,increased in current about 18.2%,increased in power by 20.3% and increased the efficiency by23.1%.The differences in cell temperatures which leads to the results differences.The differences incell temperatures due to the air temperature. The air temperature in Iran was 35oC while in Baghdad exceeds 50oC.Also in present work used PV of 420W while in this research used PV of
225 W and we use four nozzle over the photovoltaic cell but in this work ,he did not indication the number of nozzle therefor the result semi diverge.Adam Boehm et al.(2012), the research project in Summer, 2012.The Experimental results show that The continuous mist cooling systems provided the highest solar module average power gain (i.e., increased efficiency) ranging between 22.7 and 23.8%while the present work the mist system cooling provided average power gain ranging between 12.3%(used two nozzle) and 20.3%(used four nozzle).
CONCLUSIONS
1) From the experimental work we can confirm that the continuous water mist cooling system can reduce the average surfacetemperature of the PV from 3.74oC(5.94% reduced the AST.) when using two
nozzles(flow rate 0.091 LPM) to10.67oC(10.67oC reduced the AST) when using four nozzles(flow rate
0.182 LPM).
2) Increase cooling effect for the surfacetemperature of the PVby increasing number of nozzles and also produce more cooling effect by using very high pressure(increase the operating pressure above70 bar). 3) The experimental tests show that the continuous mist cooling systems provided the highest solar module
average power gain (i.e., increased efficiency between11.4% for two nozzle and 23% when using four nozzles) ranging between 12.25%when using two nozzles and 20.3%when using four nozzles.
4) The efficiency of PV increased 11.55% compared without mist cooling when using two nozzles and increased 23% compared without mist cooling when using four nozzles.
REFERENCES
1. Adam, Summer Solar Undergraduate Research Program, Final StudyReport,2011.
2. Arab A, Chenlo F, Benghanem M. Loss-of-load probability of photovoltaic water pumping systems. Solar Energy,76:713–23, 2004.
3. Argaw N. Optimal load matching in photovoltaic water pumps coupled with DC/AC inverter. International Journal of Solar Energy;18:41–52, 1995.
4. Benlarbi K, Mokrani L, Nait-Said M. A fuzzy global efficiency optimization of a photovoltaic water pumping system. Solar Energy;77:203–16,2004.
5. Betka A, Moussi A. Performance optimization of a photovoltaic induction motor pumping system. Renewable Energy;29:2167–81,2004.
6. D. Baskar,Efficiency Improvement on Photovoltaic Water Pumping System by Automatic Water Spraying over Photovoltaic Cells,Middle-East Journal of Scientific Research 19 (8): 1127-1131, 2014.
7. Kou Q, Klein S, Beckman W. A method for estimating the long term performance of direct coupled PV pumping systems. Solar Energy;64:33–40,1998 .
9. LangridgeW, LawranceW, Wichert B. Development of a photovoltaic pumping system using a brushless DC motor and helical rotor pump. Solar Energy; 56:151–60, 1996.
10. Yao Y, Baustamente P, Ramshaw RS. Improvement of induction motor drive systems supplied by photovoltaic array with frequency control.IEEE Transactions of Energy Conversion8(1):47–52,1994. 11. Zaki, A. and M. Eskander,Matching ofphotovoltaic motor-pump systems for maximum efficiency
operation. Renewable Energy, 7(3): 279-88,1996.
NOMENCLATURE
PPV=the power delivered by a PV array,W(watt)
Ich= the currentdelivered by a PV array (current charger), Amber.
Vch=the voltage delivered by a PV array(voltage charger),Volt.
ȠPV=the efficiency of PV, dimensionless.
G=the Solar radiation, W/M2.
AS=the PV array area, M.
PPV,Dc,bat= the actual energy deliveredwhen the battery directly supplies a Dc load, W (watt). Ƞ𝐵𝑎𝑡=the efficiency of the battery, dimensionless.
PPV,Ac=the actual energydelivered when the PV supplies all energy to an Ac load, W(watt). ȠINV=the inverter efficiency, dimensionless.
TABLES AND FIGURES.
Table1.The final conclusions when use mist water over the front of PV in the present work.
Cooling methods Average module temp.( ̊C) Average voltage open circuit (v) Average voltage output(v) Average output current(A) Average power output (w) Average efficiency (%) Continuous mist cooling
1) 62.9with no mist. 2)59.23for 2 nozzles. 3)52.29for 4 nozzles.
1) 30.4 for no mist.
2)31.4for 2 nozzles.
3)32.3 for 4 nozzles.
1) 24.1 for no mist.
2)24.34for 2 nozzles. 3)24.55for 4 nozzles.
1) 8.33 for no mist.
2)9.27 for 2 nozzles. 3) 9.85 for 4 nozzles.
1) 201 for no mist.
2)225.63for2 2nozzles
3)241.82 for 4 nozzles.
1)
6.23%forno mist.
2)6.95%for 2 nozzles. 3)7.67%for 4 nozzles.
Figure.2 Filters (5 microns), water tank and high pressure mist motor
Figure.5 Solar energy powered misting system block diagram. solid line is DC powered, dashed line is AC powered.
Figure.6PV panel and network of mist nozzles
Figure.8Two nozzles were opened and two nozzles were closed tocool a PV
Figure.9Averagesurface temperature of PV. VS. time before and after mistwater when used two and four
nozzles.
Figure.10Average voltage open circuit of PV.VStime before and after mist waterwhen used two and four
nozzles.
Figure.11Average output voltage of PV.VS time before and after mistwater when used two and four