ISSN: 2456-9909 (Online)
International Journal of Research in AYUSH and
Pharmaceutical Sciences
Website: http://ijraps.in 352
Research Article
STABILITY INDICATING RP-HPLC METHOD DEVELOPMENT AND VALIDATION FOR
SIMULTANEOUS ESTIMATION OF METFORMIN AND GLIPIZIDE
A. Lakshmana Rao*, M. Malathi Priyanka
Department of Pharmaceutical Analysis, V. V. Institute of Pharmaceutical Sciences, Gudlavalleru, Andhra Pradesh, India.
Keywords: Metformin,
Glipizide, HPLC, Validation.
ABSTRACT
A novel, precise and accurate stability indicating RP-HPLC method was developed and validated for the simultaneous estimation of Metformin and Glipizide in combined pharmaceutical dosage form. Chromatographic separation was achieved on Microsorb-MV C18 column (250 × 4.6 mm, 5 μm) with UV detection at 257 nm. The mobile phase consists of acetate buffer (pH 4.0) and acetonitrile in
the ratio of 60:40 v/v and at a flow rate of 1.0 mL/min. The method was linear
over the concentration range of 60-140 μg/mL for Metformin and 10-50 μg/mL for Glipizide. The retention times for Metformin and Glipizide were found to be 2.434 min and 5.710 min respectively. The mean percentage recoveries of Metformin and Glipizide were found to be 100.42% and 100.39% respectively. The method was validated and was successfully employed for the routine quantitative analysis of pharmaceutical formulations containing Metformin and Glipizide in combined pharmaceutical formulation.
INTRODUCTION
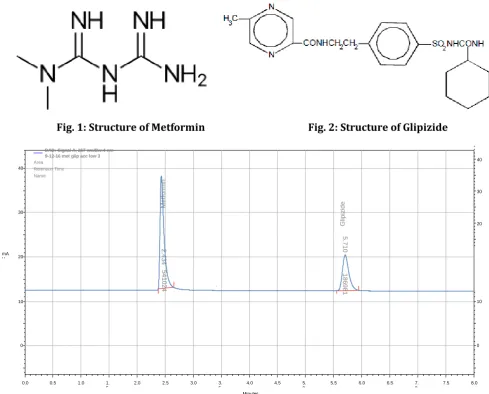
Metformin (Fig. 1) is biguanide anti hyperglycemic agent used for treating non-insulin-dependent
diabetes mellitus[1]. Chemically it is
1,1-dimethylbiguanide. Metformin decreases hepatic glucose production, decreases intestinal absorption of glucose and improves insulin sensitivity by increasing peripheral glucose uptake and utilization[2,3].
Glipizide (Fig. 2) is a second-generation sulfonyl-urea, is used to lower blood glucose in patients with
diabetes mellitus type II[4]. Chemically it is
N-[2-(4-[(cyclohexylcarbamoyl) amino] sulfonyl} phenyl) ethyl]-5-methylpyrazine-2-carboxamide. Glipizide bind to ATP-sensitive potassium-channel receptors on the pancreatic cell surface, reducing potassium conductance and causing depolarization of the membrane. Depolarization stimulates calcium ion influx through voltage-sensitive calcium channels, raising intracellular concentrations of calcium ions, which induces the secretion, or exocytosis, of insulin[5,6].
Literature survey revealed that few HPLC
methods[7-11] were reported for simultaneous
estimation of Metformin and Glipizide in combined pharmaceutical dosage form. But no stability indicating HPLC method was reported. Hence the objective of this method is to develop and validate a simple, rapid, precise and accurate stability indicating RP-HPLC method in accordance with ICH
guidelines[12,13] for the simultaneous estimation of
Metformin and Glipizide in combined
pharmaceutical dosage form.
MATERIALSANDMETHODS Materials
Metformin and Glipizide pure drugs were obtained
from Yarrow Chemicals, Mumbai, India.
Combination of Metformin and Glipizide tablets (Glynase-MF Tablets) were obtained from local pharmacy store. Acetonitrile, glacial acetic acid, triethylamine and distilled water were obtained from Rankem Chemicals Ltd., Mumbai, India.
Instrumentation
20 µL sample loop. A 20 µL Hamilton syringe was used for injecting the samples. Data was analyzed by using Open Lab software. A double-beam Schimadzu UV-1800 UV-Visible spectrophotometer was used for measuring absorbance for Metformin and Glipizide solutions. Degassing of the mobile phase was done by using an ultrasonic bath sonicator. A Shimadzu balance was used for weighing the materials.
Mobile phase
A mobile phase consisting of mixture of acetate buffer (pH 4.0) and acetonitrile in the ratio of 60:40 v/v was prepared.
Preparation of standard stock and working solutions
Standard stock solutions of Metformin and Glipizide were prepared by dissolving 50 mg of Metformin and Glipizide each dissolved in sufficient mobile phase. After that filtered the solution using 0.45 micron filter paper and sonicated for 5 min and dilute to 50 mL with mobile phase. 1 mL from the resulting solution was transferred to 100 mL volumetric flask and diluted with mobile phase to obtain 100 µg/mL. Further dilutions of Metformin and Glipizide were made from stock solution using mobile phase.
Preparation of sample stock and working solutions
20 tablets (each tablet contains 500 mg of Metformin and 5 mg of Glipizide) were weighed and taken into a mortar and crushed to fine powder and uniformly mixed. Tablet stock solutions of Metformin and Glipizide were prepared by dissolving weight equivalent to 500 mg of Metformin and 5 mg of Glipizide and dissolved in sufficient mobile phase. After that filtered the solution using 0.45 μ syringe filter and sonicated for 5 min and dilute to 100 mL with mobile phase. Further dilutions are prepared by adding 1 mL of stock solution to 10 mL of mobile phase.
METHOD DEVELOPMENT
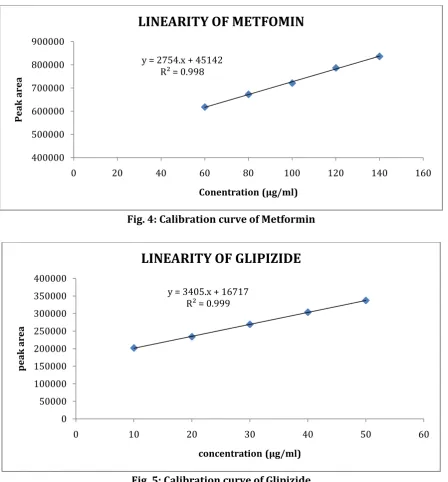
Various trails were performed by using different mobile phases and based on peak parameters the chromatographic conditions (Table 1) were optimized and optimize chromatogram was shown in Fig. 3.
METHOD VALIDATION
System suitability parameters
The system suitability parameters were determined by preparing standard solutions of Metformin (10
determined. All the system suitability parameters
were within the range and satisfactory as per ICH guidelines.
Specificity
Specificity is the parameter used to check the
interference in the optimized method. We should not find interfering peaks in blank, placebo, standard and sample at retention times of these drugs in this method. So this method was said to be specific.
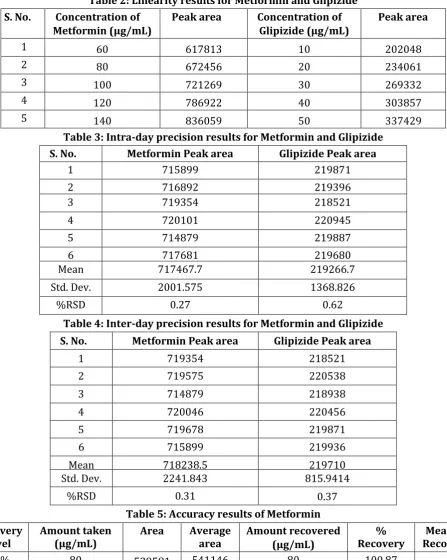
Linearity
Five linear concentrations of Metformin (60-140 µg/mL) and Glipizide (10-50 µg/mL) are prepared and injected. The results were furnished in Table 2 and calibration curves were shown in Fig. 4 & 5.
Precision
Precision of method was studied by performing intra-day and inter-day precision. Intra-day precision (Table 3) and inter-day precision (Table 4) was studied by injecting the 6 replicates of standard solution in a single day and six days. Calculate the %RSD and it should not be more than 2.0.
Accuracy
The accuracy of the method was established by calculating percentage recovery of Metformin and Glipizide by the method of addition. Known amount of Metformin and Glipizide at 80%, 100% and 120% was added to a prequantified sample solution. The recovery studies (Table 5 & 6) were carried out in the tablet in triplicate each in the presence of placebo. The mean percentage recovery at each level was not less than 98% and not more than 102%.
Sensitivity
Limit of detection (LOD) was calculated by standard deviation method. Limit of quantitation (LOQ) was calculated by standard deviation method.
Degradation studies Acid degradation studies
To 1mL of stock solution of Metformin and Glipizide, 1 mL of 2N hydrochloric acid was added
and refluxed for 30 mins at 600C. The resultant
solution was diluted to obtain 140 µg/mL & 50 µg/mL solution and 20 µL solutions were injected into the system and the chromatograms were recorded to assess the stability of sample.
Alkali egradation studies
IJRAPS, 2019:3(7):352-358
Website: http://ijraps.in 354
system and the chromatograms were recorded to assess the stability of sample.
Oxidative degradation studies
To 1 mL of stock solution of Metformin and Glipizide, 1 mL of 20% hydrogen peroxide was added separately. The solutions were kept for 30
mins at 600C. For HPLC study the resultant solution
was diluted to obtain 500 µg/mL & 50 µg/mL solution and 20 µL were injected into the system and the chromatograms were recorded to assess the stability of sample.
Thermal degradation studies
The standard drug solution was placed in oven at 105°C for 6 hrs to study thermal degradation. For HPLC study the resultant solution was diluted to
500 µg/mL & 50 µg/mL solution and 20 µL were injected into the system and the chromatograms
were recorded to assess the stability of the sample.
Neutral degradation studies
Stress testing under neutral conditions was studied by refluxing the drug in water for 6 hours at a temperature of 60ºC. For HPLC study the resultant solution was diluted to 500 µg/mL & 50 µg/mL solution and 20 µL were injected into the system and the chromatograms were recorded to assess
the stability of the sample.
Degradation studies results of Metformin and Glipizide were tabulated in Table 7 & 8.
Fig. 1: Structure of Metformin Fig. 2: Structure of Glipizide
Fig. 3: Optimized chromatogram of Metformin and Glipizide
Minutes
0.0 0.5 1.0 1.
5
2.0 2.5 3.0 3.
5
4.0 4.5 5.
0
5.5 6.0 6.5 7.
0
7.5 8.0
mA U
0 10 20 30 40
0 10 20 30 40
541024
2.43
4
186981
5.71
0
Metformin
DAD: Signal A, 257 nm/Bw:4 nm 9-12-16 met glip acc low 3
Area Retention Time Name
Fig. 4: Calibration curve of Metformin
Fig. 5: Calibration curve of Glipizide
Table 1: Optimized chromatographic conditions
Mobile phase Acetate buffer (pH 4.0):acetonitrile, 60:40 v/v
Flow rate 1 mL/min
Column Microsorb-MV C18 (250 x 4.6 mm, 5 µm)
Detector wave length 257 nm
Column temperature 25°C
Injection volume 20 µL
Run time 8 min
Diluent Mobile phase
y = 2754.x + 45142 R² = 0.998
400000 500000 600000 700000 800000 900000
0 20 40 60 80 100 120 140 160
Pea
k
ar
ea
Conentration (µg/ml)
LINEARITY OF METFOMIN
y = 3405.x + 16717 R² = 0.999
0 50000 100000 150000 200000 250000 300000 350000 400000
0 10 20 30 40 50 60
p
ea
k
ar
ea
concentration (µg/ml)
IJRAPS, 2019:3(7):352-358
Website: http://ijraps.in 356
Table 2: Linearity results for Metformin and Glipizide
S. No. Concentration of
Metformin (µg/mL)
Peak area Concentration of
Glipizide (µg/mL)
Peak area
1 60 617813 10 202048
2 80 672456 20 234061
3 100 721269 30 269332
4 120 786922 40 303857
5 140 836059 50 337429
Table 3: Intra-day precision results for Metformin and Glipizide
S. No. Metformin Peak area Glipizide Peak area
1 715899 219871
2 716892 219396
3 719354 218521
4 720101 220945
5 714879 219887
6 717681 219680
Mean 717467.7 219266.7
Std. Dev. 2001.575 1368.826
%RSD 0.27 0.62
Table 4: Inter-day precision results for Metformin and Glipizide
S. No. Metformin Peak area Glipizide Peak area
1 719354 218521
2 719575 220538
3 714879 218938
4 720046 220456
5 719678 219871
6 715899 219936
Mean 718238.5 219710
Std. Dev. 2241.843 815.9414
%RSD 0.31 0.37
Table 5: Accuracy results of Metformin Recovery
level Amount taken (µg/mL) Area Average area Amount recovered (µg/mL)
%
Recovery Recovery Mean %
80% 80 539581 541146 80 100.87
100.42
80 542834
80 541024
100% 100 596575 586936 100 100.22
100 564879
100 599354
120% 120 651605 654468 120 100.17
120 657164
Table 6: Accuracy results of Glipizide
Table 7: Degradation data of Metformin
S. No. Degradation
condition Peak area % Assay degraded % Amount
1 Acid 1383287 95.00 5.00
2 Alkali 1087654 98.91 1.09
3 Oxidative 1035678 97.16 2.84
4 Thermal 1399673 96.12 3.88
5 Neutral 1414765 97.85 2.15
Table 8: Degradation data of Glipizide
S. No. Degradation
condition Peak area % Assay degraded %Amount
1 Acid 283176 95.58 4.42
2 Alkali 263176 96.12 3.88
3 Oxidative 250591 95.98 4.02
4 Thermal 321386 98.58 1.42
5 Neutral 324896 97.22 2.78
RESULTS&DISCUSSION
A stability indicating RP-HPLC method was developed and validated for the simultaneous estimation of Metformin and Glipizide by using mobile phase consisting of acetate buffer (pH 4.0) and acetonitrile in the ratio of 60:40 v/v. The retention times for Metformin and Glipizide were found to be 2.434 min and 5.710 min respectively. The proposed method was validated as per ICH guidelines. The theoretical plates for Metformin and Glipizide were found to be 10205 and 11067 respectively, which indicates the efficient performance of the column. Linearity range was found to be 60-140 µg/mL for Metformin and 10-50 µg/mL for Glipizide. The %RSD values for intra-day precision values of Metformin and Glipizide were found to be 0.27 and 0.62 respectively. The %RSD
precise. The mean percentage recoveries of Metformin and Glipizide were found to be 100.42% and 100.39% respectively and the method is found to be accurate. LOD for Metformin and Glipizide were found to be 0.287 µg/mL and 0.065 µg/mL respectively. LOQ for Metformin and Glipizide were found to be 0.870 µg/mL and 0.196 µg/mL respectively. Degradation studies were carried out in acid, alkali, oxidative, thermal and neutral stressed conditions. The results revealed that both the drugs are stable in described conditions. Thus it is evident that the described method can be adopted for routine estimation of Metformin and Glipizide in combined pharmaceutical dosage form.
CONCLUSION
The present method was proposed for the simultaneous estimation of Metformin and Glipizide
Recovery
level Amount taken (µg/mL) Area Average area recovered Amount (µg/mL)
%Recovery Mean%
Recovery
80% 80 186679 187023 20 99.58
100.39
80 187409
80 186981
100% 100 201598 201314 30 100.80
100 200949
100 201395
120% 120 217865 218786 40 99.50
120 219340
IJRAPS, 2019:3(7):352-358
Website: http://ijraps.in 358
decreased, so the method developed was simple and economical that can be applied in regular quality control tests in pharmaceutical industries.
REFERENCES
1. G. Rena, D.G. Hardie and E.R. Pearson. The
mechanisms of action of Metformin.
Diabetologia. 2017; 60(9): 1577-1585.
2. H. Nasri and M. Rafieian Kopaei. Metformin:
current knowledge. Journal of Research in Medical Sciences. 2014; 19(7): 658-664.
3. G. Rena, E.R. Pearson and K. Sakamoto. Molecular
mechanism of action of Metformin. Diabetologia. 2013; 56(9): 1898-1906.
4. D. Sola, L. Rossi, G.P. Schianca, P. Maffioli, M.
Bigliocca, R. Mella, F. Corliano, G.P. Fra, E. Bartoli and G. Derosa. Sulfonyl ureas and their use in clinical practice. Archives of Medical Science. 2015; 11(4): 840-848.
5. A.B. Olokoba, O.A Obateru and L.B. Olokoba. Type
2 diabetes mellitus: a review of current trends. Oman Medical Journal. 2012; 27(4): 269-273.
6. A. Melander and E. Wahlin Boll. Clinical
pharmacology of Glipizide. The American Journal of Medicine. 1983; 75(5B): 41-45.
7. B.B. Snehal and B.J. Prerana. Development and
validation of RP-HPLC method for simultaneous estimation of Metformin hydrochloride and Glipizide in bulk and pharmaceutical dosage form. Journal of Drug Delivery and Therapeutics. 2019; 9(3-S): 146-155.
8. D. Sri Lakshmi, T. Jane Jacob, D. Srinivas and D.
Satyanarayana. Simultaneous estimation of Metformin and Glipizide by RP-HPLC and its validation. World Journal of Pharmacy and Pharmaceutical Sciences. 2015; 4(9): 740-750.
9. D. Triveni, G.V.S. Kumar, S.B. Puranik, N. Sateesh
Kumar and K.A. Sridhar. Development and validation of RP-HPLC method for simultaneous estimation of Glipizide and Metformin in bulk drugs and tablet dosage form. International Research Journal of Pharmacy. 2012; 3(9): 260-263.
10. M. Surajit and P. Saroj Kumar. Development of
RP-HPLC method and validation for the estimation of Metformin hydrochloride and Glipizide in combined dosage form. Journal of Chemical and Pharmaceutical Research. 2018; 10(3): 142-147.
11. A. Madhukar, A. Kiran Kumar and M. Praveen
Kumar, Simultaneous method development and validation for the estimation of Metformin hydrochloride and Glipizide in bulk and tablet dosage form by RP-HPLC. Journal of Scientific Research in Pharmacy. 2015; 4(2): 69-73.
12. ICH Harmonised Tripartite Guideline. Validation
of analytical procedures: Text and methodology,
Q2(R1), International Conference on
Harmonization, Geneva. 2005; 1-13.
13. ICH Harmonised Tripartite Guideline. Stability
Testing of New Drug Substances and Products,
Q1A(R2), International Conference on
Harmonization, Geneva. 2003; 1-18.
Cite this article as:
Thakur Shalini, Shukla Umesh. Evaluation of Meditation to Modify Human Attitude. International Journal of Research in AYUSH and Pharmaceutical Sciences, 2019;3(7):352-358.
Source of support: Nil, Conflict of interest: None Declared
*Address for correspondence Dr. A. Lakshmana Rao
Professor and Principal,
V. V. Institute of Pharmaceutical Sciences, Gudlavalleru, Andhra Pradesh, India.
Email: [email protected]