Analysis of graded observations of trainee
teaching practice (2011-2012)
_______________________________
Contents
______________________________________________________________
University based full-time Generic cohort 3
Commentary 4
University based full-time Skills for Life cohort 5
Commentary 6
University based part-time Generic cohort 7
Commentary 7
University based part-time Skills for Life cohort 8
Commentary 8
University of Bolton Partnership cohorts 9
Commentary 10
University full-time cohorts (SfL and Generic) – grading by ethnicity 12
Commentary 13
University part-time cohorts (SfL and Generic) – grading by ethnicity 15
University of Bolton PGDE/PDE: Graded observations (2011-12)
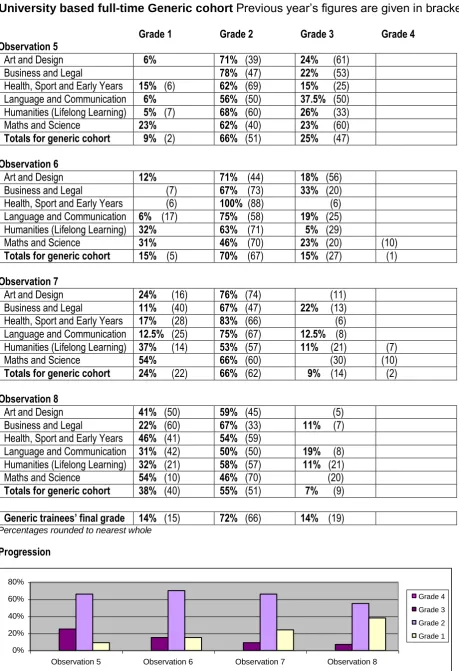
University based full-time Generic cohort Previous year’s figures are given in brackets
Grade 1 Grade 2 Grade 3 Grade 4 Observation 5
Art and Design 6% 71% (39) 24% (61) Business and Legal 78% (47) 22% (53) Health, Sport and Early Years 15% (6) 62% (69) 15% (25) Language and Communication 6% 56% (50) 37.5% (50) Humanities (Lifelong Learning) 5% (7) 68% (60) 26% (33) Maths and Science 23% 62% (40) 23% (60) Totals for generic cohort 9% (2) 66% (51) 25% (47)
Observation 6
Art and Design 12% 71% (44) 18% (56) Business and Legal (7) 67% (73) 33% (20) Health, Sport and Early Years (6) 100% (88) (6) Language and Communication 6% (17) 75% (58) 19% (25) Humanities (Lifelong Learning) 32% 63% (71) 5% (29)
Maths and Science 31% 46% (70) 23% (20) (10) Totals for generic cohort 15% (5) 70% (67) 15% (27) (1)
Observation 7
Art and Design 24% (16) 76% (74) (11) Business and Legal 11% (40) 67% (47) 22% (13) Health, Sport and Early Years 17% (28) 83% (66) (6) Language and Communication 12.5% (25) 75% (67) 12.5% (8)
Humanities (Lifelong Learning) 37% (14) 53% (57) 11% (21) (7) Maths and Science 54% 66% (60) (30) (10) Totals for generic cohort 24% (22) 66% (62) 9% (14) (2)
Observation 8
Art and Design 41% (50) 59% (45) (5) Business and Legal 22% (60) 67% (33) 11% (7) Health, Sport and Early Years 46% (41) 54% (59)
Language and Communication 31% (42) 50% (50) 19% (8) Humanities (Lifelong Learning) 32% (21) 58% (57) 11% (21) Maths and Science 54% (10) 46% (70) (20) Totals for generic cohort 38% (40) 55% (51) 7% (9)
Generic trainees’ final grade 14% (15) 72% (66) 14% (19) Percentages rounded to nearest whole
Progression
0% 20% 40% 60% 80%
Observation 5 Observation 6 Observation 7 Observation 8
Grade 4
Grade 3
Grade 2
Grade 1
Commentary
1. Once again, this year’s analysis of the graded observation results for the generic cohort as a whole clearly demonstrates trainee progression from observation 5 to observation 8. The percent of observations assessed at Grade 3 reduces from 25% at observation 5 to 7% at observation 8, and the percent of observations assessed at Grade 1 increases from 9% at observation 5 to 38% at observation 8. As noted in the previous year, observations graded 2 peak at observation 6; however for each of the graded observations Grade 2 is the grade most often awarded.
2. Whilst the pattern of progression noted above is to a large extent in direction similar for each curriculum group i.e. each group progresses in a positive direction overall, as might be expected, the results do reveal differences between groups. However differences between groups highlighted in the previous year’s analysis are now much less marked. Last year the Maths and Science group performed the least well; this is no longer the case, with trainees from this group achieving overall better than their peers. Last year, trainees from the Lifelong Learning group also achieved less well. There is no longer a Lifelong Learning group. The Humanities group, which is likely to include some of those trainees who would have previously been in the Lifelong Learning group, has achieved considerably better. It is likely that the stark differences noted last year have diminished in part as a result of the additional and enhanced training made available to all assessors last year, with a filmed observation accessible on Moodle. The enhanced moderation of graded observations that was undertaken is also likely to have played a part.
It should also be noted that group numbers in the generic cohort for 2011-12 varied considerably, with the Humanities group more than double in size in relation to the Business and Legal group (19 and 9 trainees respectively).
3. Last year, a small number of Grade 4s were recorded (for three trainees). This year there are no Grade 4s.
University of Bolton PGDE/PDE: Graded observations (2011-12)
University based full-time Skills for Life cohort (Literacy, Numeracy and ESOL) Previous year’s figures are given in brackets
Grade 1 Grade 2 Grade 3 Grade 4 Observation 5
Literacy 1 12% (13) 59% (47) 29% (40) Literacy 2 5% (18) 75% (65) 20% (18)
Numeracy 75% (83) 25% (17)
ESOL* 50% (20) 50% (40) (40) Totals for SfL cohort 9% (12) 68% (60) 23% (28)
Observation 6
Literacy 1 29% (13) 41% (67) 29% (20) Literacy 2 15% (6) 75% (75) 10% (19) Numeracy 6% 69% (59) 25% (41)
ESOL* 75% (13) 25% (67) 20%
Totals for SfL cohort 21% (8) 60% (67) 19% (25)
Observation 7
Literacy 1 18% (36) 65% (64) 18% Literacy 2 25% (31) 60% (69) 15% Numeracy 25% (44) 56% (44) 19% (11) ESOL* 75% (40) 25% (60)
Totals for SfL cohort 26% (38) 58% (59) 16% (3)
Observation 8
Literacy 1 41% (60) 53% (27) 6% (13) Literacy 2 53% (63) 42% (38) 5% Numeracy 44% (28) 56% (56) (17) ESOL* 100% (53) (40) (7) Totals for SfL cohort 49% (50) 47% (41) 4% (9)
SfL trainees’ final grade 18% (27) 73% (62) 9% (11)
Percentages rounded to nearest whole
*Note: ESOL data has been included, but trainee numbers are too small to have statistical significance Progression
0% 10% 20% 30% 40% 50% 60% 70% 80%
Observation 5 Observation 6 Observation 7 Observation 8
Grade 4
Grade 3
Grade 2
Grade 1
Commentary
1. The very small number of ESOL trainees means that statistics relating to that group cannot be viewed as statistically significant.
2. Analysis of the graded observation results for the SfL cohort as a whole clearly demonstrates trainee progression from observation 5 to observation 8. Unlike in the previous year (2010-11), where at observation 6, the overall number of trainees awarded a Grade 1 had decreased very slightly from observation 5, and by observation 8, the overall number of trainees achieving at Grade 3 had increased a little from the previous observation, there is now a more uniform progression in a positive direction, from observation 5 through to observation 8.
3. The pattern of progression observed is to a large extent comparable for each SfL curriculum group i.e. each group progresses in a positive direction.
4. Although the results do reveal some slight differences between groups, this is much less marked than in 2010-11, with trainees in the numeracy group now achieving
comparable grades to the other cohorts. This is likely to have been influenced in part by the additional and enhanced training made available to all assessors last year, and including a filmed observation accessible on Moodle, and also to the enhanced moderation of graded observations that was undertaken.
University of Bolton PGDE/PDE: Graded observations (2011-12)
University based part-time Generic cohort
Grade 1 Grade 2 Grade 3 Grade 4 Observation 5
Generic part-time 50% 50%
Observation 6
Generic part-time 73% 27%
Observation 7
Generic part-time 36% 55% 9%
Observation 8
Generic part-time 42% 58%
Part-time generic trainees’
final grade 25% 67% 8% Percentages rounded to nearest whole
Progression
0% 20% 40% 60% 80%
Observation 5 Observation 6 Observation 7 Observation 8
Grade 4
Grade 3
Grade 2
Grade 1
Figure 3 Progressive teaching observation grades achieved by University based part-time generic trainees (2011-12)
Commentary
1. This year analysis has included examination of the graded observation results for the University based part-time generic cohort; however it must be noted that trainee numbers are very small and percentages must be interpreted accordingly. As a whole, analysis clearly demonstrates trainee progression from observation 5 to observation 8. The
percent of observations assessed at Grade 3 reduces from 50% at observation 5 to none at observation 8, and the percent of observations assessed at Grade 1 increases from none at observation 5 to 42% at observation 8. As noted in relation to the full-time generic cohort, observations graded 2 peak at observation 6; however for each of the graded observations Grade 2 is the grade most often awarded.
2. This year there are no Grade 4s.
University of Bolton PGDE/PDE: Graded observations (2011-12)
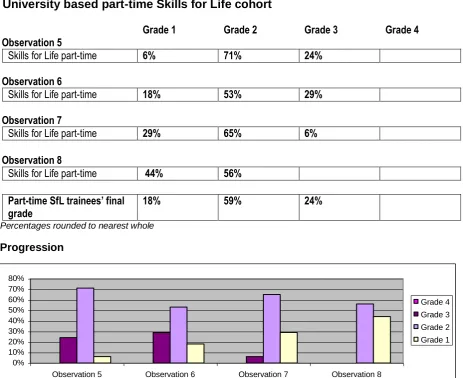
University based part-time Skills for Life cohort
Grade 1 Grade 2 Grade 3 Grade 4 Observation 5
Skills for Life part-time 6% 71% 24%
Observation 6
Skills for Life part-time 18% 53% 29%
Observation 7
Skills for Life part-time 29% 65% 6%
Observation 8
Skills for Life part-time 44% 56%
Part-time SfL trainees’ final
grade 18% 59% 24%
Percentages rounded to nearest whole
Progression
0% 10% 20% 30% 40% 50% 60% 70% 80%
Observation 5 Observation 6 Observation 7 Observation 8
Grade 4 Grade 3 Grade 2 Grade 1
Figure 4 Progressive teaching observation grades achieved by University based part-time SfL trainees (2011-12)
Commentary
1. This year analysis has also included examination of the graded observation results for the University based part-time Skills for Life cohort; however again it must be noted that trainee numbers are very small and percentages must be interpreted accordingly. As a whole, analysis clearly demonstrates trainee progression from observation 5 to
observation 8. The percent of observations assessed at Grade 3 reduces from 24% at observation 5 to none at observation 8, and the percent of observations assessed at Grade 1 increases from 6% at observation 5 to 44% at observation 8. Observations graded 2 peak at observation 5; however for each of the graded observations Grade 2 is the grade most often awarded.
2. This year there are no Grade 4s.
University of Bolton PGDE/PDE: Graded observations (2011-12)
Partnership cohorts (full-time and part-time)
Grade 1 Grade 2 Grade 3 Grade 4
Observation 5 (F/T)
Bolton Community College 70% 30%
Bury College 87.5% 12.5%
Cirencester College* 14% 43% 43%
Salford City College 17% 50% 33%
Observation 5 (P/T)
Bolton Community College 5% 85% 10%
Bury College 82% 18%
Cirencester College* 71% 29%
Salford City College 5% 73% 23%
Skills Solutions 6% 56% 39%
Total for partnership cohorts
(p/t and f/t) 6% 71% 24%
Observation 6 (F/T)
Bolton Community College 10% 60% 30%
Bury College 19% 69% 12.5%
Cirencester College* 14% 43% 43% Salford City College 17% 75% 8% Observation 6 (P/T)
Bolton Community College 30% 70%
Bury College 4.5% 91% 4.5%
Cirencester College* 14% 71% 14%
Salford City College 27% 73%
Skills Solutions 28% 67% 6%
Total for partnership cohorts
(p/t and f/t) 21% 70% 9%
Observation 7 (F/T)
Bolton Community College 30% 60% 10%
Bury College 50% 44% 6%
Cirencester College* 71% 29%
Salford City College 42% 50% 8%
Observation 7 (P/T)
Bolton Community College 20% 75% 5%
Bury College 18% 82%
Cirencester College* 29% 71%
Salford City College 50% 46% 5%
Skills Solutions 56% 28% 17%
Total for partnership cohorts
(p/t and f/t) 36% 56% 7%
Observation 8 (F/T)
Bolton Community College 30% 70%
Bury College 62.5% 37.5%
Cirencester College* 57% 43%
Observation 8 (P/T)
Bolton Community College 30% 70%
Bury College 27% 73%
Cirencester College* 14% 86% Salford City College 46% 55% Skills Solutions 78% 22% Total for partnership cohorts
(p/t and f/t) 42% 56% 2%
Percentages rounded to nearest whole)
*Note: The f/t and p/t Cirencester cohorts each had only 7 trainees; therefore percentages must be viewed accordingly.
Progression
0% 10% 20% 30% 40% 50% 60% 70% 80%
Observation 5 Observation 6 Observation 7 Observation 8
Grade 4 Grade 3 Grade 2 Grade 1
Figure 5 Progressive teaching observation grades achieved by trainees from partnership organisations
Commentary
Partnership cohorts – full-time and part-time
1. Partnership grades were calculated last year; however relevant data was received rather later than data for University based cohorts and was presented in table form only with no commentary. This year’s analysis of the graded observation results for the Partnership as a whole clearly demonstrates trainee progression from observation 5 to observation 8. The percent of observations assessed at Grade 3 reduces from 24% at observation 5 to 2% at observation 8, and the percent of observations assessed at Grade 1 increases from 6% at observation 5 to 42% at observation 8. As noted in relation to the University based generic cohort, observations graded 2 peak at
observation 5; however for each of the graded observations Grade 2 is the grade most often awarded.
2. As with University based cohorts, whilst the pattern of progression noted above is to a large extent in direction similar for each partner organisation i.e. each group progresses in a positive direction overall, as might be expected, the results do reveal some significant
around grading might also usefully form part of a joint University Partnership event. This would be of benefit for all assessors, University and Partnership alike, as differences in grading have been noted in all cohorts.
3. This year there were no Grade 4s within Partnership cohorts.
4. A total of 42% of the trainees from across the Partnership achieved a Grade 1 for their final observation, with 98% receiving either a Grade 1 or a Grade 2 at this stage. However, 50% of the cohort achieved a Grade 1 for at least one graded observation, indicating that half have the potential to be ‘outstanding‘ in the classroom.
University of Bolton PGDE/PDE: Graded observations
University full-time cohorts (SfL and Generic) – grading by ethnicity (2011-12)
Grade 1 Grade 2 Grade 3 Grade 4
Observation 5
BME trainees 9% 58% 33%
White trainees 9% 69% 22%
Totals for University 10% 49% 41%
Observation 6
BME trainees 15% 58% 27%
White trainees 18% 68% 14%
Totals for University 24% 45% 30%
Observation 7
BME trainees 15% 64% 21%
White trainees 28% 63% 9%
Totals for University 32% 54% 15%
Observation 8
BME trainees 41% 56% 3%
White trainees 43% 51% 6%
Totals for University 44% 43% 13%
Overall grade
BME trainees 15% 70% 15%
White trainees 15% 74% 11%
University trainees’ overall
grade 36% 44% 20%
Percentages rounded to nearest whole
A gap of more than 10%, drawing attention to higher achievement by white trainees
University full-time cohorts: Progression 2011-12
0% 10% 20% 30% 40% 50% 60% 70% 80%
Observat ion 5 Observat ion 6 Observat ion 7 Observat ion 8
Grade 4 Grade 3 Grade 2 Grade 1
Figure 6 Progressive teaching observation grades achieved by University full-time trainees (ethnicity – white)
0% 10% 20% 30% 40% 50% 60% 70%
Observation 5 Observation 6 Observation 7 Observation 8
Grade 4 Grade 3 Grade 2 Grade 1
University full-time cohorts: Grading by ethnicity in the previous year (2010-11)
Grade 1 Grade 2 Grade 3 Grade 4
Observation 8
BME trainees 29% 48% 24%
White trainees 43% 52% 5%
Totals for generic cohort 40% 51% 9%
Overall grade
BME trainees 5% 57% 38%
White trainees 18% 68% 13%
Generic trainees’ overall
grade 15% 66% 19%
Percentages rounded to nearest whole
Observation 8
BME trainees 47% 35% 18%
White trainees 51% 43% 6%
Totals for SfL cohort 50% 41% 9%
Overall grade
BME trainees 24% 41% 35%
White trainees 28% 70% 2%
All SfL trainees’ final grade 27% 62% 11% Percentages rounded to nearest whole
A gap of more than 10%, drawing attention to higher achievement by white trainees A gap of more than 20%, drawing attention to higher achievement by white trainees
Commentary
1. For this analysis, University SfL and generic trainees have been grouped together to allow for a more robust analysis of differential achievement and ethnicity; very small numbers can lead to misleading comparisons.
2. The analysis of observation results for the last academic year (2011-12), undertaken in order to identify any differentials in grading, has revealed some progress towards a more uniform achievement, as indicated in the figures above. However, differences remain. Once again, there is overall trainee progression from observation 5 to observation 8 for both BME and white trainees; however, differential achievement is apparent, although less marked than in the previous year. BME trainees have generally been assessed as achieving less well than their white colleagues. These differences are most evident in relation to observations 5, 6 and 7, and by the final observation and the overall grade there is a clear narrowing of the gap in achievement.
3. Following the analysis of grading completed last year, a range of
recommendations designed to support progression for all trainees were accepted and have been implemented during the course of the current year (see the report
be assumed that these measures have lead to the progress noted here. They need to be continuously promoted and subject to periodic review.
University of Bolton PGDE/PDE: Graded observations
University part-time cohorts (SfL and Generic) – grading by ethnicity (2011-12)
Grade 1 Grade 2 Grade 3 Grade 4
Observation 5
BME trainees (part-time) 40% 60% White trainees (part-time) 5% 68% 27% Totals for University (p/t) 4% 63% 33%
Observation 6
BME trainees (part-time) 80% 20%
White trainees (part-time) 13% 57% 30%
Totals for University (p/t) 11% 61% 29%
Observation 7
BME trainees (part-time) 100%
White trainees (part-time) 39% 52% 9%
Totals for University (p/t) 32% 61% 7%
Observation 8
BME trainees (part-time) 20% 80% White trainees (part-time) 48% 52% Totals for University (p/t) 43% 57%
Overall grade
BME trainees (part-time) 60% 40%
White trainees (part-time) 25% 63% 13% University overall grades (p/t) 21% 62% 17% Percentages rounded to nearest whole
A gap of 20% or more drawing attention to higher achievement by white trainees A gap of 10% or more drawing attention to higher achievement by BME trainees
University part-time cohorts: Progression 2011-12
0% 10% 20% 30% 40% 50% 60% 70% 80%
Observation 5 Observation 6 Observation 7 Observation 8
Grade 4 Grade 3 Grade 2 Grade 1
Figure 8 Progressive teaching observation grades achieved by University part-time trainees (ethnicity – white)
0% 20% 40% 60% 80% 100% 120%
Observation 5 Observation 6 Observation 7 Observation 8
Grade 4 Grade 3 Grade 2 Grade 1
Commentary
1. As before, for this analysis, part-time University SfL and generic trainees have been grouped together to allow for a more robust analysis of differential
achievement and ethnicity. As noted already, very small numbers can lead to misleading comparisons, and with regard to part-time trainees, BME numbers are very small indeed (BME trainees n=5). It is important that the statistics are
interpreted bearing this in mind.
2. As identified in relation to grades given to full-time trainees, differences in terms of the achievement of part-time BME and white trainees are revealed. Although for both groups there is overall trainee progression from observation 5 to observation 8 differential achievement is apparent. BME trainees have generally been assessed as achieving less well than their white colleagues. These differences are most evident in relation to observations 5, 8 and the overall grade given; however at observations 6 and 7 there are proportionately more white than BME trainees achieving only at grade 3.
3. One of the key measures designed to support progression for all trainees has been the formal ‘twinning’ arrangements following the marking of PTLLS assessments, whereby SfL trainees provide support with written English and/or ESOL for trainees identified as needing this. This has worked well for full-time trainees, but may be more difficult to access for some part-time trainees because of their other commitments. Additional research is needed to establish whether or not this is the case and additional measures identified if and as appropriate.