A b s t r a c t. The effect of aggregate size on hydraulic conductivity coefficient of two tilled soils with different genesis and the same texture is presented. The distribution of values of the hydraulic conductivity coefficient of Haplic Phaeozem relative to the particular aggregate fractions displays a bimodal character similar to that of the pore size distribution. The values of hydraulic conductivity coefficient for fraction of <0.25 mm of Eutric Fluvi-sol are significantly higher than those for the remaining fractions. For the aggregate fraction of <0.25 mm of Eutric Fluvisol and for the aggregate fractions of <0.25 and 0.25-0.5 mm of Haplic Phaeozem the dominant mechanism of water flow is the inter-aggregate transport, while for the remaining (larger) inter-aggregate fractions of both the soils the dominating flow mechanism is the intra-aggregate transport of water.
K e y w o r d s: soil, aggregation, water movement, hydraulic conductivity, relative conductivity
INTRODUCTION
The main soil properties exert an essential influence on the relationship between the components of water balanceie the water capacity and conductivity. The knowledge of these properties, the impact of various factors on them and the methods of their regulation allow to control water circula-tion processes in the biosphere. It is particularly important in areas used for agricultural production where adequate mana-gement of water resources leads to sustainable development, through the use of suitable land improvement and agro-technical management, crop rotation (taking into account plant varieties which have a lower demand for water) and the creation of protection zones around arable fields, pastures and forest land. In agricultural areas the soil water capacity and conductivity may be changed by tillage through the modification of physical properties such as a density or structure of soil (Czy¿ and Dexter, 2009; Lal and Shukla, 2004; Lipiecet al., 2007; Witkowska-Walczak, 2000).
Soil structure, defined as mutual positioning of aggregate-forming mineral soil particles and organic matter within the soil matrix.Structural processes occur at a different scale (10-9 to a few cm), and vary in time and space, so soil structure is a dynamic property with numerous aspects, and is difficult to characterize (Kutilek, 2004). The skeleton structure of micro- and macroaggregates is important to maintaining size, stability, and continuity of pores within and between aggregates (Balashovet al., 2010; Horn and Smucker, 2005). The porosity is the functional entity of soil structure, and it can be characterized by pore size distribu-tion, shape and space of pores, voids, channels, biochannels and biopores or macropores, cracks, fissures, fractures as well as vertical/horizontal continuity of pores. The desired size of aggregates is related with the soil function The smaller size of aggregates (dia <5 mm) is suitable for plant emergence and the soil with aggregates about 5 mm in diameter, with relatively low volume of inaccessible water – for the highest crop yield. The ideal seedbed agrees well with larger aggregates (dia about 15 mm) (Josaet al., 2010), because they enhance infiltration and/or provide depres-sions for water and thus allow more time for infiltration, delaying run-off generation. A coarser aggregate structure may also diminish the rate of evaporation and stimulate ion exchange processes. Recent studies revealed that organic matter associated with macroaggregates is better protected against mineralization and leaching than organic carbon not associated with mineral phase or present in small aggregates (G³¹bet al., 2009; Kêsiket al., 2010). Intilled soils, stable soil surface aggregates provide a greater number of conti-nuous and interconnected pores and have the potential to ac-celerate the flux iepreferential flow and affect unsaturated hydraulic conductivity and diffusivity (Kutilek, 2004). The preferential flow has been identified as the most important
Effect of aggregate size on water movement in soils
C. S³awiñski*, B. Witkowska-Walczak, J. Lipiec, and A. Nosalewicz
Institute of Agrophysics, Polish Academy of Sciences, Doœwiadczalna 4, 20-290 Lublin, Poland
Received December 31, 2010; accepted January 17, 2011
© 2011 Institute of Agrophysics, Polish Academy of Sciences *Corresponding author’s e-mail: [email protected]
A
A
Agggrrroooppphhyhyysssiiicccsss
component of water movement in many soils, especially loams and clays (Kutileket al., 2005). The preferential flow in aggregated soil influences transport of surface-applied agricultural chemicals in the soil and to surface and ground water (Richardet al., 2001).
The water retention and transport depend on pore stru-cture in soil, so the quantification of pore size distribution over a wide range of pore sizes is useful in practice and theoretical modelling (Durner and Fluhler, 1996; Gerke and Köhne, 2002). Relation of hydraulic conductivity coeffi-cient to water potential or water content is a basic characte-ristic conditioning water movement in the environment, so these relationships are often modeling (Pachepsky and Rawls, 2004; S³awiñskiet al.,2004). The description of pore size distribution depending on aggregate size and the deter-mination of static hydrophysical properties were an aim of our previous investigations (Lipiecet al.,2007).
The aim of this study was to quantify the effect of aggre-gate size on hydraulic conductivity coefficient of two tilled soils with different genesis and the same silty loam texture.
MATERIAL AND METHODS
The soils used were Haplic Phaeozem (HP) and Eutric Fluvisol (EF) under long-term conventional tillage system (SE Poland). Steppe plants, providing large amounts of orga-nic matter and fluvial outwash, were the main soil-forming factors of these soils. The basic properties of soils in natural state were as follows: HP was built from silt (67%), clay (22%) and sand (11%), whereas EF from silt (62%), clay (25%) and sand (13%), respectively. The bulk densities were 1.15 and 1.32 g cm-3, Corg– 3.0 and 2.3% and pHKCl– 6.8 and 7.4 for HP and EF, respectively. Soil samples were taken after har-vesting from the arable layer (0-15 cm) close to field water capacity (about water potential – 150 hPa) in the natural (undisturbed) (125 cm3cylinders) and disturbed form. To determine aggregate size distribution and separation of size ranges of aggregates, the soil samples were taken into rigid containers and transported to the laboratory. Following dry-ing up the soil in the laboratory to the air-dry state. The ag-gregate size distribution was determined by the standard sieve method using sieves of 10, 5, 3, 1, 0.5 and 0.25 mm mesh. The obtained results for the particular fractions were as follows: <0.25 mm – 11 and 3%, 0.25-0.5 – 15 and 2%, 0.5-1 – 15 and 17%, 1-3 – 23 and 28%, 3-5 – 14 and 11%, 5-10 mm – 15 and 27% and >10 mm – 7 and 28% (w/w) for HP and EF, respectively.
The pore size distribution of soil samples was obtained from their water retention curves (Lipiecet al., 2007). To de-termine the soil water retention curves, cylinders were filled with aggregates of the particular fractions: <0.25; 0.25-0.5; 0.5-1; 1-3; 3-5 and 5-10 mm. Then the cores were subjected to vibration and 3 successive wetting-drying cycles to get uniform density (Shielet al., 1988, Witkowska-Walczak, 2000). It was stated in our earlier investigations that the
amount ofwater stable aggregates was between 88-97% and the percentage were greater for beds of smaller than larger aggregates (Lipiecet al. 2007). The same size cores were used to determine water retention curves of undisturbed soil. The retention curves of the aggregate beds and undisturbed soil were determined using standard Richards chambers (SoilMoisture Equipment, Santa Barbara, CA, USA) in the drying process (5 replicates). To obtain whole continuous pore size distribution from the soil water retention curves the procedure described by Kutileket al. (2005) was used. The standard soil water retention curves,q(h), in this procedure are transformed into the parametric formsS(h),whereSis the relative saturation andhis the pressure head plotted as logarithm. Then the derivative curvesdS(ln(h))/d ln(h) are calculated and used for computation of pore size ditribution with the equationr=1490/h whereris the equivalent pore radius (ìm) andhis the pressure head (cm).
Measurement of the hydraulic conductivity coefficient in a saturated zone,Ks(m day-1), was carried out using a la-boratory permeameter (Eijkelkamp-Agrisearch Equipment, Giesbeek, The Netherlands) with a constant head method as a standard (5 replicates).
The hydraulic conductivity coefficient in a unsaturated zone of the soil was determined by the instantaneous profiles method (IPM) with the application of TDR (Time Domain Reflectometry) meter that enables the simultaneous measu-rement volumetric water content and water potential in the soil cores (Malicki and Skierucha, 1989; S³awiñskiet al., 2002; Walczak et al., 1993). It was possible to install 3 pairs of sensors to measure water content and the soil water potential at 1, 2.5, and 4 cm from the bottom. The absolute measure-ment error of soil hydraulic conductivity coefficient by in-stantaneous profiles method originates mainly from the re-flectometric water content measurements. In the soil water potential range from saturation to field capacity (water potential about 150 hPa) the maximum relative error of soil water conductivity coefficient does not exceed 10%. For the soil water potential close to the 850 hPa point the maximum relative measurement error is about 50% (S³awiñskiet al., 2006). The IPM procedure makes it possible to determine of hydraulic conductivity coefficient from 1 to about 850 hPa. The relative hydraulic conductivity coefficients were calcu-lated according Mualem equation:Kr= Kx/Ks, whereKsin our case was equalKat 1 hPa.
RESULTS AND DISCUSSION
forvariously textured and compressed soils (2.5-10.9 µm). However, the minima had similar radius (approximately 6 µm) when various tillage systems were applied to the same soil. The minima separating the structural and macropore subdo-mains in our study occur mostly in beds of aggregates >1 mm and undisturbed soils, corresponding to approximately 20-60 µm. Irrespective of the soil type, the porous system of the aggregate beds <0.25, 0.25-0.5 and 0.5-1 mm tends to be bimodal with textural and structural domains, and trimodal with an additional macropore domain in the case of beds of aggregates of 1-3, 3-5 and 5-10 mm. In the second group of aggregate beds (1-10 mm) the peaks are more close together in EF than in HP. The peaks associated with the textural pore system in all aggregate beds of both soils correspond to a po-re radius of approximately 0.42 µm. In general, the peaks were of greater magnitude in beds of aggregates <0.25 mm than in beds of larger aggregates. These differences are much more pronounced in EF than in HP due to greater magnitude of the textural peak in the former. The structural domains in the beds of aggregates from HP display a narrow peak corresponding to a pore radius of approximately 3.7 µm for aggregates <0.25 mm and a less narrow peak of 18.7 µm for aggregates of 0.25-0.5 mm. However, in the case of the ag-gregate beds >0.5 mm the structural peaks range within the pore radius of 3.7-35 µm and are more distinct in beds of aggre-gates of 0.5-1 mm than of larger aggreaggre-gates of 1-10 mm. In EF, compared to HP, the structural peaks are less pronoun-ced in aggregate beds within <0.25 mm. The peaks associa-ted with macropore domain in HP are poorly defined for aggregates of 0.25-1 mm and for aggregate beds of 1-3, 3-5 and 5-10 mm are well pronounced with pore radius of up to approximately 700 µm. However, in EF the macropore peaks in all aggregate beds from 0.25 to 10 mm correspond to similar pore radius of approximately 60 µm. A substantially greater pore radius of the macropore peak in beds of aggre-gates of 1-10 mm of Haplic Pheaozem than of EF can be, in part, a result of fewer disturbances of the aggregates in the former by the wetting-drying cycles preceding determina-tion of the water retendetermina-tion curve. This can be partly attributed to greater water stability of HP than EF. Additionally, this macropore peak can be associated with a greater soil water content at saturation in the former (59-62% vol.) than in the latter (52-55% vol.) that could be easily drained at low pressure heads while determining water retention curves. As to undisturbed samples, the pore size distribution in both soils display trimodality that is more defined in HP than in EF.
The hydraulic conductivity coefficients at 1 hPa (satura-ted conductivity) for HP were shown in Table 1. It can be stated that these values were changed over 13 times for HP and over 15 times for EF to the increase of aggregate sizes.
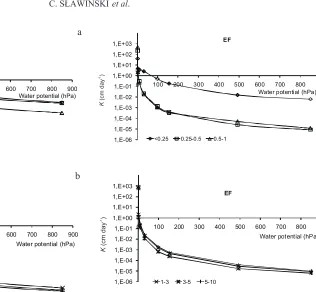
The values of hydraulic conductivity coefficient for HP and EF particular aggregates fractions are shown in Figs 1 and 2.
Analyzing the changes in the values of the hydraulic conductivity coefficient in relation to the values of the soil water potential it can be noted that high values of the hydra-ulic conductivity coefficient for HP within the full range of variability of soil water potential values were observed for aggregates <0.25, 0.25-0.5 and 0.5-1 mm. Those were: 30, 200 and 96 cm day-1for 2.5 hPa and 8.5 10-3, 7.5 10-3and 9.2 10-4cm day-1for 850 hPa, respectively. Whereas, for ag-gregates of the fractions of 1-3, 3-5 and 5-10 mm the values of the hydraulic conductivity coefficient were significantly lower throughout the range of soil water potential values studied,iefrom 3.5 to 2 10-6, 1.6 -1.2 10-6and 1-1 10-6cm day-1at 2.5 and 850 hPa, respectively. Analyzing the distri-bution of soil pores by their diameters in our previous in-vestigations, it was observed that for aggregates of <0.25, 0.25-0.5 and 0.5-1 mm the pore distributions display similar bimodal runs. The first maximum for both distributions coin-ciding with pore radius ofca.0.7 µm, while the second maxi-mum for aggregates of 0.25-0.5 and 0.5-1 mm is shifted to-wards higher pore radius values with relation to aggregates of <0.25 mm. The higher values of hydraulic conductivity for aggregates with diameters of <0.25, 0.25-0.5 and 0.5-1 mm relative to pores with diameters of 1-10 µm may indicate that the dominant factor causing water movement is the gradient of the capillary component of soil water potential. This may also be indicated by the similar runs of pore distributions by diameters for aggregates within that range of variability. The relatively small changes in the hydraulic conductivity coef-ficients within the range of low values of soil water potential (2.5-31 hPa) for fractions of <0.25; 0.25-0.5 and 0.5-1 mm, compared to the other fractions, result from the low share of large pores (100-1000 µm) which, within that size range, re-lease water. Above soil water potential values correspon-ding to 31 hPa, the slope of the curves is similar for all aggregate fractions. A similar run is also observed for the pore distribu-tions for equivalent diameters of <1 µm ( Lipiecet al.,2007). The highest values of the hydraulic conductivity coef-ficient were recorded for EF aggregates with diameters of <0.25 mm – 4.9 cm day-1at 2.5 hPa and 6.3 10-3cm day-1at
Soil Conductivity coefficient (cm day
-1)
<0.25 0.25-0.5 0.5-1 1-3 3-5 5-10 Natural state
HP 50 330 340 640 690 680 370
EF 40 210 500 780 650 620 320
850 hPa. Values of hydraulic conductivity coefficients for that aggregate fraction are significantly different from the coefficients for aggregates >0.25 mm. The low share of large pores, in turn, caused that the relative saturation of the sam-ple varied to a limited extent within that range of pressures. For the remaining aggregate fractions: 0.25-0.5, 0.5-1,1-3, 3-5 and 5-10 mm, the values of the hydraulic conductivity coefficients: 3.4, 2.2, 2.1, 1.1 and 1.7 cm day-1at 2.5 hPa as well as 8.7 10-6, 1.2 10-5and 8.4, 6.3, 9.3 10-6cm day-1at 850 hPa, respectively, are comparable throughout the range soil water potential values studied. The steeper slope ofK(ø) for soil
water potential corresponding to£150 hPa, compared to the
slope ofK(ø)for the finest fraction, results from the relati-vely higher content of small pores <1 µm that were dewa-tered at pressure values within that range. Analyzing the distributions of pores by their diameters it was observed that for aggregates of <0.25 mm the distribution has a bimodal character and differs notably from the distributions for the remaining aggregate fractions. For those aggregates it may be assumed that, like in the case of aggregates of HP, the main factor for water movement is the gradient of the capil-lary component of soil water potential.
The values of hydraulic conductivity coefficients for HP and EF in the natural state (with undisturbed structure) against the background of aggregate fractions under study versusthe soil water potential are shown in Fig. 3. As can be
seen from the curves presented, the values of hydraulic conductivity coefficients fall within the ranges of values corresponding to the values of coefficients for aggregates with diameters greater than 1 mm. These are as follows: for HP – 0.1 and 1.1 10-9cm day-1, whereas for EF – 4.1 and 4.8 10-8cm day-1at 2.5 and 850 hPa, respectively.
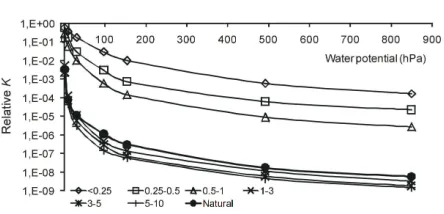
The relative coefficient of hydraulic conductivity in the soil medium represents more clearly the potential possibility of water movement inthe unsaturated zone. Therefore the values of coefficient were calculated for the whole range of variation of soil water potential and subjected to analysis. As can be seen in the presented graphs (Figs 4 and 5), for both soils all the curves are similar in shape, with the coefficient assuming the highest values – throughout the range of soil water potential values – for aggregates of < 0.25 mm. For EF it exceeds the values of the coefficient for the other aggre-gate fractions by more than one order of magnitude. This is especially noticeable for the lower (in absolute values terms) values of soil water potential. The curves for the remaining aggregate fractions and for the soils in their natural state are grouped close together. The highest values of the relative hydraulic conductivity coefficient for this group, throughout the range of changes in the soil water potential, were re-corded for the soils in their natural state. This supports the domination of HP – below the curve for aggregates of <0.25 mm there is the curve for that soil in itsnatural state, 1,E-06
1,E-05 1,E-04 1,E-03 1,E-02 1,E-01 1,E+ 00 1,E+ 01 1,E+ 02 1,E+03
0 100 200 300 400 500 600 700 800 900 Water potential (hPa) HP
<0.25 0.25-0.5 0.5-1
K
(cm
d
a
y
)
-1
1,E-06 1,E-05 1,E-04 1,E-03 1,E-02 1,E-01 1,E+00 1,E+01 1,E+02 1,E+03
0 100 200 300 400 500 600 700 800 900 Water potential (hPa) HP
1-3 3-5 5-10
K
(cm
d
a
y
)
-1
Fig. 1.Hydraulic conductivity coefficientsvswater potential for Haplic Pheaozem (HP) aggregates: a – < 1 mm, b – >1 mm.
1,E-06 1,E-05 1,E-04 1,E-03 1,E-02 1,E-01 1,E+00 1,E+01 1,E+02 1,E+03
0 100 200 300 400 500 600 700 800 900
Water potential (hPa)
EF
<0.25 0.25-0.5 0.5-1
K
(cm
d
a
y
)
-1
1,E-06 1,E-05 1,E-04 1,E-03 1,E-02 1,E-01 1,E+00 1,E+01 1,E+02 1,E+03
0 100 200 300 400 500 600 700 800 900 Water potential (hPa) EF
1-3 3-5 5-10
K
(cm
d
a
y
)
-1
Fig. 2.Hydraulic conductivity coefficientsvswater potential for
Eutric Fluvisol (EF) aggregates: a – < 1 mm, b – >1 mm. a
b b
characterized by a higher share of aggregates <0.25 mm compared to EF. It is shifted relative to the curve for ag-gregates <0.25 mm by an order of magnitude, especially for lower values of the soil water potential. It is also supported by the fact that for aggregates of <0.25 mm the dominant motor of movement is capillary transport. Somewhat lower values of the relative conductivity coefficient are observed for aggregates of 0.25-0.5 and 0.5-1 mm, whose curves practically overlap. The lowest values are assumed by the coefficients of conductivity for aggregates of 1-3, 3-5 and 5-10 mm, whose curves are also positioned close to one another. Such distribution of values of the relative hydraulic conductivity coefficient is in an agreement with the
distribu-tion of pore sizes obtained for the particular aggregate fractions and for the undisturbed soil in our previous work (Lipiecet al.,2007).
The shape of curves of the relative coefficient of hy-draulic conductivity for the two soils in their natural state and for the particular aggregate fractions showed that the large drop in the values of hydraulic conductivity coefficient from saturation to soil water potential of about 150 hPa indi-cates the domination of water movement through macro-pores. Whereas, the flat nature of the curves starting from soil water potential of 150 to 850 hPa indicates the domina-tion of mezopores and micropores in the water movement. The possibilities of water transport in structural soils one should also note that the hydraulic conductivity coefficient depends not only on the volume of soil pores but also on their continuity. In structural soils with large gaps the hydraulic conductivity coefficient in bulk soil increases, while the rate of water flow within the soil aggregates decreases rapidly due to the shrinkage of the soil (Horn and Smucker, 2005; Youngs, 2008). The results obtained showed that the higher values of hydraulic conductivity coefficient within the whole range of water potential changes were observed for the fra-ctions of <0.25, 0.25-0.5 and 0.5-1 mm than those bigger than 1 mm of HP. For EF, the higher values of hydraulic conduc-tivity coefficient throughout the range of variability were re-corded for the aggregates <0.25 mm than those bigger than 0.25 mm. It can be assumed, therefore, that the dominant type of flow for those aggregate fractions, compared to larger aggregates, is the inter-aggregate flow (Ben-Huret al., 2009; Carminatiet al., 2008). This is particularly visible for water potential values close to saturation. For the aggregate fra-ction of 1-3, 3-5 and 5-10 mm of the HP the shapes of the hydraulic conductivity coefficient curves are similar in cha-racter. The curves dis- play a large drop in the values of the coefficient throughout the range of changes in soil water potential (from 103to 10-6cm day-1). A particularly large drop is observed within the range of potentials close to sa-turation. Similar courses occur for the hydraulic conducti-vity coefficient curves for those aggregate sizes and for aggregates of 0.25-0.5 and 0.5-1 mm of EF. However, this drop begins from the value of about 102cm day-1to the value ofca. 10-6cm day-1. It can be assumed, therefore, that for those soils and those aggregate fractions the dominant flow is the slower flow – the intra-aggregate flow.
As it has been emphasised, the water flow is also deter-mined by the shape and continuity of soil pores, and by their distribution by their diameters in particular. It can be con-cluded, therefore, that those factors also have an effect on such a shape of the curves of hydraulic conductivity. For EF aggregates <0.25 mm, and for HP aggregates <0.25, 0.25-0.5, and 0.5-1 mm, up to the soil water potential value of approx. 100 hPa the curves of the hydraulic conductivity coefficient display a plateau, while from the value of 100 hPa they drop fairly rapidly. This confirms the domination of the inter-aggregate flow within that range of soil water potentials. Fig. 3.Hydraulic conductivity coefficientsvswater potential for
Haplic Pheaozem and Eutric Fluvisol in the natural state. Natural
Fig. 4.Relative hydraulic conductivity coefficientsvswater poten-tial for Haplic Pheaozem aggregates and for the soil in natural state.
Fig. 5.Relative hydraulic conductivity coefficientsvswater
For the soils in their natural state the hydraulic conduc-tivity curves have similar shapes, the values of coefficient for EF being higher than those for HP by an order of magnitude throughout the range of changes in the soil water potential. At the same time the curves are very steep, which may indicate that the water flow mechanisms are similar in both soils. However, in soils with undisturbed structure the shapes and continuity of pores, apart from the aggregate distribution, have a decisive impact on water movement. It can be a reason, why EF showed the higher hydraulic coefficients in this case.
CONCLUSIONS
1. The distribution of the values of the hydraulic con-ductivity coefficient of Haplic Phaeozem relative to the par-ticular aggregate fractions displays a bimodal character si-milar to that of the pore size distribution, the first maximum for both distributions coinciding with pore radius of about 0.7 µm, while the second maximum for aggregates of 0.25-0.5 and 0.5-1 mm is shifted towards higher radius va-lues compared to aggregates of <0.25 mm.
2. The values of hydraulic conductivity coefficient for the fraction of <0.25 mm of Eutric Fluvisol are significantly higher than those for the remaining fractions.
3. For the aggregate fraction of <0.25 mm of Eutric Fluvisol and for the aggregate fractions of <0.25 and 0.25-0.5 mm of Haplic Phaeozem the dominant mechanism of water flow is the inter-aggregate transport, while for the remaining (larger) aggregate fractions of both the soils the dominating flow mechanism is the intra-aggregate transport of water.
4. Analysis of the shape of curves of hydraulic conduc-tivity coefficient for the soils in their natural state as well as for the particular aggregate fractions revealed that the notable drop in the values of the relative coefficient of hy-draulic conductivity at around 150 hPa indicates the domi-nation of water flow through macropores, while the plateau on the curves between soil water potential values of 150 hPa and 850 hPa indicates the domination of mezopores and micropores in water transport.
REFERENCES
Balashov E., Kern J., and Prochazkova B., 2010.Influence of plant residue management on microbial properties and water-stable aggregates of soils. Int. Agrophys., 24, 9-14.
Ben-Hur M., Yolcu G., Uysal H., Lado M., and Paz A., 2009. Soil structure changes: aggregate size and soil texture effects on hydraulic conductivity under different saline conditions. Australian J. Soil Res., 47, 688-696.
Carminati A., Kaestner A., Lehman P., and Flühler H., 2008. Unsaturated water flow across soil aggregate contacts. Adv. Water Res. 31, 1221-1232.
Czy¿ E. and Dexter A., 2009.Soil physical properties as affected by traditional, reduced and no-tillage for winter wheat. Int. Agrophysics, 23, 319-326.
Durner W. and Flühler H., 1996. Multi-domain model for pore-size dependent transport of solutes in soils. Geoderma, 70, 281-297.
Gerke H.H. and Köhne M., 2002. Estimating hydraulic properties of soil aggregate skins from sorptivity and water retention. Soil Sci. Soc. Am. J., 66, 26-36.
G³¹b T., Zaleski T., Erhart E., and Hartl W., 2009.Effect of bio-waste and nitrogen fertilization on hydraulic properties of Mollic Fluvisol. Int. Agrophysics, 23, 123-128.
Horn R. and Smucker A., 2005.Structure formation and its con-sequences for gas and water transport in unsaturated arable and forest soils. Soil Till. Res., 82, 5-14.
Josa R., Ginovart M., and Sole A., 2010.Effect of two tillage techniques on soil macroporosity in sub-humid environ-ment. Int. Agrophys., 24, 139-148.
Kêsik T., B³a¿ewicz-WoŸniak M., and Wach D., 2010.Influence of conservation tillage for onion production on the soil organic matter and aggregate formation. Int. Agrophys., 24, 267-274. Kutilek M., 2004. Soil hydraulic properties as related to soil
structure. Soil Till. Res., 79, 175-184.
Kutilek M., Jendele L., and Panayiotopoulos K.P., 2005.The influence of uniaxial compression upon pore size distribu-tion in bimodal soils. Soil Till. Res. 86, 27-37.
Lal R. and Shukla M.K., 2004.Principles of Soil Physics. Dekker Press, New York - Basel.
Lipiec J., Walczak R., Witkowska-Walczak B., Nosalewicz A., S³owiñska-Jurkiewicz A., and S³awiñski C., 2007. The effect of aggregate size on water retention and pore structure of silt loam soils of different genesis. Soil Till. Res., 97, 239-246.
Malicki M.A. and Skierucha W., 1989.A manually controlled TDR soil moisture meter operating with 300 ps. rise needle pulse. Irrigation Sci., 10, 153-163.
Pachepsky Y. and Rawls W.J., 2004.Development of Pedotrans-fer Functions in Soil Hydrology. Elsevier Press, Amsterdam - New York-San Diego-London.
Richard G., Cousin I., Sillon J.F., Bruand A., and Guérif J., 2001. Effect of compaction on soil porosity: consequences on hydraulic properties. European J. Soil Sci., 52, 49-58. Shiel R., Adey M.A., and Lodder M., 1988.The effect of
succes-sive wet/dry cycles on aggregate size distribution in a clay texture soil. J. Soil Sci., 39, 71-80.
S³awiñski C., Sobczuk H., Stoffregen H., Walczak R., and Wessolek G., 2002.Efffect of data resolution on soil hydraulic conduc-tivity prediction. J. Plant Nutr. soil Sci., 165, 45-49. S³awiñski C., Walczak R.T., and Skierucha W., 2006.Error
ana-lysis of hydraulic conductivity coefficient measurement by instantaneous profiles method. Int. Agrophysics, 20, 55-62. S³awiñski C., Witkowska-Walczak B., and Walczak R., 2004.
Determination of hydraulic conductivity coefficient of soil porous media. IA PAS Press, Lublin, Poland.
Walczak R.T., S³awiñski C., Malicki M.A., and Sobczuk H., 1993. Measurement of water characteristics in soil using TDR technique. Water characteristics of loess soil under different treatment. Int. Agrophysics, 7, 175-182.
Witkowska-Walczak, B., 2000.Aggregate structure of mineral
soils vs. hydrophysical characteristics (model
investiga-tions) (in Polish). Acta Agrophysica, 30, 5-94.