RESEARCH
Structural parameters for X-ray
micro-computed tomography (μCT) and their
relationship with the breakage rate of maize
varieties
Junfeng Hou
1, Ying Zhang
2, Xiuliang Jin
1, Pengfei Dong
3, Yanan Guo
3, Keru Wang
1, Yinghu Fan
4and Shaokun Li
1*Abstract
Background: High grain breakage rate is the main limiting factor encountered in the mechanical harvest of maize
grain. X-ray micro-computed tomography (μCT) scanning technology could be used to obtain the three-dimensional structure of maize grain. Currently, the effect of maize grain structure on the grain breakage rate, determined using X-ray μCT scanning technology, has not been reported. Therefore, the objectives of this study are: (i) to obtain the shape, geometry, and structural parameters related to the breakage rate using X-ray μCT scanning technology; (ii) to explore relationships between these parameters and grain breakage rate.
Result: In this study, 28 parameters were determined using X-ray μCT scanning technology. The maize breakage
rate was mainly influenced by the grain specific surface area, subcutaneous cavity volume, sphericity, and density. In particular, the breakage rate was directly affected by the subcutaneous cavity volume and density. The maize variety with high density and low subcutaneous cavity volume had a low breakage rate. The specific surface area (r = 0.758*), embryo specific surface area (r = 0.927**), subcutaneous cavity volume ratio (0.581*), and subcutaneous cavity vol-ume (0.589*) of maize grain significantly and positively correlated with breakage rate. The cavity specific surface area (− 0.628*) and grain density (− 0.934**) of maize grain significantly and negatively correlated with grain breakage rates. Grain shape (length, width, thickness, and aspect ratio) positively correlated with grain breakage rate but the correlation did not reach statistical significance. The susceptibility of grain breakage increased when kernel weight decreased (− 0.371), but the effect was not significant.
Conclusions: The results indicate that X-ray μCT scanning technology could be effectively used to evaluate maize
grain breakage rate. X-ray μCT scanning technology provided a more precise and comprehensive acquisition method to evaluate the shape, geometry, and structure of maize grain. Thus, data gained by X-ray μCT can be used as a guide-line for breeding resistant breakage maize varieties. Grain density and subcutaneous cavity volume are two of the most important factors affecting grain breakage rate. Grain density, in particular, plays a vital role in grain breakage and this parameter can be used to predict the breakage rate of maize varieties.
Keywords: Breakage rate, X-ray μCT, Maize grain, Density, Subcutaneous cavity volume, Shape, Weight
© The Author(s) 2019. This article is licensed under a Creative Commons Attribution 4.0 International License, which permits use, sharing, adaptation, distribution and reproduction in any medium or format, as long as you give appropriate credit to the original author(s) and the source, provide a link to the Creative Commons licence, and indicate if changes were made. The images or other third party material in this article are included in the article’s Creative Commons licence, unless indicated otherwise in a credit line to the material. If material is not included in the article’s Creative Commons licence and your intended use is not permitted by statutory regulation or exceeds the
permitted use, you will need to obtain permission directly from the copyright holder. To view a copy of this licence, visit http://creat iveco
mmons .org/licen ses/by/4.0/. The Creative Commons Public Domain Dedication waiver (http://creat iveco mmons .org/publi cdoma in/ zero/1.0/) applies to the data made available in this article, unless otherwise stated in a credit line to the data.
Open Access
*Correspondence: [email protected]
1 Institute of Crop Science, Chinese Academy of Agricultural Sciences,
Beijing 100081, China
Background
Maize (Zea mays L.) is a vital global food source. Grain breakage is an important problem in maize harvest-ing, transportation, and processing. Breakage reduces the suitability of the grain for wet and dry milling and increases the risk of damage during storage [1]. The effi-ciency of dryer aeration systems may decrease if large proportions of kernels are broken, resulting in reduced yields and the production of toxic substances. At present, a high grain breakage rate is the leading problem in grain mechanical harvesting. Previous studies have shown that maize grain shape [1], internal structure, grain hardness [2], and chemical composition [3] affect grain break-age, and the sensitivity or resistance to grain breakage has high heritability [4–6]. Leford et al. [7] showed that breakage resistant grain tended to be smaller and denser, and was higher in shear strength. Waelti et al. [8] showed that moisture content and kernel size (thickness and area) were positively related to kernel damage; kernel damage increased with increasing kernel size and moisture con-tent. Plant density, harvest moisture content, and drying temperature also influence grain breakage susceptibility [8]. Martin et al. [9] concluded that mechanical break-age at harvest was influenced primarily by kernel shape, size, and structural characteristics and then by kernel hardness properties. Exploring the grain characteristics related to grain breakage will facilitate the identification of key factors impacting grain breakage.
Breakage susceptibility is usually measured using the Stein breakage tester (SBT) and Wisconsin break-age tester (WBT) methods [9]. The SBT method uses a 100-g grain sample, which is impacted and abraded by continuous stirring with impeller rotation for 2 min. In the WBT method, a 200 g kernel sample is accelerated by centrifugal force and the impact on kernel breakage is determined. The degree of sphericity directly affects the fluidity of particles and represents the degree that objects are close to a sphere [9].
Kernel density could be measured using several approaches. The most commonly method is a bulk den-sity value to evaluate maize quality. The floater test and pycnometer displacement test are more accurate meth-ods for density measurements. The floater test is based on the percentage of suspended kernels in a given spe-cific gravity salt solution. In the pycnometer measure-ment, water or gas is discharged from a large number of kernel samples, and then the density is calculated by dividing the mass of the sample by the volume discharged [10–12]. However, the material density of a single grain is difficult to obtain with these methods.
The traditional methods are commonly destructive and require sample preparation for obtaining shape, density, and the internal structure of kernels. In addition, the
effects of grain surface area and volume on kernel break-age are difficult to evaluate. X-ray µCT can be used to easily acquire the geometric parameters of objects. X-ray µCT is non-destructive and acquires 3D imaging with resolutions higher than 1 µm, which allows the internal structural parameters of the sample to be analyzed [13]. X-ray µCT delivers unparalleled data with more detail than any other technique. The most compelling charac-teristics of the X-ray µCT techniques are digital imaging and 3D quantitative volume [14].
The X-ray µCT software tools system, Skyscan 1072 (Skyscan, Belgium), can easily acquire many parameters from 3D models, including air volume, surface-to-vol-ume ratio, spatial cell size distribution, cell wall-thickness distribution, connectivity, and porosity. X-ray µCT tech-nology, a useful method for studying the 3D structure of food material, can measure the density of a single grain [15, 16]. X-ray µCT has been successfully used for study-ing food, such as cream cheese [17], yogurt [18], and mayonnaise [19]. Donis-González et al. [20] and Kotwali-wale et al. [21] showed that the number of X-ray imag-ing appliances in agricultural research is increasimag-ing. The whole grain structure of high-amylose and wild-type rice were compared using X-ray µCT [22]. Van Dalen et al. [23] investigated porous cereal products and obtained the real density variations of a grain sample to exclude grain cavities using X-ray µCT, which is impossible using other imaging methods. X-ray μCT technology has also been used to quantify maize stem vascular bundles traits and metaxylem vessels in maize roots, to understand the rela-tionship between root anatomy and function [24, 25]. The influence of grapevine xylem organization on the refilling of embolized vessels was discovered using High-resolu-tion X-ray Computed Tomography (HRCT). Whole ves-sel network studies were helpful in comprehending how the distribution of interconnection affects hydraulic con-ductivity and the ability to adapt to the changing environ-ment [26, 27]. Gustin et al. [16] obtained the parameters of maize grain density, volume, and cavity volume by X-ray µCT and demonstrated that the measured grain density significantly correlated with the bulk density (r = 0.80). Gustin et al. [16] also showed that embryos had little impact on kernel density and the ratio of vitre-ous endosperm/floury (V:F) endosperm showed a strong correlation with density. Guelpa [28] suggested that the ratio of vitreous endosperm/floury endosperm could be calculated using X-ray µCT to derive density and indi-cated a significantly higher V:F for the high-density ker-nel (2.77) compared to that of low-density kerker-nels (1.27).
breakage rate using X-ray μCT scanning technology. Therefore, the objectives of this study were: (i) to obtain the shape (length, width, thickness, aspect ratio, and sphericity), geometry (the volume and proportion of the grain, endosperm, seed coat, embryo, and cavity and sur-face area), and structure (grain density and other charac-teristics) parameters that relate to the breakage rate using X-ray μCT scanning technology; (ii) to explore the rela-tionships between these parameters and grain breakage rate. This study provides new insight into the relationship between grain breakage rate and grain structure informa-tion in maize.
Materials and methods Material
The grains used in this study included Denghai 618 (DH618), Xianyu 335 (XY335), M751, KX3564, KX9384, and Lianchuang 808 (LC808). In 2017, the grains were planted with the same density in the same plot in Qitai, Xinjiang. A representative ear from each of the 6 varie-ties was naturally air-dried, and the grains were selected from the middle of each ear by manual threshing. Three replicates of the non-injured typical grains were used for test samples.
Image acquisition and the distribution of grain components
The test samples were scanned using the Skyscan 1172 X-ray computed tomography system (Bruker Corpo-ration) and a 1.3 megapixel cooled CCD camera. The source-to-object distance (the distance from the X-ray tube to the object) was 259.850 mm for all individuals and the source-to-image distance (the distance from the X-ray tube to the X-ray detector) was 345.591 mm. A 40 kV/250 mA tungsten X-ray source was employed for CT scan and the test samples scans were made over 180º rotations with the images taken every 0.2º. An exposure time of 1475 ms and two-frame averaging were chosen to produce images with a pixel size of 7 μm. The CT data in the 4 K scan module were converted into a series of CT slice images with 8-bit tagged image file format using Skyscan NRecon software (Bruker Corporation).
The kernel was placed on the translation stage with paraffin, and the bottom of the kernel was adhered with paraffin, which would not affect the level of X-ray attenu-ation. During scanning a sample was rotated on a trans-lation stage while illuminated with X-rays. X-ray CT evaluated the internal structure of a sample by means of a X-ray source and a detector in order to obtain informa-tion from a projected slice. When an X-ray beam passed through a sample it was attenuated. The differences in attenuation were attributable to density and composi-tional differences within a sample. The X-rays passed
through the object in many different directions and the transmission level was determined by the absorption coefficient of a sample. According to the degree of X-ray attenuation, the detector measured the remnant attenu-ated radiation and the response was transferred to a com-puter. An image was created along different pathways illustrating variation in density at numerous points in a 2D slice [15]. Thus, a series of 2D radiographs or projec-tion images were acquired.
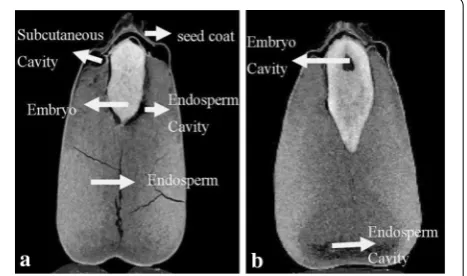
The entire grain spatial architecture was analyzed and visualized by CT-volume (CTVol) software (Bruker Corporation, Germany). Using 2D images from differ-ent angles of the grain sample, the internal structural information of different sections and three-dimensional reconstruction results were obtained (Figs. 1a–c and 2). The 2D images enable the visualization of the morphol-ogy and microstructure, such as the pore shape, size, and distribution. Grain 2D images were divided into four major parts: seed coat, embryo, endosperm, and cavity, which contained the subcutaneous cavity, endosperm cavity, and embryo cavity.
Grain image reconstructed and quantitative analysis
The CT-Analyser (CTAn) and CT-Volume (CTVol) soft-ware were used to reconstruct CT raw images that were subsequently visualized in color. The image processing was carried out as described in the literature [29]. About 1000 images were obtained from the X-ray µCT of a single sample. The image analysis and segmentation processes applied include filter, adaptive thresholds, region-grow-ing, erosion and dilation techniques, which were func-tion key of the CTAn and CTVol software. First, filter was used to reduce noise and to correct detector defects. And filter was also applied to increase the visibility and
to enhance the edges of a sample. Second, image seg-mentation was determined using processing techniques, including locally adaptive thresholds and region-growing techniques. Using locally adaptive thresholds, the voxel containing grey values lower or higher than this thresh-old value were regarded as background or sample mate-rial, respectively. 2D image was segmented depending on the brightness and regional distribution. Every image was divided into six parts, including the seed coat, embryo, endosperm, subcutaneous cavity, endosperm cavity, and embryo cavity (Fig. 1). Every part was dyed by different colors with region-growing, which could be done rely on the average grey value of every part. Third, after segmen-tation, the image was cleaned up to remove small quanti-ties of pixels that could affect the result. The erosion and dilation tools were used for cleaning image. Fourth, the 2D slice images were merged to create a 3D image. Fig-ure 3 showed the process of image segmentation.
Through the 3D image, the internal structure of the sample was visualized and the distribution of the different
Fig. 2 Three-dimensional measurement after the
image reconstructed. The distance between the arrowheads is the dimension of length, width and thickness, respectively. Three colors represent the different parts of maize grain, green is endosperm, red is cavity space, blue is embryo
Fig. 3 Image segmentation of the grain component. a1–a3 are the three aspects of grain raw image, respectively; b1–b3 are the region color
segmentation; c1 is the merged 3-D imagery. Three colors represent the different parts of maize grain, green is endosperm, red is cavity space, blue
density regions was identified. The 3D image microstruc-tural parameters, including volume, volume fractions, area, dimensions, and connectivity, along with the den-sity information were obtained from the data sets. Using X-ray µCT, the geometry of structural components, such as cavity volume and ratio, were acquired from the raw data. The image processing was time-consuming and only two grain samples could be processed per day.
Acquisition of grain morphology and structural parameters
Grain size, geometry, and structural parameters were determined by 3D X-ray µCT images. The geometry of grain components was quantified by size, shape, orienta-tion, and position. We obtained 28 parameters related to grain shape and structure, which provided detailed data to understand maize kernels (Table 1). After the three-dimensional reconstruction of the maize kernel, the dimensions (length, width, and thickness) of the three-dimensional image were measured using the CTVol
software. The weight was determined with an analytical balance.
Method for measuring grain breakage rate
To determine the moisture content of each variety, one hundred kernels were weighed (Wa) and then dried at 85 °C for about 48 h and then weighed again (Wb). The moisture content of the variety was calculated by divid-ing the difference of weight before and after drydivid-ing (Wa − Wb) by before drying (Wa) [30]. The moisture contents were 12.4%, 13.4%, 11.5%, 12.5%, 12.8%, and 11.6% for KY3564, M751, DH618, KX9384, LC808, and XY335, respectively.
The grinding method, using milling followed by sieving, was used to measure the grain breakage rate. The method is described by Vyn and Moes [1]. Samples were selected from the middle of the maize ears and were milled using a digital ultrafine grinder (WIGGENS PX-MFC90D, Ger-man) fitted with a 2-mm sieve. The test parameters were
Table 1 All parameters obtained through CT scan
d surface area of same volume sphere
Parameters Features Formulas or diagrams
Width (W) The left to right distance of 3D image Figure 2
Length (L) The top to bottom distance of 3D image Figure 2
Thickness (T) Distance between embryo side and endosperm side of 3D image Figure 2
Aspect ratio (AR) The ratio of length to width AR = L/W
Weight (mg) The weight of single grain –
Grain volume (Vg) The whole volume of grain 3D image –
Endosperm volume (Ven) The whole volume of endosperm 3D image –
Embryo volume (Vem) The whole volume of embryo 3D image –
Cavity volume (Vc) The whole volume of cavity 3D image –
Subcutaneous cavity volume (Vsc) The volume of subcutaneous cavity –
Embryo cavity volume (Vemc) The volume of embryo cavity –
Endosperm cavity volume (Venc) The volume of endosperm cavity –
Grain surface area (SAg) The surface area of grain 3D image –
Endosperm surface area (SAen) The surface area of endosperm 3D image –
Embryo surface area (SAem) The surface area of embryo 3D image –
Cavity surface area (SAc) The surface area of cavity 3D image –
Grain specific surface area (SSAg) The ratio of grain surface to volume SAg/Vg
Endosperm specific surface area (SSAen) The ratio of endosperm surface to volume SAen/Ven
Embryo specific surface area (SSAem) The ratio of embryo surface to volume SAem/Vem
Cavity specific surface area (SSAc) The ratio of cavity surface to volume SAc/Vc
Endosperm volume ratio (VRen) The ratio of endosperm volume to grain volume Ven/Vg
Embryo volume ratio (VRem) The ratio of embryo volume to grain volume Vem/Vg
The cavity volume ratio (VRc) The ratio of cavity volume to grain volume Vc/Vg
Subcutaneous cavity volume ratio (VRsc) The ratio of subcutaneous cavity volume to grain volume Vsc/Vg
Embryo cavity volume ratio (VRemc) The ratio of embryo cavity volume to grain volume Vemc/Vg
Endosperm cavity volume ratio (VRenc) The ratio of endosperm cavity volume to grain volume Venc/Vg
Density (DE) The ratio of grain mass to volume mg/Vg
set as follows: the grain mass was 30 g, the rotation speed was 1200 rpm, and the time was 80 s. A two sieve method was used to sift the granules after milling; a 5 mm-sieve was placed on a 2-mm sieve that was fitted with a receiv-ing pan. The two sets of sieves and pans were stacked on top of each other. After sieving, the maize meal adhering to the bottom of the 5-mm sieve was gently brushed off into the 2-mm sieve and the 5-mm sieve was weighed (W5mm). The maize meal adhering to the bottom of 2-mm
sieve was brushed off into the receiving pan and the 2-mm sieve was weighed (W2mm). The empty receiving
pan weight (Wp), weighed after the sieving and shaking
step, was deducted from that of the pan. The breakage rate (BR) was determined according to the equation:
The BR measurements were replicated three times for each variety.
Data analysis
ANOVA was performed to compare averages for the respective measurements (breakage rate, volume, area, volume ratio, shape size, sphericity, and density). Corre-lation analyses were performed using SPSS 19.0. Spear-man’s rank correlation coefficients were used to test relationships between breakage rates and variable param-eters. A stepwise regression was performed by SPSS 19.0 to determine the relationship between the breakage rate and the variable, which is a powerful independent vari-able selection, and the varivari-able with significant influence on component remained. All variables in the regression were checked to see if any could be removed, using the greater than 5% significance criterion. The process con-tinued until no variables could be added or removed. The remaining variable was used for further analysis. After analyzing the relationship between parameters and breakage rate by stepwise regression, a linear regression equation was established and correlations were examined as well. The path analysis revealed the direct and indirect influence of detected indicators on the dependent varia-ble, which showed the interaction among the parameters. Based on the result of the stepwise regression and cor-relation analysis, the direct path coefficients were simul-taneously obtained, then the indirect path coefficients of each independent variable were completed using correla-tion analysis × direct path coefficients [31].
Result
The breakage rate of the tested varieties
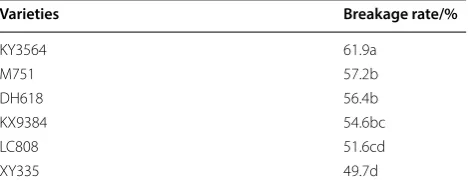
The grain breakage rate is one of the most concerning issues in production. The breakage resistances of the six tested varieties were significantly different (Table 2). There were significant differences between the breakage
(1) BR= Wp/
W5mm+ W2mm+ Wp
rates of the six varieties, of which KX3564 was the most vulnerable and XY335 was the most resistant to break-age. This method can be used to distinguish the differ-ence in breakage rate of different varieties.
Comparison of morphology and internal structure parameters of different varieties
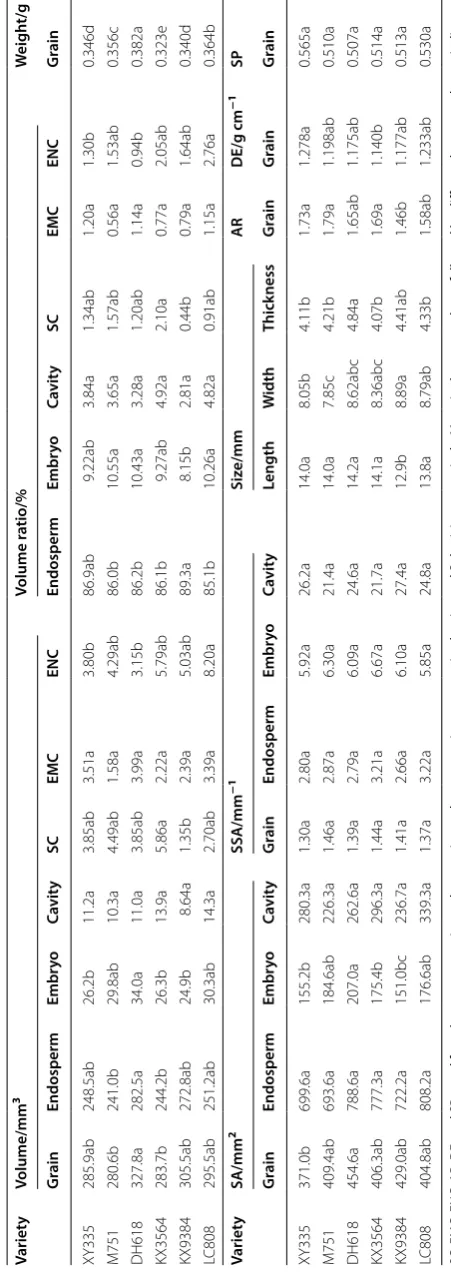
As shown in Table 3, the volumes of grain, endosperm, and embryo for DH618 were significantly higher than other varieties, and the volume was significantly lower for M751 and KX3564 compared to the other varieties. The endosperm and seed coat volume of the six varieties accounted for 86.0–89.3% of the whole grain volume, the embryo accounted for 8.15–10.6% of the grain volume, and the cavity accounted for 2.81–4.92% of the grain vol-ume. The specific surface area is the ratio of the surface area to the grain volume. Grains with a more irregular grain shape had larger specific surface areas. Specific sur-face area was used to characterize the shape features. The positions of the cavities in the interior of the grains were dispersed, and the shapes and sizes were different leading to the largest specific surface area of the cavity.
The cavity was divided into three parts to analyze the effect on grain properties. The endosperm cavity volume of KX3564 and LC808 were higher than the subcutane-ous and embryo cavities, and their volume ratio was the largest of the six varieties (Table 3). The volume and vol-ume ratio of XY335, M751, and KX3564 were similar between the subcutaneous and endosperm cavities. As expected, the embryo had the least cavity volume and volume ratio among the three parts. In addition, DH618 had the largest subcutaneous cavity volume and propor-tion among the three parts, while the endosperm cavity volume was significantly smaller than other varieties.
The length, width, thickness, aspect ratio, and spheric-ity are important parameters of the external morphol-ogy, which can reflect grain characteristics of different varieties. As shown in Table 3, the length of the six test varieties was between 12.9 and 14.2 mm, the width
Table 2 Comparison of breakage rates between six grain varieties
Mean in the same column followed by different lower case letters indicate a significant difference (P < 0.05)
Varieties Breakage rate/%
KY3564 61.9a
M751 57.2b
DH618 56.4b
KX9384 54.6bc
LC808 51.6cd
Table 3 C omparison of str uc tur al par amet ers of diff er en t v arieties
SC, EMC, ENC, AR, DE
, and SP stand f
or subcutaneous ca
vit y, embr yo ca vit y, endosper m ca vit y, aspec t r atio , densit
y, and Spher
icit y r espec tiv ely . M
ean in the same c
olumn f ollo w ed b y diff er en t lo w
er case lett
ers indica te a sig nifican t diff er enc e (P < 0.05). A ll da ta abo ve w as also sho w ed b y figur
e in the A
was between 7.85 and 8.89 mm, and the thickness was between 4.07 and 4.84 mm. Grain width and thick-ness were significantly different among the 6 varieties. KX9384 had the shortest length and the longest width and, therefore, the lowest aspect ratio. M751 had the shortest width and the highest aspect ratio value in com-parison with other varieties.
The sphericity value reflects the shape characteristics of the grain. The largest and smallest sphericity values of the six varieties were 0.565 and 0.507, respectively. The aver-age weight differed significantly among the six varieties; the highest and lowest weights were 0.382 g and 0.323 g for DH618 and KX3564, respectively.
The cavity volume was included in the μCT density measurements. The density was measured using X-ray μCT and significantly influenced the breakage rate (Fig. 4). The grain density of XY335 was significantly higher than that of the other varieties and breakage rate decreased as density increased.
The correlation analysis of morphology, structural parameters, and the breakage rate based on the X‑ray μCT results
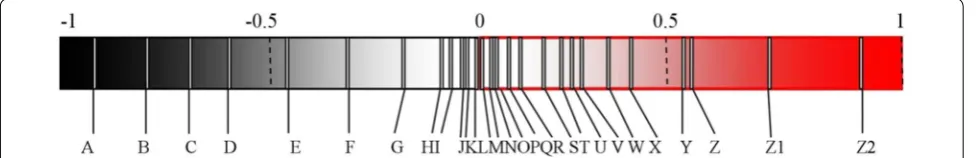
Figure 4 shows a correlation analysis of the morphol-ogy and structural parameters of grain related to break-age rate. The color from black (negative correlation) to white (no correlation) to red (positive correlation) rep-resents the correlation degree range from − 1 to 1; the
color is darker as the correlation increases. The cut-off of
− 1 and 1 indicates perfect correlation. The value left of − 0.5 and right of 0.5 represent the parameters that were
significantly relevant to the breakage rate. The regres-sion coefficients, from − 0.5 to 0 and from 0 to 0.5,
rep-resent negative and positive correlations with breakage rate, respectively, which did not reach significance. The parameters that positively correlated with the break-age rate include specific surface area, three-dimensional size (length, width, and thickness), aspect ratio, cavity
volume, surface area (grain, endosperm, and embryo), embryo volume ratio, and cavity volume and its pro-portion. Grain specific surface area (r = 0.758*), embryo specific surface area (r = 0.927**), subcutaneous cavity volume ratio (0.581*), and subcutaneous cavity volume (0.589*) are significantly and positively correlated with breakage rate.
The parameters that negatively correlated with break-age rate include sphericity, density, volume (grain, endosperm, and embryo), cavity specific surface area, and endosperm volume ratio. The correlation of the cav-ity specific surface area (− 0.628*) and the grain density (r = − 0.934**) to breakage rate reached significance. Interestingly, the breakage rate was negatively corre-lated with sphericity (r =− 0.714*), which indicates that the more spherical a grain, the harder the grain is to break. Meanwhile, the breakage rate was negatively cor-related with grain weight, which indicates that heavier kernels are more difficult to break. However, the influ-ence of grain weight on breakage was not significant (r =− 0.370).
Stepwise regression and path analysis
Stepwise regression had a very strong ability to discriminate all studied shape and structural parameters in terms of the combined effect on the breakage rate. Through stepwise regression analysis, according to partial regression coeffi-cients, equation intercepts, and significance of test results, the following linear regression equation was obtained:
X1, X2, X3, and X4 represent the grain specific surface area, subcutaneous cavity volume, sphericity, and den-sity, respectively.
The direct regression coefficients of independent variables X1, X2, X3, and X4 for Y were r1y=− 0.0765,
r2y= 0.3016, r3y= 0.1275, and r4y= − 1.0135, respectively
(2) Y =1.49315−0.00012X1+0.00830X2
+0.24457X3−0.87871X4, R2=0.99972
Fig. 4 Correlation analysis of grain morphology and structural parameters with breakage rate. From left to right: A: Density (− 0.934**); B: Sphericity
(− 0.714*); C: The cavity specific surface area (− 0.628*); D: Embryo cavity volume ratio (− 0.551); E: Embryo cavity volume (− 0.436); F: Grain weight
(− 0.371); G: Cavity surface area (− 0.138); H: Endosperm volume ratio (− 0.063); I: Endosperm cavity volume (− 0.049); J: Embryo volume ratio
(− 0.015); K: Endosperm volume ratio (− 0.014); L: Endosperm volume (− 0.004). M: Thickness (0.001); N: Width (0.007); O: Embryo volume (0.011);
and the significance of the regression coefficients were 0.1491, 0.0048, 0.1099, and 0.0015, respectively. Because the significance of regression coefficients of X1 and X3 were greater than 0.05, stepwise regression was done again. Through stepwise regression, the final linear regression equation was obtained as follows:
The direct correlation coefficients of X2 and X4 to Y were 0.965 and − 0.993 respectively. The significance of
the regression coefficients were 0.008 and 0.001 respec-tively, which were less than 0.05. Equation 3 can be used as a regression equation for correlation factors for the breakage rate.
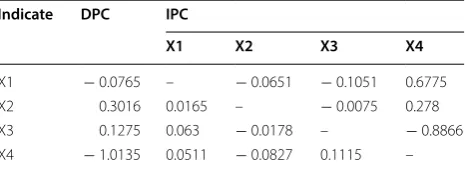
As shown in Table 4, among the four independent vari-ables with direct effects on breakage rate, the density (X4) had the largest effect, followed by the volume of subcu-taneous cavity (X2), and then the sphericity (X3) and the grain specific surface area (X1). Subcutaneous cav-ity volume and denscav-ity were the most important factors influencing the breakage rate. In particular, grain density played the most important role of the four major factors. X1 and X3 had indirect effects on breakage rates through the effects on density, with indirect path coefficients of 0.6775 and − 0.8866.
Discussion
In this study, the three-part volume and its proportion of the grain were calculated using X-ray µCT. The aver-age volume of the six grain varieties was 296 mm3 and
the cavities ratio accounted for 2.81–4.92% of the grain volume. The endosperm and seed coat volume of the six varieties accounted for 86.0–89.3% and the embryo accounted for 8.15–10.6% of the grain volume (Table 3). The report by Gustin et al. [16] showed that cavities account for up to 13% of the volume of some maize grain. Guelpa [28] demonstrated that the cavities volume ratio for all 16 kernels accounted for 0.24–3.34% of the grain volume, and the soft hybrid (0.96–4.4%) was signifi-cantly higher than that of the hard hybrid (0.27–1.51%).
(3) y=1.381+0.010X2−0.724X4, R2=0.991
These findings suggest that different research materials and determination methods produce different results. KX3564 had the smallest grain volume and the largest cavity proportion. At the same time, KX3564 had the smallest density and the largest breakage rate. Although the cavity volume ratio was positively correlated with the breakage rate, this correlation was not significant but contributed to the high breakage of grain. The cavity mainly exists in the floury endosperm and the grain vari-eties with larger floury endosperm have more cavities. A lower ratio of vitreous endosperm/floury endosperm indicated that the variety had low-density. Therefore, the breakage rate was higher compared to other varieties.
Based on the data in Fig. 4 and the stepwise regression analysis, the shape (grain specific surface area, spheric-ity), geometry parameters (subcutaneous cavity volume), and physical characteristics (density) were the main fac-tors influencing the breakage rate. Density and subcuta-neous cavity volume were directly relevant to breakage rate and the shape parameters were indirectly related to the breakage rate through the density. Subcutaneous cavity volume and its ratio significantly and positively correlated with breakage rate. However, the size of the endosperm cavity had little effect on the grain break-age rate. In our study, the correlation analysis between breakage rate and grain dimensions indicated that the higher grain breakage rate was associated with longer, wider, thicker kernels. These results agree with previous theoretical and experimental studies [7, 32]. The spheric-ity value reflects the shape characteristics of the grain, the higher the sphericity, the higher the globularity. The length, width, and thickness of grain affected the break-age rate through the influence on sphericity, which sig-nificant negatively correlated with the breakage rate.
Kernel density is highly correlated with other meas-ures of hardness, including milling characteristics [12, 16,
33, 34]. According to the data in Fig. 4, there is a nega-tive correlation between breakage rate and both quality and density; the higher breakage rate of grain accompa-nies low quality and density. Vyn et al. [1] emphasized that lower grain weight was associated with increased breakage susceptibility but had no significant relation-ship and breakage-resistant grain tended to be denser than breakage-susceptible grain. The results of this tradi-tional analysis are consistent with our X-ray µCT results. Through stepwise regression and path analysis, we deter-mined the main parameters affecting grain breakage rate. The results indicated that grain density and subcu-taneous cavity volume are the two most important fac-tors affecting grain breakage rate among the parameters examined in this paper. Grain density plays a vital role in grain breakage. The accuracy of the density measurement was tested by comparing the estimated kernel density
Table 4 Direct and indirect path coefficients for principal components
DPC and IPC stand for direct path coefficient and indirect path coefficient respectively
Indicate DPC IPC
X1 X2 X3 X4
X1 − 0.0765 – − 0.0651 − 0.1051 0.6775
X2 0.3016 0.0165 – − 0.0075 0.278
X3 0.1275 0.063 − 0.0178 – − 0.8866
with other measurement methods. We concluded that accurate grain densities were obtained using X-ray μCT technology, which could exclude cavities that would neg-atively influence results.
The research on maize grain breakage rate was mainly concentrated in the 1960–1990s, which was consistent with the period when mechanical grain harvesting tech-nology was widely popularized [35]. With the develop-ment of science and technology, the internal structure information of grain can now be obtained by X-ray µCT technology, which facilitates deep analyses of the factors affecting grain breakage. In the past, maize grain volume, surface area, and sphericity were difficult to acquire. Thus, the impact of these parameters on the break-age rate was difficult to determine. X-ray µCT technol-ogy can easily obtain the geometric, morphological, and structural parameters and perform the correlative fac-tor analysis. The objective of this paper was to obtain the main parameters that are related to the breakage rate using X-ray µCT scanning. This information facilitates the management of field production and breeding.
This is a preliminary study on the factors affecting the breakage rate of different varieties using X-ray μCT. The measurement of each variety was made using only three grain samples, which do not entirely reflect the real vari-ety of characteristics. Varieties with large differences in breakage rates should be selected to determinate geom-etry and morphology parameters from single ears in more detailed future research. A large number of grains will be used to identify the variability of characteristics and analyze the discrepancy source in the breakage rate. Kernel injury during harvest increases significantly when the moisture content is above 20%, but the actual mois-ture content for harvest is from 20 to 35% grain-moismois-ture range. The moisture content causes negative effects on maize harvest quality and mass. Next, investigations will focus on the effect of grain geometric and morphology parameters on the breakage rate during the dehydration process, because little detailed research has been con-ducted in this area.
Conclusion
The relationship between maize grain shape and breakage rate attracted little attention and has been reported rarely in recent years. In this study, X-ray μCT technology pro-vided 28 parameters, including grain size (length, width, thickness, aspect ratio, and sphericity), spatial geometric characteristics (the volume and proportion of the grain, endosperm, seed coat, embryo, and cavity and surface area), grain density, and other characteristic parameters of maize grain. Using X-ray μCT, cavity volumes can also be quantified in three parts (endosperm, embryo,
and subcutaneous) and the size and distribution of dif-ferent parts can be determined. To our knowledge, this is the first report where the cavity volume is divided into three parts and the volume proportions can be obtained. The results show that the following parameters positively correlate with breakage rates: specific surface area, three-dimensional size (length, width, and thickness), aspect ratio, cavity volume, surface area (grain, endosperm, and embryo), embryo volume ratio, and cavity volume and proportions. The parameters negatively correlated with breakage rate include sphericity, density, volume (grain, endosperm, and embryo), cavity specific surface area, and endosperm volume ratio. Correlation and stepwise regression analysis were used to identify the main param-eters that influence grain breakage. The results indicate that subcutaneous cavity volume and density are of importance to breakage rates. Other factors (grain spe-cific surface area and sphericity) have indirect effects on grain breakage rate through the density.
Supplementary information
Supplementary information accompanies this paper at https ://doi.
org/10.1186/s1300 7-019-0538-1.
Additional file 1. Additional figures.
Abbreviations
μCT: micro-computed tomography; SBT: Stein breakage tester; WBT: Wisconsin breakage tester; W: width; L: length; T: thickness; AR: aspect ratio; mg: weight; Vg: grain volume; Ven: endosperm volume; Vem: embryo volume; Vc: cavity volume; Vsc: subcutaneous cavity volume; Vemc: embryo cavity volume; Venc: endosperm cavity volume; SAg: grain surface area; SAen: endosperm surface area; SAem: embryo surface area; SAc: cavity surface area; SSAg: grain specific surface area; SSAen: endosperm specific surface area; SSAem: embryo specific surface area; SSAc: cavity specific surface area; VRen: endosperm volume ratio; VRem: embryo volume ratio; VRc: cavity volume ratio; VRsc: subcutaneous cavity volume ratio; VRemc: embryo cavity volume ratio; VRenc: endosperm cavity volume ratio; DE: density; SP: sphericity; SC: subcutaneous cavity; EMC: embryo cavity; ENC: endosperm cavity; DPC: direct path coefficient; IPC: indirect path coefficient.
Acknowledgements
We thank Dr. Xinyu Guo, from Beijing Agricultural Information Technology Research Center for providing the X-ray CT scanner and sincere help from their teams.
Authors’ contributions
All authors have made significant contributions to this research. SL and KW conceived and designed the experiments. JH, YZ, PD, and YG performed experiments. JH conducted data analysis. SL, KW, JH, and YF interpreted data analysis. SL, XJ, KW, and YF provided suggestions on the experiment writing. JH drafted the manuscript. All authors read and approved the final manuscript.
Funding
This study was supported by the National Key Research and Development Program of China (2016YFD0300101), the China Agriculture Research System (CARS-02-25), and the Agricultural Science and Technology Innovation Project of Chinese Academy of Agricultural Sciences.
Availability of data and materials
are the original data of X-ray CT scanning and the measured data, which were processed according to the test requirements. The data is reliable and the processing is standardized. All generated or analyzed data during this study are included in this published article. This article is not published nor is under publication elsewhere.
Ethics approval and consent to participate Not applicable.
Consent for publication Not applicable.
Competing interests
The authors declare that they have no competing interests.
Author details
1 Institute of Crop Science, Chinese Academy of Agricultural Sciences,
Beijing 100081, China. 2 Beijing Agricultural Information Technology Research
Center, Beijing Key Laboratory of Digital Plants, Beijing 1000973, China. 3
Agri-cultural College of Shihezi University, Shihezi 832003, China. 4 Chuxiong State
Research and Extension Institute of Agricultural Science, Chuxiong 675000, China.
Received: 24 May 2019 Accepted: 3 December 2019
References
1. Vyn TJ, Moes J. Breakage susceptibility of corn kernels in relation to crop management under long growing season conditions. Agron J. 1988;80:915–20.
2. Duarte AP, Mason SC, Jackson DS, Kiehl JDEC. Grain quality of Bra-zilian maize genotypes as influenced by nitrogen level. Crop Sci. 2005;45:1958–64.
3. Tsai CY, Huber DM, Glover DV, Warren HL. Relationships of N deposition on grain yield and N response of maize hybrids. Crop Sci. 1984;24:277–81. 4. Mensah JK, Herum FL, Blaisdell JL, Stevens KK. Effect of drying
condi-tion on impact shear resistance of selected corn varieties. Trans ASAE. 1981;24:1568–72.
5. Moentono MD, Darrah LL, Zuber MS, Krause GF. Effects of selection for stalk strength on response to plant density and level of nitrogen applica-tion in maize. Maydica. 1984;29:431–52.
6. Paulsen MR, Hill LD, White DG, Spague GF. Breakage susceptibility of corn-belt genotypes. Trans ASAE. 1841;1983(26):1830–6.
7. Leford DR, Russell WA. Evaluation of physical grain quality in the BS17 and BSI (HS)CI synthetics of maize. Crop Sci. 1985;25:471–6.
8. Waelti H, Buchele WF, Farrell M. Progress report on losses associated with corn harvesting in Iowa. J Agric Eng Res. 1969;14:134–8.
9. Martin CR, Converse HH, Czuchajowska Z, Lai FS, Pomeranz Y. Breakage susceptibility and hardness of corn kernels of various sizes and shapes. Appl Eng Agric. 1987;3:104–13.
10. Wichser WR. The world of corn processing. Am Miller Process. 1961;89:29–31.
11. Bergquist R, Thompson D. Corn grain density characterized by two spe-cific gravity techniques. Crop Sci. 1992;32:1287–90.
12. Blandino M, Ciromancini M, Peila A, Rolle L, Vanara F, Reyneria A. Determination of maize kernel hardness: a comparison of different laboratory tests to predict dry-milling performance. J Sci Food Agric. 2010;90:1870–8.
13. Landis EN, Keane DT. X-ray microtomography. Mater Charact. 2010;61:1305–16.
14. Baker DR, Mancini L, Polacci M, et al. An introduction to the application of X-ray microtomography to the three-dimensional study of igneous rocks. Lithos. 2012;148:262–76.
15. Lim KS, Barigou M. X-ray micro-computed tomography of cellular food products. Food Res Int. 2004;37:1001–122.
16. Gustin JL, Jackson S, Williams C, Patel A, Armstrong PR, Peter GF, et al. Analysis of maize (Zea mays) kernel density and volume using micro-computed tomography and single-kernel near infrared spectroscopy. J Agric Food Chem. 2013;61:10872–80.
17. Laverse J, Mastromatteo M, Frisullo P, et al. X-ray microtomography to study the microstructure of cream cheese-type products. J Dairy Sci. 2011;94:43–50.
18. Laverse J, Mastromatteo M, Frisullo P, et al. Fat microstructure of yogurt as assessed by x-ray microtomography. J Dairy Sci. 2011;94:668–75. 19. Laverse J, Mastromatteo M, Frisullo P, et al. X-ray microtomography to
study the microstructure of mayonnaise. J Food Eng. 2012;108:225–31. 20. Donis-González IR, Guyer DE, Pease A, et al. Internal characterisation of fresh agricultural products using traditional and ultrafast electron beam X-ray computed tomography imaging. Biosyst Eng. 2014; 117: 104–113. 21. Kotwaliwale N, Singh K, Kalne A, Jha SN, Seth N, Kar A. X-ray imaging
methods for internal quality evaluation of agricultural produce. J Food Sci Technol. 2014;51:1–15.
22. Zhu LJ, Dogan H, Gajula H, et al. Study of kernel structure of high-amylose and wild-type rice by X-ray microtomography and SEM. J Cereal Sci. 2012;55:1–5.
23. Weglarz WP, Goudappel GJW, Dalen GV, et al. Real-time assessment of the internal porous structure of cereal materials under high-moisture condi-tions using 3D MRI and XRT. Magn Reson Imaging. 2007;25:590–590. 24. Du JJ, Zhang Y, Guo XY, Ma LM, Shao M, Pan XD, Zhao CHJ. Micron-scale
phenotyping quantification and three dimensional microstructure recon-struction of vascular bundles within maize stalks based on micro-CT scanning. Funct Plant Biol. 2017;44:10–22.
25. Pan XD, Ma LM, Zhang Y, et al. Three-dimensional reconstruction of maize roots and quantitative analysis of metaxylem vessels based on X-ray micro-computed tomography. Can J Plant Sci. 2018;98:457–66. 26. Holbrook NM, Ahrens ET, Burns MJ, Zwieniecki MA. In vivo observation of
cavitation and embolism repair using magnetic resonance imaging. Plant Physiol. 2001;126:27–31.
27. Brodersen CR, Mcelrone AJ, Choat B, et al. The dynamics of embolism repair in xylem: in vivo visualizations using high-resolution computed tomography. Plant Physiol. 2010;154:1088–95.
28. Guelpa A, Plessis A, Kidd M, et al. Non-destructive estimation of maize (Zea mays L.) kernel hardness by means of an x-ray micro-computed tomography (μCT) density calibration. Food Bioprocess Technol. 2015;8:1419–29.
29. Schoeman L, Williams P, Plessis AD, et al. X-ray micro-computed tomog-raphy (μCT) for non-destructive characterisation of food. Trends Food Sci Technol. 2015;47:10–24.
30. Ahmadi M, Wiebold WJ, Beuerlein JE, et al. Agronomic practices that affect corn kernel characteristics. Agron J. 1993;85:615–9.
31. Sreckov Z. Correlation and path analysis of grain yield and morphological traits in test-cross populations of maize. Clin Endocrinol. 2011;37:309–16. 32. Miller BS, Hughes JW, Rousser R, Pomeranz Y. Measuring the breakage
susceptibility of shelled corn. Cereal Food World. 1981;26:75–80. 33. De Carvalho MLM, Van Aelst AC, Van Eck JW, Hoekstra FA. Pre-harvest
stress cracks in maize (Zea mays L.) kernels as characterized by visual, X-ray and low temperature scanning electron microscopical analysis: effect on kernel quality. Seed Sci Res. 1999;9:227–36.
34. Landoni M, Cerino Badone F, Nabil H, et al. Low phytic acid 1 mutation in maize modifies density, starch properties, cations, and fiber contents in the seed. J Agric Food Chem. 2013;61:4622–30.
35. Wang KR, Li SHK. Analysis of influencing factors on kernel dehydration rate of maize hybrids. Sci Agric Sinica. 2017;50:2027–35.
Publisher’s Note