R E S E A R C H
Open Access
Functional changes in adipose tissue in a
randomised controlled trial of physical activity
Per Sjögren
1,2, Justo Sierra-Johnson
1,3, Lena V Kallings
4,5, Tommy Cederholm
2, Maria Kolak
1, Mats Halldin
6,
Kerstin Brismar
7, Ulf de Faire
6, Mai-Lis Hellénius
5and Rachel M Fisher
1*Abstract
Background:A sedentary lifestyle predisposes to cardiometabolic diseases. Lifestyle changes such as increased physical activity improve a range of cardiometabolic risk factors. The objective of this study was to examine whether functional changes in adipose tissue were related to these improvements.
Methods:Seventy-three sedentary, overweight (mean BMI 29.9 ± 3.2 kg/m2) and abdominally obese, but otherwise healthy men and women (67.6 ± 0.5 years) from a randomised controlled trial of physical activity on prescription over a 6-month period were included (control n = 43, intervention n = 30). Detailed examinations were carried out at baseline and at follow-up, including fasting blood samples, a comprehensive questionnaire and subcutaneous adipose tissue biopsies for fatty acid composition analysis (n = 73) and quantification of mRNA expression levels of 13 candidate genes (n = 51), including adiponectin, leptin and inflammatory cytokines.
Results:At follow-up, the intervention group had a greater increase in exercise time (+137 min/week) and a greater decrease in body fat mass (−1.5 kg) compared to the control subjects (changes of 0 min/week and−0.5 kg respectively). Circulating concentrations of adiponectin were unchanged, but those of leptin decreased significantly more in the intervention group (−1.8 vs−1.1 ng/mL for intervention vs control,P< 0.05). The w6-polyunsaturated fatty acid content, in particular linoleic acid (18:2w6), of adipose tissue increased significantly more in the intervention group, but the magnitude of the change was small (+0.17 vs +0.02 percentage points for intervention vs control, P< 0.05). Surprisingly leptin mRNA levels in adipose tissue increased in the intervention group (+107% intervention vs−20% control,P< 0.05), but changes in expression of the remaining genes did not differ between the groups. Conclusions:After a 6-month period of increased physical activity in overweight elderly individuals, circulating leptin concentrations decreased despite increased levels of leptin mRNA in adipose tissue. Otherwise, only minor changes occurred in adipose tissue, although several improvements in metabolic parameters accompanied the modest increase in physical activity.
Keywords:Adipose tissue, Physical activity, Fatty acid composition, Gene expression
Introduction
The number of obese individuals worldwide has increased dramatically during the last couple of decades. Obesity strongly predisposes to cardiometabolic diseases and hence, a vast number of people are characterized with a poor health prognosis.
A major contributor to the obesity epidemic in modern societies is a sedentary lifestyle and low levels of daily
physical activity have a negative effect on many phy-siological pathways [1]. Increased physical activity, as induced for example by an individualised written pre-scription, has been shown to improve a spectrum of clinical risk markers, and hence cardiometabolic risk [2-4]. Furthermore, increasing the degree of physical ac-tivity, as one part of a healthier lifestyle, has shown even greater efficiency than pharmacotherapy in preventing the onset of type 2 diabetes [5]. Such data clearly support the promotion of physical activity as a key factor in the battle of primary prevention. Metabolic pathways that are affected by increased physical activity include weight * Correspondence:[email protected]
1
Atherosclerosis Research Unit, Department of Medicine, (Solna) Karolinska Institutet, Stockholm, Sweden
Full list of author information is available at the end of the article
regulation, glucose and lipid handling capacities, hemo-dynamics, hormonal balance and inflammatory state [6-8]. All of these variables are recognised components of the unfavourable metabolic state called the metabolic syn-drome. However, the mechanisms at the molecular level by which changes in physical activity lead to improve-ments in metabolic parameters have not been fully eluci-dated. One possibility is that changes in adipose tissue metabolism and function are involved, either directly or indirectly, in these metabolic improvements.
Obesity is tightly related to insulin resistance and adi-pose tissue is an important endocrine organ that produces adipokines that can affect metabolic and inflammatory pathways, predominantly in an autocrine/paracrine fash-ion, but also systemically [9-11]. Relationships between many of these adipokines (such as adiponectin, leptin,
IL-6 and TNFα) and insulin resistance have been
de-scribed [12,13]. Obesity and insulin resistance are strong-ly associated with local inflammation and macrophage accumulation within adipose tissue, and a direct relation-ship between adipose tissue inflammation and insulin re-sistance has been proposed [12,14,15]. However, more recently a “house keeping”role of adipose tissue macro-phages in the regulation of adipocyte lipolysis has been suggested [16], indicating the complexity of the relation-ship between local inflammation, adipose tissue function and obesity/insulin resistance.
Another important aspect of adipose tissue metabolism in relation to components of the metabolic syndrome is the fatty acid composition of stored triglycerides. A higher content of saturated fatty acids has been described in adipose tissue from obese compared to overweight individuals [17], while a diet rich in saturated fatty acids promoted expression in adipose tissue of genes involved in inflammation [18]. Estimates of the activity of stearoyl CoA desaturase (SCD) in adipose tissue have been posi-tively correlated to insulin resistance [19] and obesity [20], possibly suggesting an increased desaturation of adipose tissue fatty acids by SCD in response to (and to cope with) an unfavourable increase in saturated fatty acids.
Therefore in this randomized controlled trial in over-weight individuals we investigated whether increases in physical activity over a 6-month period induced changes in subcutaneous adipose tissue as assessed by changes in i) circulating adiponectin and leptin concentrations, ii) adipose tissue fatty acid composition, and iii) expression in adipose tissue of genes encoding key proteins.
Materials and methods
Study subjects and study design
Study design and study participants have been described in detail elsewhere [3]. In brief, 101 overweight (BMI
≥25 kg/m2 and <40 kg/m2), centrally obese (waist
cir-cumference ≥102 cm in men and ≥88 in women) [21],
physically inactive, but otherwise healthy individuals
(67–68 years) were recruited from a Stockholm
county-cohort [22] to participate in a life-style intervention study over 6 months. Recruitment took place between January and June 2006. The present study of adipose tissue was completed at the 6 month follow-up. The study was per-formed at Karolinska University Hospital, Huddinge. Par-ticipants were randomized in parallel fashion to either a control group (n = 54) or to an exercise intervention group (n = 47) with a baseline and a 6 month follow-up. Calen-dar days were randomised as either control or interven-tion days to prevent discussions between subjects in the different groups. Study participants and staff, apart from those staff directly involved in the intervention, were blinded to intervention status. Blood samples were taken after an overnight fast. In 73 of the subjects (29 men, 44 women), it was possible to take a subcutaneous abdom-inal adipose tissue biopsy approximately 5 cm lateral to the umbilicus at baseline and again after 6 months under local anaesthesia by needle biopsy. However, the collec-tion of biopsies was not evenly distributed across the two groups: n = 43 control, n = 30 intervention. The fatty acid composition of these biopsies was determined (see below). In a subset of biopsies (n = 51, 21 men, 30 women), in which there was sufficient material for RNA extraction, gene expression analysis was performed. These indivi-duals from whom adipose tissue biopsies were taken (n = 73 for fatty acid composition and n = 51 for gene ex-pression analysis) represent the current study population. The primary outcomes were differences between the in-tervention and control groups in changes in adipose tis-sue metabolism as assessed by circulating adiponectin and leptin concentrations and adipose tissue fatty acid composition and gene expression.
vegetables, fruit or seafood increased, or if consumption of candy, buns, snacks, high fat cheese, pizza or soda decreased. If individuals improved their consumption of at least three of these food groups they were categorised as having favourably changed their diet.
The Ethics Committee of Karolinska Institutet ap-proved the study and all subjects gave informed consent to participate.
Assessment of anthropometry and cardiometabolic risk factors
Anthropometric measurements, body fat mass (bioelec-trical bioimpedance) and blood pressure were assessed as described [3]. Glucose, glycosylated haemoglobin (HbA1c), cholesterol, HDL-cholesterol, triaclyglycerol, apolipopro-tein A1 (apo A1), apolipoproapolipopro-tein B (apo B) and C-reactive protein (CRP) were analysed by accredited methods in the clinical chemistry laboratory at the Karolinska University Hospital, Huddinge. Insulin was quantified by ELISA (Dako Sweden) and adiponectin and leptin by radio-immunoassay (Linco Research, St Charles, Missouri, USA and Millipore, Billerica, MA, USA respectively). Homeo-stasis model assessment (HOMA) index was calculated as the product of fasting insulin and glucose concentra-tions divided by 22.5.
Adipose tissue fatty acid composition analysis
Fatty acids in adipose tissue-triacylglycerols were sepa-rated by gas liquid chromatography as previously de-scribed [20] and expressed as the relative molar percentage of the sum of the fatty acids analysed. The fatty acids quantified were 14:0, 15:0, 16:0, 16:1w7, 17:0, 18:0, 18:1, 18:2w6, 18:3w6, 18:3w3, 20:3w6, 20:4w6, 20:5w3, 22:4w6, 22:5w3 and 22:6w3.
RNA isolation from adipose tissue and cDNA synthesis Following collection of subcutaneous adipose tissue bi-opsies, the samples were rinsed immediately in 0.9% NaCl to remove excess blood and stored in RNAlater
(Qiagen) at −80 °C until analyzed. RNA was extracted
from approximately 150 mg tissue: homogenization in phenol-containing TRIzol (Invitrogen), DNaseI treatment and spin column purification (RNeasy, Qiagen). RNA concentrations were determined using a NanoDrop spec-trophotometer (Thermo) and the quality analyzed with an Agilent Bioanalyzer 2100 (Agilent Technologies). Isolated
RNA was stored at−80 °C until cDNA synthesis. A total
of 1 μg total RNA was used for cDNA synthesis using
oligo-(dT)12-15 primers.
Quantification of gene expression
The mRNA expression of specific genes was quantified by real time PCR using the ABI 7000 Sequence Detection System instrument and software (Applied Biosystems).
In each reaction, cDNA that had been synthesized from 15 ng of total RNA was mixed with TaqMan Universal PCR Master Mix (Applied Biosystems) and a gene-specific primer and probe mixture (pre-developed TaqMan Gene Expression Assays, Applied Biosystems)
in a final volume of 25 μl. The genes analysed and
the corresponding assays used were: 11β-hydroxysteroid
dehydrogenase type 1 (11βHSD1), Hs00194153_m1;
adi-ponectin, Hs00605917_m1; monocyte chemoattractant protein 1 (CCL2), Hs00234140_m1; CD36, Hs00169627_m1; CD68, Hs00154355_m1; cannabinoid receptor 1 (CNR1), Hs00275634_m1; cannabinoid receptor 2 (CNR2), Hs00361490_m1; interleukin 6 (IL-6), Hs00174131_m1;
leptin, Hs00174877_m1; lipoprotein lipase (LPL),
Hs00173425_m1; peroxisome proliferator activated
re-ceptor gamma (PPARγ), Hs00234592_m1; stearoyl-CoA
desaturase (SCD); Hs001682761_m1; tumour necrosis
factorα(TNFα), Hs00174128_m1; and ribosomal protein
large P0 (RPLP0), Hs99999902_m1. All samples were run in duplicate. Relative expression levels were determined using a 5-point serially diluted standard curve, generated from cDNA from human adipose tissue. Gene expression was expressed in arbitrary units and normalized relative to the housekeeping gene RPLP0 to compensate for dif-ferences in cDNA loading. Levels of RPLP0 mRNA were comparable between all subjects in the study.
Statistical analysis
Data were summarized by calculating means and stand-ard deviations (SD) or median and interquartile ranges (IQR) depending on normality of quantitative variables. Changes from baseline to follow-up were determined by
paired t-test if normally distributed or by Wilcoxon
matched-pair signed-rank test if skewed. ANCOVA, in which baseline values were taken into consideration, was used to analyse differences between the groups over the 6-month period. To investigate the ability of changes in physical activity, anthropometric measures and HbA1c (the parameters that showed significantly different responses between control and intervention groups) to predict changes in selected markers of adi-pose tissue metabolism, linear regression was applied. Skewed variables were normalised prior to analysis. All analyses were performed with the use of STATA statis-tical package (Intercooled STATA 11.0 for Windows; Stata Corp, College Station, TX), and significance was set atP< 0.05.
Results
Changes in physical activity, anthropometric measurements and metabolic status
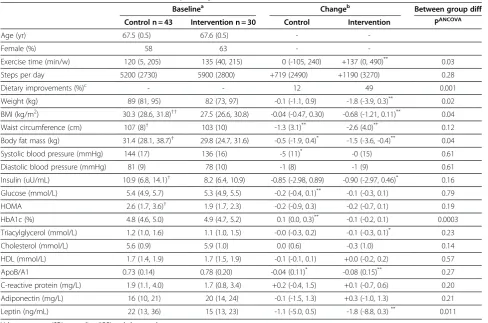
had significantly higher BMI, waist circumference, body fat mass, insulin and HOMA index than the interven-tion group. Following the 6-month period, changes in physical activity, anthropometric measurements and diet differed significantly between the groups. The intervention group demonstrated greater increases in exercise time, greater decreases in weight, BMI and body fat mass, and greater dietary improvements com-pared to the control subjects. HbA1c was lowered in the intervention compared to the control group, but there were no significant differences between the groups with regard to changes in blood pressure or circulating concentrations of insulin, lipids or CRP. Circulating con-centrations of adiponectin were unchanged over the 6-month period, with no differences between the control and intervention groups. However, concentrations of leptin decreased in both the control and intervention groups, although the decrease was greater in the inter-vention group (−1.8 vs −1.1 ng/mL for intervention vs control, P= 0.01).
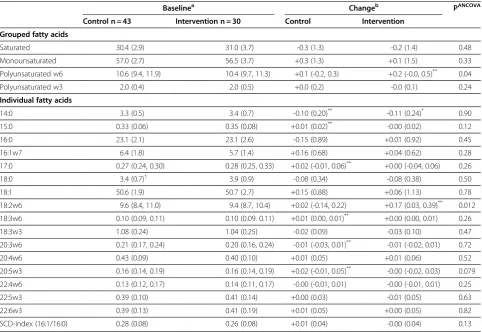
Changes in adipose tissue fatty acid composition
The adipose tissue fatty acid profiles of the control and intervention groups at baseline and their changes at 6 months are presented in Table 2. After 6 months the w6-polyunsaturated fatty acid content of adipose tissue in the intervention group increased significantly more
than in the controls (P= 0.04), which appeared to be
explained by changes in linoleic acid, 18:2w6 (+0.17 vs +0.02 percentage points for intervention vs control,
P= 0.01). There were no significant differences between the groups in changes of any other fatty acid or of an es-timate of SCD activity (the 16:1/16:0 ratio).
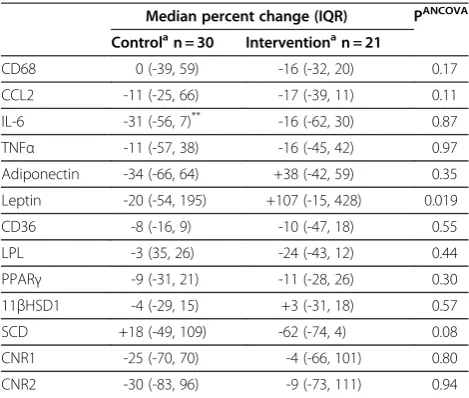
Changes in adipose tissue gene expression
Characteristics of the subset of participants from whom adipose tissue gene expression data were available are presented in Additional file 1: Table S1. Changes in sub-cutaneous adipose tissue gene expression from baseline to follow-up in control and intervention groups are shown in Table 3. After 6-months there was a significant Table 1 Baseline characteristics and follow-up changes of selected variables
Baselinea Changeb Between group diff
Control n = 43 Intervention n = 30 Control Intervention PANCOVA
Age (yr) 67.5 (0.5) 67.6 (0.5) -
-Female (%) 58 63 -
-Exercise time (min/w) 120 (5, 205) 135 (40, 215) 0 (-105, 240) +137 (0, 490)** 0.03
Steps per day 5200 (2730) 5900 (2800) +719 (2490) +1190 (3270) 0.28
Dietary improvements (%)c - - 12 49 0.001
Weight (kg) 89 (81, 95) 82 (73, 97) -0.1 (-1.1, 0.9) -1.8 (-3.9, 0.3)** 0.02
BMI (kg/m2) 30.3 (28.6, 31.8)†† 27.5 (26.6, 30.8) -0.04 (-0.47, 0.30) -0.68 (-1.21, 0.11)** 0.04
Waist circumference (cm) 107 (8)† 103 (10) -1.3 (3.1)** -2.6 (4.0)** 0.12
Body fat mass (kg) 31.4 (28.1, 38.7)† 29.8 (24.7, 31.6) -0.5 (-1.9, 0.4)* -1.5 (-3.6, -0.4)** 0.04
Systolic blood pressure (mmHg) 144 (17) 136 (16) -5 (11)* -0 (15) 0.61
Diastolic blood pressure (mmHg) 81 (9) 78 (10) -1 (8) -1 (9) 0.61
Insulin (uU/mL) 10.9 (6.8, 14.1)† 8.2 (6.4, 10.9) -0.85 (-2.98, 0.89) -0.90 (-2.97, 0.46)* 0.16
Glucose (mmol/L) 5.4 (4.9, 5.7) 5.3 (4.9, 5.5) -0.2 (-0.4, 0.1)** -0.1 (-0.3, 0.1) 0.79
HOMA 2.6 (1.7, 3.6)† 1.9 (1.7, 2.3) -0.2 (-0.9, 0.3) -0.2 (-0.7, 0.1) 0.19
HbA1c (%) 4.8 (4.6, 5.0) 4.9 (4.7, 5.2) 0.1 (0.0, 0.3)** -0.1 (-0.2, 0.1) 0.0003
Triacylglycerol (mmol/L) 1.2 (1.0, 1.6) 1.1 (1.0, 1.5) -0.0 (-0.3, 0.2) -0.1 (-0.3, 0.1)* 0.23
Cholesterol (mmol/L) 5.6 (0.9) 5.9 (1.0) 0.0 (0.6) -0.3 (1.0) 0.14
HDL (mmol/L) 1.7 (1.4, 1.9) 1.7 (1.5, 1.9) -0.1 (-0.1, 0.1) +0.0 (-0.2, 0.2) 0.57
ApoB/A1 0.73 (0.14) 0.78 (0.20) -0.04 (0.11)* -0.08 (0.15)** 0.27
C-reactive protein (mg/L) 1.9 (1.1, 4.0) 1.7 (0.8, 3.4) +0.2 (-0.4, 1.5) +0.1 (-0.7, 0.6) 0.20
Adiponectin (mg/L) 16 (10, 21) 20 (14, 24) -0.1 (-1.5, 1.3) +0.3 (-1.0, 1.3) 0.21
Leptin (ng/mL) 22 (13, 36) 15 (13, 23) -1.1 (-5.0, 0.5) -1.8 (-8.8, 0.3)** 0.011
Values are mean (SD) or median (IQR) and changes denote measure(follow-up)–measure(baseline).
Total number of individuals analysed varies slightly due to technical reasons.
a
Significant differences between groups at baseline:†P< 0.05,††P< 0.01.
b
Significant within-group changes: *P< 0.05,**P< 0.01.
c
Defined as changes (according to self-reported frequencies) in the consumption of at least three of the following dietary variables: vegetables, fruit, seafood, candy, buns, snacks, high fat cheese, pizza and soda.
difference in the change in adipose tissue leptin mRNA levels between the groups, with an increase in the
inter-vention group (+107% interinter-vention vs −20% control,
P< 0.02), a finding that was in contrast to the decreases in circulating leptin concentrations observed in both groups. There were no significant differences between groups for changes in adipose tissue expression levels of the remaining genes.
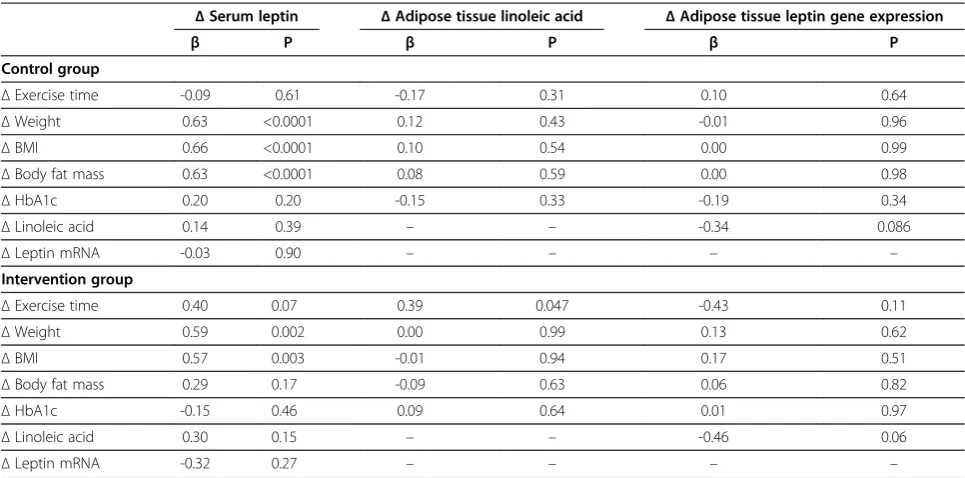
Prediction of changes in leptin and adipose tissue linoleic acid by changes in physical activity, anthropometric measures and HbA1c
Markers of adipose tissue metabolism that responded significantly differently between the control and inter-vention groups, namely changes in serum leptin concen-trations, adipose tissue linoleic acid content, and adipose tissue leptin gene expression levels, were analysed with linear regression to investigate the predictive ability of changes in physical activity (exercise time), anthropo-metric measures (weight, BMI and body fat mass), and
HbA1c (Table 4). Decreases in circulating leptin concen-trations were predicted by decreases in weight, BMI and body fat mass, but the latter was not statistically signifi-cant in the intervention group. Changes in leptin gene expression levels within adipose tissue were not signifi-cantly predicted by any of the selected parameters in ei-ther group. The only variable that explained significant variation in the change in adipose tissue linoleic acid content was change in exercise time, in the intervention group alone.
Discussion
In the present analysis, using a subset of 68 year-old overweight-to-obese men and women exposed to phys-ical activity on prescription in a randomized intervention trial for 6 months [3], we observed a decrease in circu-lating leptin concentrations, despite an increase in leptin mRNA in adipose tissue. Moreover, there was a small in-crease in the adipose tissue content of the w6 polyunsat-urated fatty acid linoleic acid (18:2w6), even though no Table 2 Baseline values and follow-up changes of fatty acids in subcutaneous adipose tissue
Baselinea Changeb PANCOVA
Control n = 43 Intervention n = 30 Control Intervention
Grouped fatty acids
Saturated 30.4 (2.9) 31.0 (3.7) -0.3 (1.3) -0.2 (1.4) 0.48
Monounsaturated 57.0 (2.7) 56.5 (3.7) +0.3 (1.3) +0.1 (1.5) 0.33
Polyunsaturated w6 10.6 (9.4, 11.9) 10.4 (9.7, 11.3) +0.1 (-0.2, 0.3) +0.2 (-0.0, 0.5)** 0.04
Polyunsaturated w3 2.0 (0.4) 2.0 (0.5) +0.0 (0.2) -0.0 (0.1) 0.24
Individual fatty acids
14:0 3.3 (0.5) 3.4 (0.7) -0.10 (0.20)** -0.11 (0.24)* 0.90
15:0 0.33 (0.06) 0.35 (0.08) +0.01 (0.02)** -0.00 (0.02) 0.12
16:0 23.1 (2.1) 23.1 (2.6) -0.15 (0.89) +0.01 (0.92) 0.45
16:1w7 6.4 (1.8) 5.7 (1.4) +0.16 (0.68) +0.04 (0.62) 0.28
17:0 0.27 (0.24, 0.30) 0.28 (0.25, 0.33) +0.02 (-0.01, 0.06)** +0.00 (-0.04, 0.06) 0.26
18:0 3.4 (0.7)† 3.9 (0.9) -0.08 (0.34) -0.08 (0.38) 0.50
18:1 50.6 (1.9) 50.7 (2.7) +0.15 (0.88) +0.06 (1.13) 0.78
18:2w6 9.6 (8.4, 11.0) 9.4 (8.7, 10.4) +0.02 (-0.14, 0.22) +0.17 (0.03, 0.39)** 0.012
18:3w6 0.10 (0.09, 0.11) 0.10 (0.09. 0.11) +0.01 (0.00, 0.01)** +0.00 (0.00, 0.01) 0.26
18:3w3 1.08 (0.24) 1.04 (0.25) -0.02 (0.09) -0.03 (0.10) 0.47
20:3w6 0.21 (0.17, 0.24) 0.20 (0.16, 0.24) -0.01 (-0.03, 0.01)** -0.01 (-0.02, 0.01) 0.72
20:4w6 0.43 (0.09) 0.40 (0.10) +0.01 (0.05) +0.01 (0.06) 0.52
20:5w3 0.16 (0.14, 0.19) 0.16 (0.14, 0.19) +0.02 (-0.01, 0.05)** -0.00 (-0.02, 0.03) 0.079
22:4w6 0.13 (0.12, 0.17) 0.14 (0.11, 0.17) -0.00 (-0.01, 0.01) -0.00 (-0.01, 0.01) 0.25
22:5w3 0.39 (0.10) 0.41 (0.14) +0.00 (0.03) -0.01 (0.05) 0.63
22:6w3 0.39 (0.13) 0.41 (0.19) +0.01 (0.05) +0.00 (0.05) 0.82
SCD-index (16:1/16:0) 0.28 (0.08) 0.26 (0.08) +0.01 (0.04) -0.00 (0.04) 0.13
Values are mean ± SD or median (IQR) and changes denote measure(follow-up)–measure(baseline). Fatty acids are presented as relative percentage of fatty acids
analysed. Saturated, sum of 14:0, 15:0, 16:0, 17:0 and 18:0; Monounsaturated, sum of 16:1 and 18:1 Polyunsaturated w6, sum of 18:2, 18:3, 20:3, 20:4 and 22:4 (all w6); and Polyunsaturated w3, sum of 18:3, 20:5, 22:5 and 22:6 (all w3).
a
Significant differences between groups at baseline:†P< 0.05.
b
dietary recommendations were given. The original study showed improvements in metabolic and anthropometric measurements after the physical activity intervention. The current objective was to evaluate if such improve-ments could be related to changes in subcutaneous adi-pose tissue metabolism, as estimated by fatty acid composition, expression of genes encoding key proteins, and circulating adiponectin and leptin concentrations.
The data presented here for anthropometric and plasma parameters in the subset of individuals from whom adipose tissue biopsies were available are in line with our previously published data from the whole co-hort [3]. While there were a number of improvements in metabolic parameters within both the control and inter-vention groups, the interinter-vention group demonstrated more favourable changes in exercise time, weight, BMI, body fat mass and HbA1c compared to the control sub-jects, despite the fact that the control group had greater BMI, waist circumference, body fat mass, insulin and HOMA index at baseline. Here we show that circulating leptin concentrations decreased, but adiponectin con-centrations were unchanged over the 6-month period of the intervention. We also report that the intervention group performed greater dietary improvements than the controls, but the extent of the dietary data was not suffi-cient for detailed investigation of nutrient composition.
While the fatty acid composition of adipose tissue reflects that of the diet over the past months to years
[23], it is also modifiable by other factors since preferen-tial uptake and release of certain fatty acids has been documented [24]. Obesity has been associated with a greater saturated fatty acid content of adipose tissue [17], and estimates of the activity of SCD within adipose tissue are increased in obesity and insulin resistance [19,20]. A study of obese subjects identified positive cor-relations between the w6-polyunsaturated fatty acid con-tent of adipose tissue and measures of obesity in three different adipose tissue depots [25], while on the other hand, a 4-month marathon-training programme resulted in significant increases in the linoleic acid (18:2w6) con-tent of subcutaneous adipose tissue in healthy men [26]. In the present study we find that 6 months of exercise on prescription resulted in a greater increase in the total w6-polyunsaturated fatty acid content of adipose tissue compared to the control group, and that linoleic acid largely accounted for this change. Since linoleic acid is preferentially retained in adipose tissue of both rats and rabbits when fatty acid mobilisation from adipose tissue is stimulated [27,28], an increase in physical activity might be expected to have similar effects. Indeed, changes in the adipose tissue linoleic acid content were not predicted by changes in weight, BMI, body fat mass or HbA1c, but the change in exercise time was a signifi-cant predictor in the intervention group, possibly impli-cating that the effect of increased physical activity on the linoleic acid content of adipose tissue was direct and not mediated via changes in adipose tissue mass or glucose control. However, changes in diet could also underlie the observation since greater dietary improvements were performed by individuals in the intervention group. However, although the dietary data were not detailed enough to permit investigation of dietary fat compos-ition, analysis of reported changes in major fat sources suggested that no apparent alterations in the intake of w6-polyunsaturated fatty acids had occurred over the intervention period. There is an ongoing debate as to whether w6-polyunsaturated fatty acids are pro- or anti-inflammatory [29], but concentrations of linoleic acid in circulating cholesteryl esters were negatively correlated to plasma concentrations of CRP [30]. Therefore the in-crease in adipose tissue linoleic acid observed in the present study could be interpreted as a beneficial change, although the magnitude of the increase is very small (0.2 percentage points) and the biological rele-vance of such a change is unknown.
The expression levels in adipose tissue of genes encod-ing a number of proteins with important roles in adipose
tissue metabolism were quantified. CCL2, IL-6, TNFα
and CD68 were selected as markers of inflammation and macrophage infiltration, which are features of insulin re-sistant adipose tissue [14]. LPL and CD36 regulate lipid influx via hydrolysis of circulating triacylglycerols and Table 3 Changes from baseline to follow-up in
subcutaneous adipose tissue gene expression
Median percent change (IQR) PANCOVA
Controlan = 30 Interventionan = 21
CD68 0 (-39, 59) -16 (-32, 20) 0.17
CCL2 -11 (-25, 66) -17 (-39, 11) 0.11
IL-6 -31 (-56, 7)** -16 (-62, 30) 0.87
TNFα -11 (-57, 38) -16 (-45, 42) 0.97
Adiponectin -34 (-66, 64) +38 (-42, 59) 0.35
Leptin -20 (-54, 195) +107 (-15, 428) 0.019
CD36 -8 (-16, 9) -10 (-47, 18) 0.55
LPL -3 (35, 26) -24 (-43, 12) 0.44
PPARγ -9 (-31, 21) -11 (-28, 26) 0.30
11βHSD1 -4 (-29, 15) +3 (-31, 18) 0.57
SCD +18 (-49, 109) -62 (-74, 4) 0.08
CNR1 -25 (-70, 70) -4 (-66, 101) 0.80
CNR2 -30 (-83, 96) -9 (-73, 111) 0.94
a
Significant within-group changes indicated: **P< 0.01.
Total number of individuals analysed varies slightly due to technical reasons. Only percent changes are reported since gene expression is quantified in arbitrary units, absolute quantification is not performed.
fatty acid uptake respectively [31], while PPARγ is a key regulator of adipogenesis and adipocyte function [32]. Of the many adipokines produced and secreted by adi-pose tissue, leptin and adiponectin are two of the most important and are adipocyte-specific. Leptin regulates intake and expenditure of energy, while adiponectin increases insulin sensitivity and is anti-inflammatory
[12]. The actions of the enzymes 11βHSD1 and SCD in
adipose tissue have both been linked to insulin resist-ance [19,33]. Endocannabinoids increase food intake and weight gain and decrease energy expenditure via activa-tion of the cannabinoid receptors CNR1 and CNR2 [34]. Activation of these receptors in the periphery (including adipose tissue) plays an important role in mediating the metabolic changes associated with obesity and insulin resistance [34]. Of these genes, changes in only the ex-pression of leptin differed significantly between the con-trol and intervention groups, with a median increase of 107% in the intervention group, compared to a median decrease of 20% in the control group. This result is un-expected given the concomitant decreases in circulating
leptin concentrations, median changes of −6% in
con-trols versus−13% in the intervention group (P= 0.01 for group comparison), and in light of the greater decrease in body weight and fat mass in the intervention group. Reports of decreased leptin concentrations in response to weight loss are widespread [35,36] and prior reports have shown decreased adipose tissue leptin expression and circulating leptin concentrations in response to
exercise, although some contradictory results have also been reported [37,38]. The opposing changes observed for leptin mRNA expression in adipose tissue (increased) and for circulating leptin concentrations (decreased), at least in the intervention group, suggest that leptin mRNA levels are a poor marker of circulating leptin, im-plicating post transcriptional regulation of the leptin gene, as has been previously demonstrated in rats [39]. Indeed, changes in leptin gene expression and changes in circulating leptin concentrations were essentially un-related to one other in the present study, which under-lines the caution that should be employed when interpreting gene expression data and the importance of determining protein concentrations. The fact that the changes in circulating leptin concentrations were signifi-cantly predicted by changes in anthropometric measures, but not by changes in exercise time, might suggest that the lowering of leptin was mediated via decreases in fat mass, rather than by a direct effect of increased physical activity. Changes in HbA1c and the adipose tissue lino-leic acid content were similarly unable to predict changes in circulating leptin.
Similar to the results presented here, a relative absence of changes in adipose tissue gene expression in response to physical activity (12-weeks of 3 supervised aerobic ex-ercise sessions/week) was reported in obese individuals
(BMI 33.3 kg/m2 at start, mean weight loss of 3.5 kg)
[40]. Only expression of adiponectin increased, while
IL-6, TNFα, CCL2, CCL3, leptin, CD68 and CD14 were all
Table 4 Linear regression analysis for changes in serum leptin, changes in adipose tissue linoleic acid content, and changes in adipose tissue leptin gene expression in relation to changes in selected variables in control and intervention groups
ΔSerum leptin ΔAdipose tissue linoleic acid ΔAdipose tissue leptin gene expression
β P β P β P
Control group
ΔExercise time -0.09 0.61 -0.17 0.31 0.10 0.64
ΔWeight 0.63 <0.0001 0.12 0.43 -0.01 0.96
ΔBMI 0.66 <0.0001 0.10 0.54 0.00 0.99
ΔBody fat mass 0.63 <0.0001 0.08 0.59 0.00 0.98
ΔHbA1c 0.20 0.20 -0.15 0.33 -0.19 0.34
ΔLinoleic acid 0.14 0.39 – – -0.34 0.086
ΔLeptin mRNA -0.03 0.90 – – – –
Intervention group
ΔExercise time 0.40 0.07 0.39 0.047 -0.43 0.11
ΔWeight 0.59 0.002 0.00 0.99 0.13 0.62
ΔBMI 0.57 0.003 -0.01 0.94 0.17 0.51
ΔBody fat mass 0.29 0.17 -0.09 0.63 0.06 0.82
ΔHbA1c -0.15 0.46 0.09 0.64 0.01 0.97
ΔLinoleic acid 0.30 0.15 – – -0.46 0.06
ΔLeptin mRNA -0.32 0.27 – – – –
unchanged [40]. However, significant decreases in
ex-pression levels of IL-6, IL-8, TNFαCD68 and CD14 and
an increase in adiponectin mRNA in adipose tissue of severely obese individuals who underwent major weight loss as a result of a 15-week lifestyle intervention
con-sisting of hypocaloric diet and at least 2–3 hours of
moderate-intensity physical activity 5 days/week (BMI
45.8 kg/m2 at start, mean weight loss of 18 kg) were
reported [41]. This suggests that substantial changes in adipose tissue mass may be required in order to result in changes at the gene expression level.
These data suggest that the lifestyle modifications implemented, although sufficient to lead to reductions in
fat mass (−0.5 kg in the controls and −1.5 kg in the
intervention group) and circulating leptin concentra-tions, were not associated with alterations in circulating adiponectin. This observation is in line with a recent re-view that concluded that mild weight loss lowers leptin concentrations, but has no clear impact on adiponectin [35]. The clinical relevance of the increased adipose tis-sue content of linoleic acid is not clear. The relatively minor changes in adipose tissue metabolism achieved in the current study might reflect the fact that changes in adipose tissue mass were only small, or that changes in metabolism were too subtle to be detected by the techniques employed (primarily fatty acid composition and gene expression analysis). However, given that some changes in circulating parameters were docu-mented (a greater improvement in HbA1c in the inter-vention compared to the control group), it may well be that modulation of adipose tissue metabolism was not directly responsible for such changes. The in-creased physical activity could have lead to alterations in other tissues, such as skeletal muscle, thereby medi-ating systemic improvements [42], but this was not investigated in the present study. Furthermore, the changes in diet (which were observed in both control and intervention groups, but greater in the latter) may have had effects on metabolism independent of those induced by an increased physical activity, but again, this remains unknown.
Strengths associated with the present study include the relatively large and homogenous study sample, as compared to previous studies in the field, and the imple-mentation of a randomised controlled design. However, the cohort was not sufficiently large to address gender-differences. One limitation is that our data are derived from subcutaneous adipose tissue, rather than from the metabolically more active visceral depot. We cannot ex-clude the possibility that different adipose tissue depots within the body would respond differently to increases in physical activity. Furthermore, adipose tissue biopsies contain a mixture of cell types, although adipocytes pre-dominate, and the cell sources of the mRNA of the
genes investigated in this study is unknown. Finally, improvements in physical activity were also seen in the control group, which, combined with the greater dietary improvements in the intervention group, makes it harder to identify changes in metabolic parameters in the inter-vention group attributable to increased physical activity.
In summary, our results show that changes occurred in adipose tissue, as documented by decreased circulat-ing leptin concentrations (despite increased leptin gene expression) and increased linoleic acid content in sub-cutaneous adipose tissue, after a 6-month period of life-style modification, primarily increased physical activity, in overweight-to-obese elderly individuals. However, these changes were relatively modest and we conclude that improvements in metabolic parameters induced by only a moderate increase in physical activity are unlikely to be driven solely by these changes in adipose tissue metabolism.
Additional file
Additional file 1:Table S1.Baseline characteristics and follow-up changes of selected variables in only those individuals from whom adipose gene expression data were available.
Abbreviations
11βHSD1: 11β-hydroxysteroid dehydrogenase type 1; apo: Apolipoprotein; CCL2: Monocyte chemoattractant protein 1 (MCP-1); CNR1: Cannabinoid receptor 1; CNR2: Cannabinoid receptor 2; CRP: C-reactive protein; HbA1c: Glycosylated haemoglobin; HOMA: Homeostasis model assessment; IL-6: Interleukin 6; IQR: Interquartile range; LPL: Lipoprotein lipase; TNFα: Tumour necrosis factorα; PPARγ: Peroxisome proliferator activated receptor gamma; RPLP0: Ribosomal protein large P0; SCD: Stearoyl CoA desaturase.
Competing interests
The authors declare that they have no competing interests.
Authors' contributions
PS participated in study design, statistical analysis, data interpretation and manuscript writing. JS-J participated in study design, data collection and manuscript writing. LVK participated in study design and data collection. TC, MK, MH and KB participated in data collection. UdF participated in study design. M-LH conceived the study, participated in study design, data collection, data interpretation and manuscript writing. RMF participated in study design, statistical analysis, data interpretation and manuscript writing. All authors read and approved the final manuscript.
Acknowledgements
We thank Birgitta Söderholm, Siw Tengblad, Peri Noori, Olivera Werngren and Fariba Foroogh for their technical assistance. The study was supported by the Stockholm County Council, the Swedish Heart and Lung Foundation, the Swedish Council for Social Research, the Swedish Research Council, the Swedish National Institute of Public Health, the Novo Nordisk Foundation, the Tornspiran Foundation, the Albert and Gerda Svensson Foundation, and the Swedish Diabetes Association. Dr Justo Sierra-Johnson was partially supported by faculty funds from the Board of Post-Graduate Education of Karolinska Institutet (KID Award) and a European Foundation for the Study of Diabetes/Lilly Research Fellowship.
Author details
1Atherosclerosis Research Unit, Department of Medicine, (Solna) Karolinska
Uppsala, Sweden.3Cardiovascular Division, Mayo Clinic Rochester, MN, USA. 4
Department of Sport and Health Sciences Swedish School of Sport and Health Sciences Stockholm, Sweden.5Unit of Cardiology, Department of
Medicine, (Solna) Karolinska Institutet Stockholm, Sweden.6Institute of Environmental Medicine, Division of Cardiovascular Epidemiology Karolinska Institutet Stockholm, Sweden.7Rolf Luft Research Center for Diabetes and Endocrinology, Department of Molecular Medicine and Surgery, Karolinska Institutet, Stockholm, Sweden.
Received: 27 March 2012 Accepted: 9 June 2012 Published: 21 June 2012
References
1. World Health Organization:The world health report: Reducing risks and promoting healthy life. 2002.http://www.who.int/whr/20022002, Accessed February 1, 2012.
2. Kallings LV, Leijon ME, Kowalski J, Hellenius ML, Stahle A:Self-reported adherence: a method for evaluating prescribed physical activity in primary health care patients.J Phys Act Health2009,6:483–492. 3. Kallings LV, Sierra Johnson J, Fisher RM, Faire U, Stahle A, Hemmingsson E,
Hellenius ML:Beneficial effects of individualized physical activity on prescription on body composition and cardiometabolic risk factors: results from a randomized controlled trial.Eur J Cardiovasc Prev Rehabil 2009,16:80–84.
4. Kallings LV, Leijon M, Hellenius ML, Stahle A:Physical activity on prescription in primary health care: a follow-up of physical activity level and quality of life.Scand J Med Sci Sports2008,18:154–161.
5. Knowler WC, Barrett-Connor E, Fowler SE, Hamman RF, Lachin JM, Walker EA, Nathan DM:Reduction in the incidence of type 2 diabetes with lifestyle intervention or metformin.N Engl J Med2002,346:393–403. 6. Balducci S, Zanuso S, Nicolucci A, De Feo P, Cavallo S, Cardelli P, Fallucca S,
Alessi E, Fallucca F, Pugliese G:Effect of an intensive exercise intervention strategy on modifiable cardiovascular risk factors in subjects with type 2 diabetes mellitus: a randomized controlled trial: the Italian Diabetes and Exercise Study (IDES).Arch Intern Med2010,170:1794–1803.
7. Nicklas BJ, Ambrosius W, Messier SP, Miller GD, Penninx BW, Loeser RF, Palla S, Bleecker E, Pahor M:Diet-induced weight loss, exercise, and chronic inflammation in older, obese adults: a randomized controlled clinical trial.Am J Clin Nutr2004,79:544–551.
8. You T, Berman DM, Ryan AS, Nicklas BJ:Effects of hypocaloric diet and exercise training on inflammation and adipocyte lipolysis in obese postmenopausal women.J Clin Endocrinol Metab2004,89:1739–1746. 9. Lago F, Dieguez C, Gomez-Reino J, Gualillo O:Adipokines as emerging
mediators of immune response and inflammation.Nat Clin Pract Rheumatol2007,3:716–724.
10. Lago F, Gomez R, Gomez-Reino JJ, Dieguez C, Gualillo O:Adipokines as novel modulators of lipid metabolism.Trends Biochem Sci2009, 34:500–510.
11. Wozniak SE, Gee LL, Wachtel MS, Frezza EE:Adipose tissue: the new endocrine organ? A review article.Dig Dis Sci2009,54:1847–1856. 12. Mathieu P, Lemieux I, Després J-P:Obesity, inflammation, and
cardiovascular risk.Clin Pharmacol Ther2010,87:407–416.
13. Ronti T, Lupattelli G, Mannarino E:The endocrine function of adipose tissue: an update.Clin Endocrinol (Oxf )2006,64:355–365.
14. Tilg H, Moschen AR:Adipocytokines: mediators linking adipose tissue, inflammation and immunity.Nat Rev Immunol2006,6:772–783. 15. Guilherme A, Virbasius JV, Puri V, Czech MP:Adipocyte dysfunctions
linking obesity to insulin resistance and type 2 diabetes.Nat Rev Mol Cell Biol2008,9:367–377.
16. Kosteli A, Sugaru E, Haemmerle G, Martin JF, Lei J, Zechner R, Ferrante AW Jr:Weight loss and lipolysis promote a dynamic immune response in murine adipose tissue.J Clin Invest2011,120:3466–3479.
17. Garaulet M, Hernandez-Morante JJ, Tebar FJ, Zamora S:Relation between degree of obesity and site-specific adipose tissue fatty acid composition in a Mediterranean population.Nutrition2011,27:170–176.
18. van Dijk SJ, Feskens EJ, Bos MB, Hoelen DW, Heijligenberg R, Bromhaar MG, de Groot LC, de Vries JH, Muller M, Afman LA:A saturated fatty acid-rich diet induces an obesity-linked proinflammatory gene expression profile in adipose tissue of subjects at risk of metabolic syndrome.Am J Clin Nutr2009,90:1656–1664.
19. Sjögren P, Sierra-Johnson J, Gertow K, Rosell M, Vessby B, de Faire U, Hamsten A, Hellenius M-L, Fisher RM:Fatty acid desaturases in human adipose tissue: relationships between gene expression, desaturation indexes and insulin resistance.Diabetologia2008,51:328–335. 20. Warensjö E, Rosell M, Hellenius M-L, Vessby B, de Faire U, Risérus U:
Associations between estimated fatty acid desaturase activities in serum lipids and adipose tissue in humans: links to obesity and insulin resistance.Lipids Health Dis2009,8:37.
21. Grundy SM, Cleeman JI, Daniels SR, Donato KA, Eckel RH, Franklin BA, Gordon DJ, Krauss RM, Savage PJ, Smith SC,et al:Diagnosis and management of the metabolic syndrome. An American Heart Association/National Heart, Lung, and Blood Institute scientific statement.Circulation2005,112:2735–2752.
22. Halldin M, Rosell M, de Faire U, Hellénius M-L:The metabolic syndrome: prevalence and association to leisure-time and work-related physical activity in 60-year-old men and women.Nutr Metab Cardiovasc Dis2007, 17:349–357.
23. Katan MB, Deslypere JP, van Birgelen AP, Penders M, Zegwaard M:Kinetics of the incorporation of dietary fatty acids into serum cholesteryl esters, erythrocyte membranes, and adipose tissue: an 18-month controlled study.J Lipid Res1997,38:2012–2022.
24. Halliwell KJ, Fielding BA, Samra JS, Humphreys SM, Frayn KN:Release of individual fatty acids from human adipose tissue in vivo after an overnight fast.J Lipid Res1996,37:1842–1848.
25. Garaulet M, Pérez-Llamas F, Pérez-Ayala M, Martínez P, Sánchez de Medina F, Tebar FJ, Zamora S:Site-specific differences in the fatty acid composition of abdominal adipose tissue in an obese population from a Mediterranean area: relation with dietary fatty acids, plasma lipid profile, serum insulin, and central obesity.Am J Clin Nutr2001, 74:585–591.
26. Sutherland WHF, Woodhouse SP, Heyworth MR:Physical training and adipose tissue fatty acid composition in men.Metabolism1981, 30:839–844.
27. Connor WE, Lin DS, Colvis C:Differential mobilization of fatty acids from adipose tissue.J Lipid Res1996,37:290–298.
28. Raclot T, Groscolas R:Selective mobilization of adipose tissue fatty acids during energy depletion in the rat.J Lipid Res1995,36:2164–2173. 29. Fritsche KL:Too much linoleic acid promotes inflammation-doesn't it?
Prostaglandins Leukot Essent Fatty Acids2008,79:173–175.
30. Petersson H, Basu S, Cederholm T, Riserus U:Serum fatty acid composition and indices of stearoyl-CoA desaturase activity are associated with systemic inflammation: longitudinal analyses in middle-aged men.Br J Nutr2008,99:1186–1189.
31. Hajri T, Abumrad NA:Fatty acid transport across membranes: relevance to nutrition and metabolic pathology.Annu Rev Nutr2002,22:383–415. 32. Sharma AM, Staels B:Peroxisome proliferator-activated receptorγand
adipose tissue - understanding obesity-related changes in regulation of lipid and glucose metabolism.J Clin Endocrinol Metab2007, 92:386–395.
33. Stulnig TM, Waldhausl W:11β-hydroxysteroid dehydrogenase type 1 in obesity and type 2 diabetes.Diabetes2004,47:1–11.
34. Kunos G, Osei-Hyiaman D, Liu J, Godlewski G, Batkai S:Endocannabinoids and the control of energy homeostasis.J Biol Chem2008,
283:33021–33025.
35. Klempel MC, Varady KA:Reliability of leptin, but not adiponectin, as a biomarker for diet-induced weight loss in humans.Nutr Rev2011, 69:145–154.
36. Beckman LM, Beckman TR, Earthman CP:Changes in gastrointestinal hormones and leptin after Roux-en-Y gastric bypass procedure: a review. J Am Diet Assoc2010,110:571–584.
37. Moran CN, Barwell ND, Malkova D, Cleland SJ, McPhee I, Packard CJ, Zammit VA, Gill JMR:Effects of diabetes family history and exerise training on the expression of adiponectin and leptin and their receptors.Metabolism 2011,60:206–214.
38. Jürimäe J, Maestu J, Jurimae T, Mangus B, von Duvillard SP:Peripheral signals of energy homeostasis as possible markers of training stress in athletes: a review.Metabolism2011,60:335–350.
39. Lee MJ, Yang RZ, Gong DW, Fried SK:Feeding and insulin increase leptin translation.J Biol Chem2007,282:72–80.
inflammatory markers in obese subjects: a 12-week randomized intervention study.Am J Physiol Endocrinol Metab2010,298:E824–E831. 41. Bruun JM, Helge JW, Richelsen B, Stallknecht B:Diet and exercise reduce
low-grade inflammation and macrophage infiltration in adipose tissue but not in skeletal muscle in severely obese subjects.Am J Physiol Endocrinol Metab2006,290:E961–E967.
42. O'Gorman DJ, Krook A:Exercise and the treatment of diabetes and obesity.Med Clin North Am2011,95:953–969.
doi:10.1186/1476-511X-11-80
Cite this article as:Sjögrenet al.:Functional changes in adipose tissue in a randomised controlled trial of physical activity.Lipids in Health and Disease201211:80.
Submit your next manuscript to BioMed Central and take full advantage of:
• Convenient online submission
• Thorough peer review
• No space constraints or color figure charges
• Immediate publication on acceptance
• Inclusion in PubMed, CAS, Scopus and Google Scholar
• Research which is freely available for redistribution