R E S E A R C H
Open Access
Microarray analysis provides new insights into the
function of apolipoprotein O in HepG2 cell line
Chen-Lu Wu, Shui-Ping Zhao
*and Bi-Lian Yu
*Abstract
Background:Apolipoprotein O (apoO) is a new member of the apolipoprotein family. However, data on its physiological functions are limited and inconsistent. Using a microarray expression analysis, this study explored the function of apoO in liver cells.
Methods:HepG2 cells were treated either with oleic acid or tumor necrosis factor-αfor 24 h. mRNA and protein expression of apoO were assessed by quantitative real-time PCR (qRT-PCR) and Western blot respectively. An efficient lentiviral siRNA vector targeting the human apoO gene was designed and constructed. The gene
expression profile of HepG2 human hepatocellular carcinoma cells transfected with the apoO silencing vector was investigated using a whole-genome oligonucleotide microarray. The expression levels of some altered genes were validated using qRT-PCR.
Results:ApoO expression in HepG2 cells was dramatically affected by lipid and inflammatory stimuli. A total of 282 differentially expressed genes in apoO-silenced HepG2 cells were identified by microarray analysis. These genes included those participating in fatty acid metabolism, such asACSL4,RGS16,CROTandCYP4F11,and genes participating in the inflammatory response, such asNFKBIZ, TNFSF15, USP2, IL-17, CCL23, NOTCH2,APH-1BandN2N. The gene Uncoupling protein 2 (UCP2), which is involved in both these metabolic pathways, demonstrated significant changes in mRNA level after transfection.
Conclusions:It is likely that apoO participates in fatty acid metabolism and the inflammatory response in HepG2 cells, and UCP2 may act as a mediator between lipid metabolism and inflammation in apoO-silenced HepG2 cells.
Keywords:Apolipoprotein O, Inflammation, Lipid metabolism, Fatty acids
Background
Apolipoprotein O (apoO) is a novel apolipoprotein which was first discovered in 2006 [1], but to date, rela-tively little is known about its physiological functions. An in vitro study displayed that purified recombinant apoO facilitated cholesterol efflux from J774 mouse macrophage cells [1]. However, this effect has not been
replicated in vivo [2]. Recently, we found that apoO
levels were increased in acute coronary syndrome pa-tients and positively associated with the inflammatory marker high-sensitive C-reactive protein (hsCRP), sug-gesting a potential role as an inflammatory predictor [3]. Therefore, apoO seems to be implicated in lipid metab-olism and inflammation.
Here, the effects of lipid and inflammatory stimuli on apoO were investigated. A microarray assay was used to identify genes that are differentially expressed in apoO-silenced HepG2 cells. This study could enable the func-tion of apoO in liver cells to be elucidated.
Results
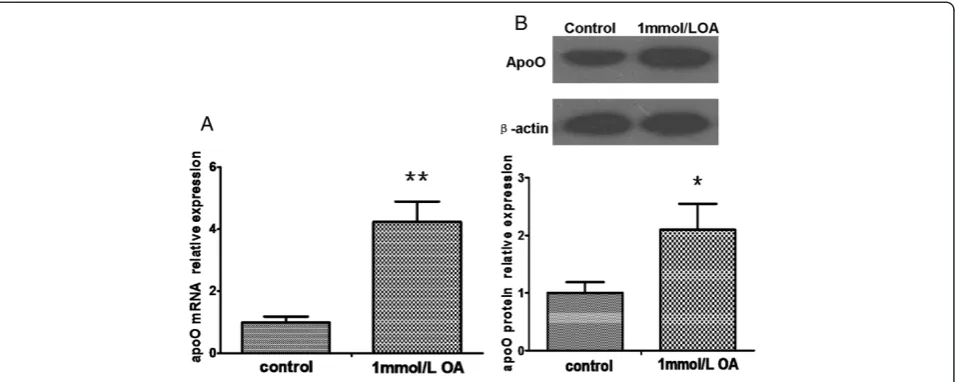
Oleic acid increased the expression of apoO in HepG2 cells
We determined if a lipid stimulus would influence the ex-pression of apoO in HepG2 cells. Figure 1 shows apoO mRNA and protein levels in cells treated with oleic acid (OA) compared with the levels in control cells. As ex-pected, incubation of HepG2 cells with 1 mmol/L OA for 24 h induced a 4-fold increase in apoO mRNA (P < 0.01) and a 2-fold increase in apoO protein expression (P < 0.05).
* Correspondence:[email protected];[email protected] Department of Cardiology, the Second Xiangya Hospital of Central South University, Middle Ren-Min Road No.139, Changsha, Hunan 410011, PR China
© 2013 Wu et al.; licensee BioMed Central Ltd. This is an Open Access article distributed under the terms of the Creative Commons Attribution License (http://creativecommons.org/licenses/by/2.0), which permits unrestricted use, distribution, and reproduction in any medium, provided the original work is properly cited. The Creative Commons Public Domain Dedication waiver (http://creativecommons.org/publicdomain/zero/1.0/) applies to the data made available in this article, unless otherwise stated.
Tumor necrosis factor-αinduced the expression of apoO in HepG2 cells
To explore the effect of inflammatory stimulus on the expression of apoO, we detected apoO mRNA and protein expression changes in HepG2 cells pre-treated for 24 h with 100 ng/mL tumor necrosis
factor-α (TNF-α). Quantitative real-time PCR
(qRT-PCR) demonstrated that TNF-α treatment led to a
3-fold up-regulation of apoO mRNA expression (P < 0.01; Figure 2A). ApoO protein levels were ap-proximately 2.5-fold higher after incubation (P < 0.05; Figure 2B).
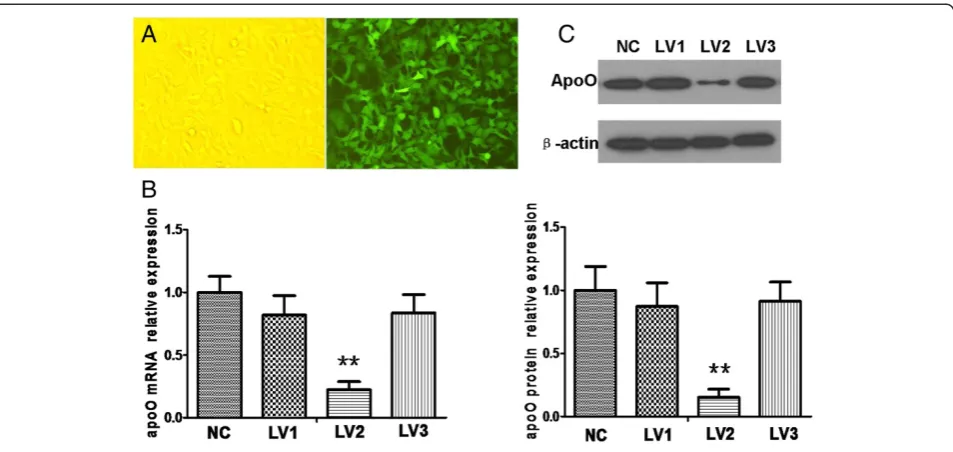
LV2 was identified as an efficient vector capable of silencing apoO
Using GenBank information for the human apoO gene, three interfering sequences and a negative control sequence were designed and designated as LV1, LV2, LV3 and NC. PCR identification and DNA sequencing demonstrated the correct insertion of the oligonucleotides into the vectors. qRT-PCR and Western blot analysis confirmed that LV2 could significantly inhibit apoO expression in HeLa cells when the multiplicity of infection (MOI) =10 (P < 0.001; Figure 3), whereas LV1 and LV3 had no apparent effect (P > 0.05).
Figure 1ApoO mRNA and protein changes in HepG2 cells pretreated with 1 mmol/L OA for 24 h. A. The relative levels of apoO mRNA were analyzed by qRT-PCR. Data shown are the mean ± S.E.M from experiments repeated in triplicate with three samples per treatment.**p < 0.01 vs. control.B. The relative levels of apoO protein were analyzed by Western blot analysis.β-actin served as a loading control. These experi-ments were performed three times, and the results of the densitometric analysis and one representative image are shown.*p < 0.05 vs. control.
Figure 2Levels of ApoO mRNA and protein in HepG2 cells pretreated with 100 ng/mL TNF-αfor 24 h. A. The relative levels of apoO mRNA were analyzed by qRT-PCR. Data shown are the mean ± S.E.M from experiments repeated in triplicate with three samples per treatment. **p < 0.01 vs. control.B. The relative levels of apoO protein were analyzed by Western blot analysis.β-actin served as a loading control. These ex-periments were performed three times, and the results of the densitometric analysis and one representative image are shown.*p < 0.05 vs. control.
Wuet al. Lipids in Health and Disease2013,12:186 Page 2 of 10
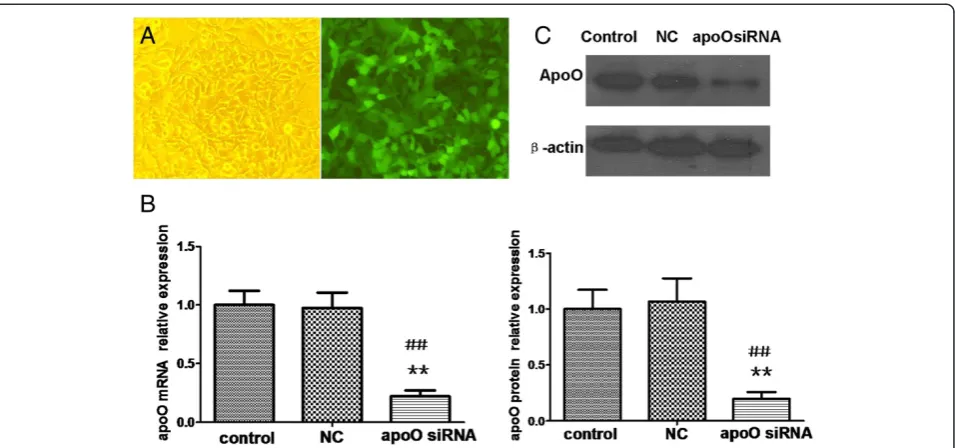
The LV2 lentiviral vector could dramatically suppress apoO expression in HepG2 cells
Three days after infection, HepG2 cells were visualized using fluorescence microscopy. A comparison between the bright-field and fluorescent images showed that most cells had green fluorescent signals when MOI = 20 (Figure 4A). The levels of apoO mRNA and protein were analyzed 5 days and 7 days after transfection, respect-ively. The level of apoO mRNA in cells transfected with apoO-specific-RNAi lentivirus was decreased by ap-proximately 78% (P < 0.01) compared to the control cells (Figure 4B). ApoO protein was also down-regulated by approximately 80% in cells with the apoO-specific RNAi (P < 0.01; Figure 4C).
Differentially expressed genes in apoO-silenced HepG2 cells
Comparison of mRNA levels between negative control cells (NC) and apoO-silenced cells (LV) revealed that many genes were differentially expressed. In summary, the expression of 282 genes was significantly altered: 192 genes were up-regulated and 90 genes were down-regulated (≥2 fold up- or down-down-regulated; Figure 5A,
n = 6, P < 0.05). The expression of the FBXL21 gene,
which showed the strongest up-regulation, was increased
by 5.142-fold, whereas the expression of the HRBgene,
which showed the strongest down-regulation, was de-creased by 6.485-fold. Of the genes with altered
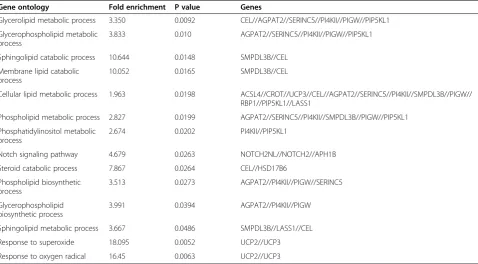
expression patterns, 18 were involved in lipid metabol-ism (Table 1) and 16 were involved in inflammation (Table 2). Moreover, gene ontology (GO) analysis identi-fied involvement of the differentially expressed genes in several cellular biological processes, such as 1) glyceroli-pid metabolism, 2) glycerophospholiglyceroli-pid metabolism, 3) sphingolipid catabolism, 4) membrane lipid catabolism, 5) cellular lipid metabolism, 6) phospholipid metabolism, 7) phosphatidylinositol metabolism, 8) the Notch signal-ing pathway, 9) steroid catabolism, 10) phospholipid biosynthetic processes, 11) glycerophospholipid biosyn-thetic processes, 12) sphingolipid metabolism, 13) re-sponse to superoxide, and 14) rere-sponse to oxygen radicals (Table 3).
Confirmation of microarray results by qRT-PCR
To validate the microarray results, we assessed the ex-pression of a subset of genes with qRT-PCR, including: NFKBIZ, FBXL21, HRB, NOTCH2, UCP2, ACSL4 and
CEL. The high concordance of expression levels found
between the microarray analysis and the qRT-PCR re-sults for these genes confirmed that the microarray data were reliable (Figure 5B).
Discussion
The liver is the most metabolically active organ in the hu-man body and is responsible for hu-many vital functions, in-cluding lipid metabolism. Triglycerides (TGs) accumulate Figure 3Screening for an efficient lentiviral vector capable of silencing apoO expression. A. HeLa cells observed by fluorescence
microscopy 3 days after infection (magnification, ×200).B. The relative levels of apoO mRNA transcripts were analyzed by qRT-PCR. Data shown are means ± S.E.M from three independent experiments.**p < 0.001 vs. negative controls (NC).C. Effects of apoO silencing were measured using Western blot. NC: cells infected with negative control RNAi; LV1: cells infected with apoO-specific RNAi-1; LV2: cells infected with apoO-specific RNAi-2; LV3: cells infected with apoO-specific RNAi-3.β-actin served as a loading control. These experiments were performed three times, and the results of the densitometric analysis and one representative image are shown.**p < 0.001 vs. negative control (NC).
Wuet al. Lipids in Health and Disease2013,12:186 Page 3 of 10
within hepatocytic lipid droplets. Notably, both the lipolysis and synthesis of TG can produce FAs and specific toxic lipid intermediates that activate intracellular inflammatory pathways. FA oxidation provides a major source of reactive oxygen species (ROS). During the process of hydrolysis, TG expands the availability of FA to metabolic pathways, such as peroxidation; increases ROS; and, subsequently, in-creases levels of oxidative stress. Oxidative stress results in
the activation of several key pro-inflammatory signaling
pathways, including the nuclear factor-kappa B (NF-κB)
pathway [4]. Conversely, although TG synthesis decreases cellular FA concentrations, this process also generates other potentially toxic lipid intermediates [5]. Therefore, dysfunc-tional FA metabolism influences the cellular inflammatory state and is involved in the pathogenesis of liver disorders, such as non-alcoholic fatty liver disease (NAFLD) [6]. Figure 4Down-regulation of apoO expression in HepG2 cells using lentivirus-mediated RNAi. A. HepG2 cells were observed by
fluorescence microscopy 3 days after infection (magnification, ×200).B. The relative levels of apoO mRNA were analyzed by qRT-PCR. Data shown are the means ± S.E.M of experiments repeated three times with triplicate samples per treatment.**p < 0.01 vs. NC;##p < 0.01 vs. control.C. Ef-fects of apoO silencing were measured using Western blots.β-actin served as a loading control. These experiments were performed three times, and the results of the densitometric analysis and one representative image are shown.**p < 0.01 vs. NC;##p < 0.01 vs. control.
Figure 5Differentially expressed genes and verification. A. Hierarchical clustering of differentially expressed genes in the negative control group vs. the interference group. The rows show individual genes, while the columns show individual tissue samples. Red denotes high expression and blue denotes low expression.B. Comparison of the expression levels of genes as fold-changes between the negative control group and the apoO-silenced group by microarray analysis and qRT-PCR. Assays were performed from each RNA sample in triplicate. Data were normalized using GAPDH as an endogenous control for RNA input. Fold-changes for these microRNAs from the microarray and qRT-PCR are shown as means ± S.E.M. (n = 6 for each group).
Wuet al. Lipids in Health and Disease2013,12:186 Page 4 of 10
Table 1 Differential expressed genes related to lipid metabolism
Gene name NCBIGene ID Fold change FDR P value Description
CEL BC042510 2.383↑ 0.999 0.030 Carboxyl ester lipase(bile salt-stimulated lipase)
CROT BC051874 2.271↓ 0.999 0.037 Carnitine O-octanoyltransferase
AGPAT2 NM_006412 2.025↓ 0.999 0.015 1-acylglycerol-3-phosphate O-acyltransferase 2 (lysophospha-tidic acid acyltransferase, beta)
CYP4F11 NM_021187 2.490↓ 0.999 0.014 Cytochrome P450, family 4, subfamily F, polypeptide 11
PI4KII NM_018425 2.140↓ 0.999 0.046 Phosphatidylinositol 4-kinase type II
PIP5KL1 NM_173492 2.171↓ 0.999 0.017 Phosphatidylinositol-4-phosphate 5-kinase-like 1
G6PC2 BC104778 2.091↑ 0.999 0.014 Glucose-6-phosphatase,catalytic,2
SERINC5 BC101281 2.586↑ 0.999 0.018 Serine incorporator 5
SMPDL3B NM_001009568 2.000↑ 0.999 0.037 Sphingomyelin phosphodiesterase, acid-like 3B
ACSL4 NM_004458 2.803↑ 0.999 0.017 Acyl-CoA synthetase long-chain family member 4
RBP1 NM_002899 2.031↑ 0.999 0.044 Retinol binding protein 1, cellular
LASS1 NM_198207 2.018↑ 0.999 0.014 LAG1 longevity assurance homolog 1 (S. cerevisiae)
HSD17B6 NM_003725 2.051↓ 0.999 0.033 Hydroxysteroid(17-beta) dehydrogenase 6
PIGW BC033540 2.201↑ 0.999 0.016 Phosphatidylinositol glycan, class W
RGS16 NM_002928 2.936↑ 0.999 0.023 Regulator of G-protein signalling 16
KLF5 NM_001730 2.192↓ 0.999 0.016 Kruppel-like factor 5 (intestinal)
UCP2 NM_003355 2.248↓ 0.999 0.028 Uncoupling protein 2 (mitochondrial, proton carrier)
UCP3 NM_003356 2.420↓ 0.999 0.006 Uncoupling protein 3 (mitochondrial, proton carrier)
Abbreviations: FDRFalse discovery rate,↑= increased,↓= decreased.
Wu
et
al.
Lipids
in
Health
and
Disease
2013,
12
:186
Page
5
o
f
1
0
http://ww
w.lipidworld
.com/content
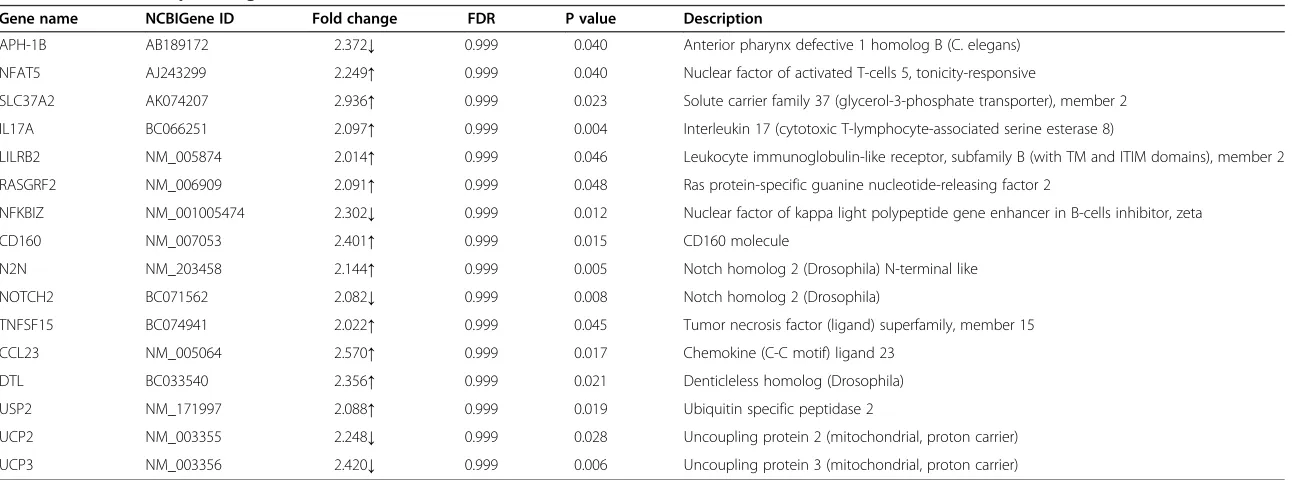
Table 2 Differential expressed genes related to inflammation
Gene name NCBIGene ID Fold change FDR P value Description
APH-1B AB189172 2.372↓ 0.999 0.040 Anterior pharynx defective 1 homolog B (C. elegans)
NFAT5 AJ243299 2.249↑ 0.999 0.040 Nuclear factor of activated T-cells 5, tonicity-responsive
SLC37A2 AK074207 2.936↑ 0.999 0.023 Solute carrier family 37 (glycerol-3-phosphate transporter), member 2
IL17A BC066251 2.097↑ 0.999 0.004 Interleukin 17 (cytotoxic T-lymphocyte-associated serine esterase 8)
LILRB2 NM_005874 2.014↑ 0.999 0.046 Leukocyte immunoglobulin-like receptor, subfamily B (with TM and ITIM domains), member 2
RASGRF2 NM_006909 2.091↑ 0.999 0.048 Ras protein-specific guanine nucleotide-releasing factor 2
NFKBIZ NM_001005474 2.302↓ 0.999 0.012 Nuclear factor of kappa light polypeptide gene enhancer in B-cells inhibitor, zeta
CD160 NM_007053 2.401↑ 0.999 0.015 CD160 molecule
N2N NM_203458 2.144↑ 0.999 0.005 Notch homolog 2 (Drosophila) N-terminal like
NOTCH2 BC071562 2.082↓ 0.999 0.008 Notch homolog 2 (Drosophila)
TNFSF15 BC074941 2.022↑ 0.999 0.045 Tumor necrosis factor (ligand) superfamily, member 15
CCL23 NM_005064 2.570↑ 0.999 0.017 Chemokine (C-C motif) ligand 23
DTL BC033540 2.356↑ 0.999 0.021 Denticleless homolog (Drosophila)
USP2 NM_171997 2.088↑ 0.999 0.019 Ubiquitin specific peptidase 2
UCP2 NM_003355 2.248↓ 0.999 0.028 Uncoupling protein 2 (mitochondrial, proton carrier)
UCP3 NM_003356 2.420↓ 0.999 0.006 Uncoupling protein 3 (mitochondrial, proton carrier)
Abbreviations: FDRFalse discovery rate,↑= increased,↓= decreased.
Wu
et
al.
Lipids
in
Health
and
Disease
2013,
12
:186
Page
6
o
f
1
0
http://ww
w.lipidworld
.com/content
The present study demonstrates that the exposure of
HepG2 cells to OA as well as TNF-α can result in the
increased expression of apoO. To account for this phenomenon, we examined gene expression in apoO-silenced HepG2 cells with the use of microarrays. Ac-cording to our microarray data, silencing apoO in HepG2 cells leads to the differential expression of sev-eral important lipid signaling and inflammation genes.
FA metabolism
In comparison with the negative control cells, ACSL4
was up-regulated in apoO-silenced HepG2 cells. ACSL4
encodes an isoform of the long-chain acyl-CoA synthe-tase (ACSL), which catalyzes acyl-CoA synthesis by con-verting long-chain FA to acyl-CoA. African-American NAFLD patients over-express ACSL4 [7]; ACSL4 mRNA levels have been positively associated with liver TG
con-centrations [8]. Thus, increasedACSL4expression could
indicate an up-regulation of TG synthesis.
Mitochondria are the major site of FA oxidation.
RGS16 encodes a protein which inhibits G
protein-coupled receptor (GPCR)-stimulated FA oxidation in liver mitochondria [9]. Its expression increased after
transfection. CROT and CYP4F11 encode two key FA
oxidation enzymes, respectively. In the peroxisome, stor-age of medium chain acyls slows down peroxisomal beta oxidation. When CROT activity increases, the level of medium chain acyls decreases as they are converted into acyl-carnitines [10]. In the microsome, another FA oxi-dation site, CYP4F11 is the predominant catalyst of FA
omega hydroxylation [11]. Within this context, silencing
of apoO with altered RGS16, CROTand CYP4F11
ex-pression would modulate not only FA oxidation rates but also cellular TG content.
Inflammatory responses
The NF-κB protein family includes transcription factors
that regulate crucial cellular processes, such as the
inflam-mation response.NFKBIZencodes a novel member of the
IκB family, IκB zeta. IκB zeta associates with both the p65 and p50 subunits of NF-κB and inhibits the transcriptional
activity and DNA binding of NF-κB [12]. USP2 is a
ubiquitin-specific protease which is required for the phos-phorylation of IκB and functions as an additional positive regulator of TNF-α-induced NF-κB signaling [13]. The
pro-tein encoded byTNFSF15 gene is a cytokine that belongs
to the tumor necrosis factor ligand family and is capable of activating NF-κB [14]. In addition, the two cytokines IL-17 and CCL23 may induce inflammatory gene expression by interaction with the NF-κB pathway [15,16]. As apoO
silen-cing in HepG2 cells resulted in down-regulation ofNFKBIZ
and up-regulation of the pro-inflammatory molecules men-tioned above, it is possible that apoO may exert anti-inflammatory effects through suppressing NF-κB pathway.
Notch signaling is involved in the inflammatory re-sponse [17]. There is complex crosstalk between the
Notch 2 and NF-κB pathways as both pathways can
exert either synergistic or antagonistic effects depending on different cellular contexts [18-20]. APH-1 is one of
the four components of γ-secretase complex, which is
Table 3 GO analysis of the differentially expressed genes
Gene ontology Fold enrichment P value Genes
Glycerolipid metabolic process 3.350 0.0092 CEL//AGPAT2//SERINC5//PI4KII//PIGW//PIP5KL1
Glycerophospholipid metabolic process
3.833 0.010 AGPAT2//SERINC5//PI4KII//PIGW//PIP5KL1
Sphingolipid catabolic process 10.644 0.0148 SMPDL3B//CEL
Membrane lipid catabolic process
10.052 0.0165 SMPDL3B//CEL
Cellular lipid metabolic process 1.963 0.0198 ACSL4//CROT//UCP3//CEL//AGPAT2//SERINC5//PI4KII//SMPDL3B//PIGW// RBP1//PIP5KL1//LASS1
Phospholipid metabolic process 2.827 0.0199 AGPAT2//SERINC5//PI4KII//SMPDL3B//PIGW//PIP5KL1
Phosphatidylinositol metabolic process
2.674 0.0202 PI4KII//PIP5KL1
Notch signaling pathway 4.679 0.0263 NOTCH2NL//NOTCH2//APH1B
Steroid catabolic process 7.867 0.0264 CEL//HSD17B6
Phospholipid biosynthetic process
3.513 0.0273 AGPAT2//PI4KII//PIGW//SERINC5
Glycerophospholipid biosynthetic process
3.991 0.0394 AGPAT2//PI4KII//PIGW
Sphingolipid metabolic process 3.667 0.0486 SMPDL3B//LASS1//CEL
Response to superoxide 18.095 0.0052 UCP2//UCP3
Response to oxygen radical 16.45 0.0063 UCP2//UCP3
Wuet al. Lipids in Health and Disease2013,12:186 Page 7 of 10
responsible for the release of the notch intracellular do-main (NICD) into the cytoplasm. These subunits are
suf-ficient and required for γ-secretase activity [21]. The
product ofN2Ngene is homologous to Notch 2.In vitro,
N2N repressed the transcriptional activity of the Notch 2 protein in a dose-dependent manner [22]. Our
micro-array data showed that activation of NF-κB pathway was
accompanied by impaired expression ofNotch2,APH-1B
and enhanced expression ofN2N, suggesting the
antag-onistic effect between the NF-κB and Notch 2 signaling
pathways in apoO-silenced HepG2 cells.
Uncoupling proteins
Uncoupling protein (UCP) 2 and UCP3 are members of a mitochondrial carrier protein superfamily that controls
the level of respiration coupling. The UCP2 and UCP3
genes are located together in a gene cluster, but the pat-tern of their expression is very different. UCP3 is pri-marily expressed in skeletal muscle tissue, whereas UCP2 is expressed widely. Although these two uncoup-ling proteins are thought to have similar physiological
functions [23], the changes ofUCP2 expression levels in
liver cells may be more significant. UCP2 can dissipate the proton gradient across the mitochondrial inner membrane to prevent the proton-motive force from be-coming excessive, thus limiting mitochondrial ROS pro-duction. It acts as a sensor for mitochondrial oxidative stress and protects against oxidative damage by control-ling the production of ROS [24]. UCP2 is also implicated in fat oxidation and the regulation of fat content. It functions as a metabolic switch that is involved in the choice of substrate oxidized by mitochondria which pro-motes FA metabolism over glucose utilization [25]. It
could be speculated that reduction of UCP2 expression
in apoO-silenced HepG2 cells would lead to mitochon-drial dysfunction accompanied by elevated ROS produc-tion and oxidative stress in hepatocytes. Subsequently, mitochondria might regulate the generation of ROS by altering the activity levels of enzymes that can affect FA oxidation. Therefore, reduction of UCP2 provides a pos-sible mechanism in which FA metabolism and ROS-induced inflammatory responses can be simultaneously modulated in HepG2 cells after the silencing of apoO.
Limitations
Some limitations of this study should be considered. Firstly, although the HepG2 hepatoma cell line is fre-quently used to study apolipoprotein metabolism, they are not the gold standard model for the study of the na-tive liver. Therefore, gene expression changes related to apoO in our study may not reflect those that occur in liver in vivo. Secondly, we have only reported the result of an experiment that illustrated that apoO expression
was dramatically affected by OA and TNF-α, but
changes in inflammation and lipid metabolism genes in apoO-silenced HepG2 cells pretreated either with OA or
TNF-αwere not explored. Hence, the exact mechanisms
involved in apoO-dependent changes in gene expression have yet to be elucidated. In addition, apoO, besides be-ing secreted, could reside within cells where it is expressed [1]. It may affect hepatocytes as a paracrine and/or autocrine factor, or even as an intracellular pro-tein. This study did not differentiate whether changes of gene expression are due to the secreted apoO, or due to the intracellular apoO.
Conclusions
Our findings provide significant data to propose a role for apoO in HepG2 cells. Using a whole-genome micro-array analysis, we have demonstrated that apoO may play an active role in FA metabolism in HepG2 cells by inhibiting TG synthesis and promoting FA oxidation. Furthermore, it is possible that apoO could suppress
hepatic inflammationviathe NF-κB and Notch 2
signal-ing pathways. UCP2 provides an underlysignal-ing connection between the changes in expression levels of lipid metab-olism and inflammatory response genes in apoO-silenced HepG2 cells.
Materials and methods Cell culture
HepG2 cells and HeLa cells (originally obtained from the American Type Culture Collection, ATCC) were
maintained in Dulbecco’s modified Eagle’s medium
(DMEM; Invitrogen, Carlsbad, CA, USA) at 37°C under 5% CO2, supplemented with 10% fetal bovine serum (FBS; Invitrogen, Carlsbad, CA, USA).
For experimental incubations, cells were washed once in serum-free medium for 2 h. The medium was then re-placed or cells were incubated with this medium with the addition of 1 mmol/L OA (Sigma, St. Louis, MO,
USA) or 100 ng/mL TNF-α(Sigma, St. Louis, MO, USA)
for 24 h.
RNA isolation and qRT-PCR analysis
Total cellular RNA was isolated using Trizol reagent (Invitrogen, Carlsbad, CA, USA) according to the manu-facturer’s instructions, and was quantified using a Nano-Drop Spectrophotometer (Nanodrop, Rockland, DE, USA). cDNA was synthesized using a cDNA Synthesis Kit (Fermentas, Burlington, Ontario, Canada). qRT-PCR was performed with the SYBR Green Master Mix re-agent (ABI, Foster City, CA, USA) in an ABI 7300
RT-PCR apparatus according to the manufacturer’s protocol.
For each gene, qRT-PCR was run on each sample in triplicate. Transcript levels were normalized using GAPDH RNA quantification. The results of the qRT-PCR were statistically analyzed with SigmaStat software
Wuet al. Lipids in Health and Disease2013,12:186 Page 8 of 10
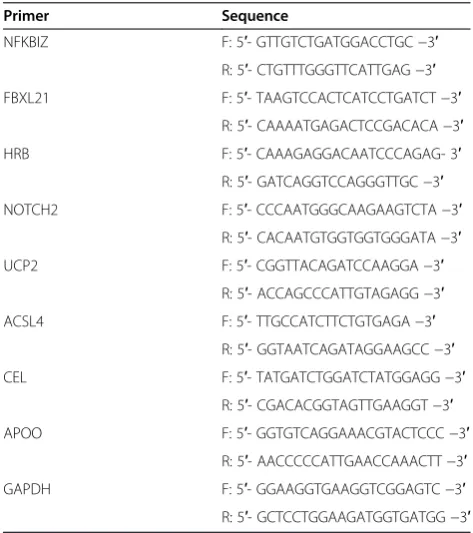
(SPSS). PCR primers used in the validation and stimula-tion tests are listed in Table 4.
Protein extractions and Western blots
Extraction of cellular protein and Western blot analyses were carried out as previously described [26]. The pro-tein bands were detected using ECL detection reagents (Pierce Biotechnology, Rockford, IL, USA) and quanti-fied by densitometric analysis.
Construction of the lentiviral vectors
Complementary DNAs containing both the sense and antisense oligo DNAs of the targeting sequences were synthesized, and were annealed into double-stranded DNA. The DNA products obtained were cloned into the lentiviral pFU-GW-iRNA vector (GeneChem, Shanghai, China) to construct the experimental vectors, which were then identified by PCR and DNA sequencing. The successfully constructed vectors were packaged using a packaging plasmid mix. The virus titers were tested. HeLa cells were infected by the lentivirus constructs, and the efficiencies of apoO interference were identified by qRT-PCR and Western blot.
SiRNA silencing
The day before transfection, cells were seeded into 6-well culture plates at a density of 105 cells per well. On the day of transfection, they were infected with the lenti-viral constructs (either the apoO-silencing vector or the
negative control vector) at a favorable MOI. At 12 h after transfection, the medium was replaced. Cells were collected for RNA isolation and qRT-PCR analysis 5 days after transfection. Seven days after transfection, cellular proteins were extracted and Western blot analyses were conducted.
Microarray analysis
About 5μg total RNA from each sample was used for label-ing and array hybridization as follows: 1) reverse transcrip-tion was carried out using the Invitrogen Superscript ds-cDNA Synthesis Kit (Invitrogen, Carlsbad, CA, USA); 2) ds-cDNA was labelled using the NimbleGen one-color DNA Labeling Kit (Roche NimbleGen, Madison, WI, USA); 3) array hybridization was performed using the NimbleGen Hybridization System (Roche NimbleGen, Madison, WI, USA), followed by washing with the Nimble-Gen Wash Buffer Kit (Roche NimbleNimble-Gen, Madison, WI, USA); 4) array scanning was carried out using the Axon GenePix 4000B Microarray Scanner (Molecular Devices Corporation). The data files were imported into Agilent GeneSpring Software (Agilent, version 11.5) for analysis. The gene expression levels in cells transfected with the effi-cient siRNA were normalized to that in cells transfected with the negative control siRNA. The microarray experi-ment was independently repeated in triplicate. Genes that were differentially expressed were identified by filtering the mean ratios of fold-changes from replicates using P-value thresholds (fold change≥2 and P < 0.05) based on at-test analysis. To determine the potential biological functions and pathways of differentially expressed genes, GO and pathway analyses were applied. Finally, Hierarchical Clus-tering was performed to show distinguishable gene expres-sion profiling among samples.
Statistical analysis
Data were depicted as means ± S.E.M. Statistical analyses were performed using SPSS software (Version 16.0, SPSS Inc., Chicago, IL, USA). Single comparisons were per-formed using the unpaired Student’s t-test with a value of p≤0.05 considered as significant.
Abbreviations
ApoO:Apolipoprotein O; hsCRP: High-sensitive C-reactive protein; OA: Oleic acid; TNF-α: Tumor necrosis factor-α; qRT-PCR: Quantitative real-time PCR; GO: Gene ontology; TG: Triglyceride; ROS: Reactive oxygen species; NF-κB: Nuclear factor-kappa B; NAFLD: Non-alcoholic fatty liver disease; ACSL: Long-chain acyl-CoA synthetase; GPCR: G protein-coupled receptor; NICD: Notch intracellular domain; UCP: Uncoupling protein; MOI: Multiplicity of infection.
Competing interests
The authors declare that they have no competing interests.
Authors’contributions
CLW performed all experiments and statistical analysis and drafted the manuscript. BLY and SPZ conceived and designed this study, participated in
Table 4 Real-time PCR primers used in the validation and stimulation tests
Primer Sequence
NFKBIZ F: 5′- GTTGTCTGATGGACCTGC−3′
R: 5′- CTGTTTGGGTTCATTGAG−3′
FBXL21 F: 5′- TAAGTCCACTCATCCTGATCT−3′
R: 5′- CAAAATGAGACTCCGACACA−3′
HRB F: 5′- CAAAGAGGACAATCCCAGAG- 3′
R: 5′- GATCAGGTCCAGGGTTGC−3′
NOTCH2 F: 5′- CCCAATGGGCAAGAAGTCTA−3′
R: 5′- CACAATGTGGTGGTGGGATA−3′
UCP2 F: 5′- CGGTTACAGATCCAAGGA−3′
R: 5′- ACCAGCCCATTGTAGAGG−3′
ACSL4 F: 5′- TTGCCATCTTCTGTGAGA−3′
R: 5′- GGTAATCAGATAGGAAGCC−3′
CEL F: 5′- TATGATCTGGATCTATGGAGG−3′
R: 5′- CGACACGGTAGTTGAAGGT−3′
APOO F: 5′- GGTGTCAGGAAACGTACTCCC−3′
R: 5′- AACCCCCATTGAACCAAACTT−3′
GAPDH F: 5′- GGAAGGTGAAGGTCGGAGTC−3′
R: 5′- GCTCCTGGAAGATGGTGATGG−3′
Wuet al. Lipids in Health and Disease2013,12:186 Page 9 of 10
discussion of the results and helped to revise the manuscript. All authors read and approved the final manuscript.
Acknowledgements
This study is supported by a grant from National Natural Science Foundation of China (NSCF), Grant No: 81000123 (Yu B.L).
Received: 5 October 2013 Accepted: 13 December 2013 Published: 17 December 2013
References
1. Lamant M, Smih F, Harmancey R, Philip-Couderc P, Pathak A, Roncalli J, Galinier M, Collet X, Massabuau P, Senard JM,et al:ApoO, a novel apolipo-protein, is an original glycoprotein up-regulated by diabetes in human heart.J Biol Chem2006,281(47):36289–36302.
2. Nijstad N, de Boer JF, Lagor WR, Toelle M, Usher D, Annema W, der Giet M, Rader DJ, Tietge UJ:Overexpression of apolipoprotein O does not impact on plasma HDL levels or functionality in human apolipoprotein A-I trans-genic mice.Biochim Biophys Acta2011,1811(4):294–299.
3. Yu BL, Wu CL, Zhao SP:Plasma apolipoprotein O level increased in the patients with acute coronary syndrome.J Lipid Res2012,53(9):1952–1957. 4. Farrell GC, van Rooyen D, Gan L, Chitturi S:NASH is an inflammatory
disorder: pathogenic, prognostic and therapeutic implications.Gut Liver
2012,6(2):149–171.
5. Holland WL, Brozinick JT, Wang LP, Hawkins ED, Sargent KM, Liu Y, Narra K, Hoehn KL, Knotts TA, Siesky A,et al:Inhibition of ceramide synthesis ameliorates glucocorticoid-, saturated-fat-, and obesity-induced insulin resistance.Cell Metab2007,5(3):167–179.
6. Hijona E, Hijona L, Arenas JI, Bujanda L:Inflammatory mediators of hepatic steatosis.Mediators Inflamm2010,2010:837419.
7. Stepanova M, Hossain N, Afendy A, Perry K, Goodman ZD, Baranova A, Younossi Z:Hepatic gene expression of Caucasian and African-American patients with obesity-related non-alcoholic fatty liver disease.Obes Surg
2010,20(5):640–650.
8. Westerbacka J, Kolak M, Kiviluoto T, Arkkila P, Siren J, Hamsten A, Fisher RM, Yki-Jarvinen H:Genes involved in fatty acid partitioning and binding, lip-olysis, monocyte/macrophage recruitment, and inflammation are overex-pressed in the human fatty liver of insulin-resistant subjects.
Diabetes2007,56(11):2759–2765.
9. Pashkov V, Huang J, Parameswara VK, Kedzierski W, Kurrasch DM, Tall GG, Esser V, Gerard RD, Uyeda K, Towle HC,et al:Regulator of G protein signaling (RGS16) inhibits hepatic fatty acid oxidation in a carbohydrate response element-binding protein (ChREBP)-dependent manner.J Biol Chem2011,286(17):15116–15125.
10. Le Borgne F, Ben Mohamed A, Logerot M, Garnier E, Demarquoy J:
Changes in carnitine octanoyltransferase activity induce alteration in fatty acid metabolism.Biochem Biophys Res Commun2011,409(4):699–704. 11. Dhar M, Sepkovic DW, Hirani V, Magnusson RP, Lasker JM:Omega
oxidation of 3-hydroxy fatty acids by the human CYP4F gene subfamily enzyme CYP4F11.J Lipid Res2008,49(3):612–624.
12. Totzke G, Essmann F, Pohlmann S, Lindenblatt C, Janicke RU, Schulze-Osthoff K:A novel member of the IkappaB family, human IkappaB-zeta, inhibits transactivation of p65 and its DNA binding.J Biol Chem2006,
281(18):12645–12654.
13. Metzig M, Nickles D, Falschlehner C, Lehmann-Koch J, Straub BK, Roth W, Boutros M:An RNAi screen identifies USP2 as a factor required for TNF-alpha-induced NF-kappaB signaling.Int J Cancer2011,129(3):607–618. 14. Endo K, Kinouchi Y, Kakuta Y, Ueki N, Takahashi S, Shimosegawa T:
Involvement of NF-kappa B pathway in TL1A gene expression induced by lipopolysaccharide.Cytokine2010,49(2):215–220.
15. Sparna T, Retey J, Schmich K, Albrecht U, Naumann K, Gretz N, Fischer HP, Bode JG, Merfort I:Genome-wide comparison between IL-17 and com-bined TNF-alpha/IL-17 induced genes in primary murine hepatocytes. BMC Genomics2010,11:226.
16. Kim J, Kim YS, Ko J:CK beta 8/CCL23 induces cell migration via the Gi/Go protein/PLC/PKC delta/NF-kappa B and is involved in inflammatory responses.Life Sci2010,86(9–10):300–308.
17. Zhang Q, Wang C, Liu Z, Liu X, Han C, Cao X, Li N:Notch signal suppresses Toll-like receptor-triggered inflammatory responses in macrophages by inhibiting extracellular signal-regulated kinase 1/2-mediated nuclear fac-tor kappaB activation.J Biol Chem2012,287(9):6208–6217.
18. Quillard T, Charreau B:Impact of notch signaling on inflammatory responses in cardiovascular disorders.Int J Mol Sci2013,14(4):6863–6888. 19. Moran ST, Cariappa A, Liu H, Muir B, Sgroi D, Boboila C, Pillai S:Synergism
between NF-kappa B1/p50 and Notch2 during the development of mar-ginal zone B lymphocytes.J Immunol2007,179(1):195–200.
20. Espinosa L, Ingles-Esteve J, Robert-Moreno A, Bigas A:IkappaBalpha and p65 regulate the cytoplasmic shuttling of nuclear corepressors: cross-talk between Notch and NFkappaB pathways.Mol Biol Cell2003,
14(2):491–502.
21. Steiner H, Fluhrer R, Haass C:Intramembrane proteolysis by gamma-secretase.J Biol Chem2008,283(44):29627–29631.
22. Duan Z, Li FQ, Wechsler J, Meade-White K, Williams K, Benson KF, Horwitz M:A novel notch protein, N2N, targeted by neutrophil elastase and im-plicated in hereditary neutropenia.Mol Cell Biol2004,24(1):58–70. 23. Brand MD, Esteves TC:Physiological functions of the mitochondrial
uncoupling proteins UCP2 and UCP3.Cell Metab2005,2(2):85–93. 24. Donadelli M, Dando I, Fiorini C, Palmieri M:UCP2, a mitochondrial protein
regulated at multiple levels.Cell Mol Life Sci2013:[Epub ahead of print]. 25. Emre Y, Nubel T:Uncoupling protein UCP2: when mitochondrial activity
meets immunity.FEBS Lett2010,584(8):1437–1442.
26. Zheng XY, Zhao SP, Yu BL, Wu CL, Liu L:Apolipoprotein A5 internalized by human adipocytes modulates cellular triglyceride content.Biol Chem
2012,393(3):161–167.
doi:10.1186/1476-511X-12-186
Cite this article as:Wuet al.:Microarray analysis provides new insights into the function of apolipoprotein O in HepG2 cell line.Lipids in Health and Disease201312:186.
Submit your next manuscript to BioMed Central and take full advantage of:
• Convenient online submission • Thorough peer review
• No space constraints or color figure charges • Immediate publication on acceptance
• Inclusion in PubMed, CAS, Scopus and Google Scholar
• Research which is freely available for redistribution
Submit your manuscript at www.biomedcentral.com/submit
Wuet al. Lipids in Health and Disease2013,12:186 Page 10 of 10